NLRB Stats Archive

NLRB Stats Archive › How it’s built

How it’s built

The pipeline

Four stages, from scanned report to published table. The diagrams come from the rebuild post, where each stage is explained in full.

codeClaudea personfiles and outputs
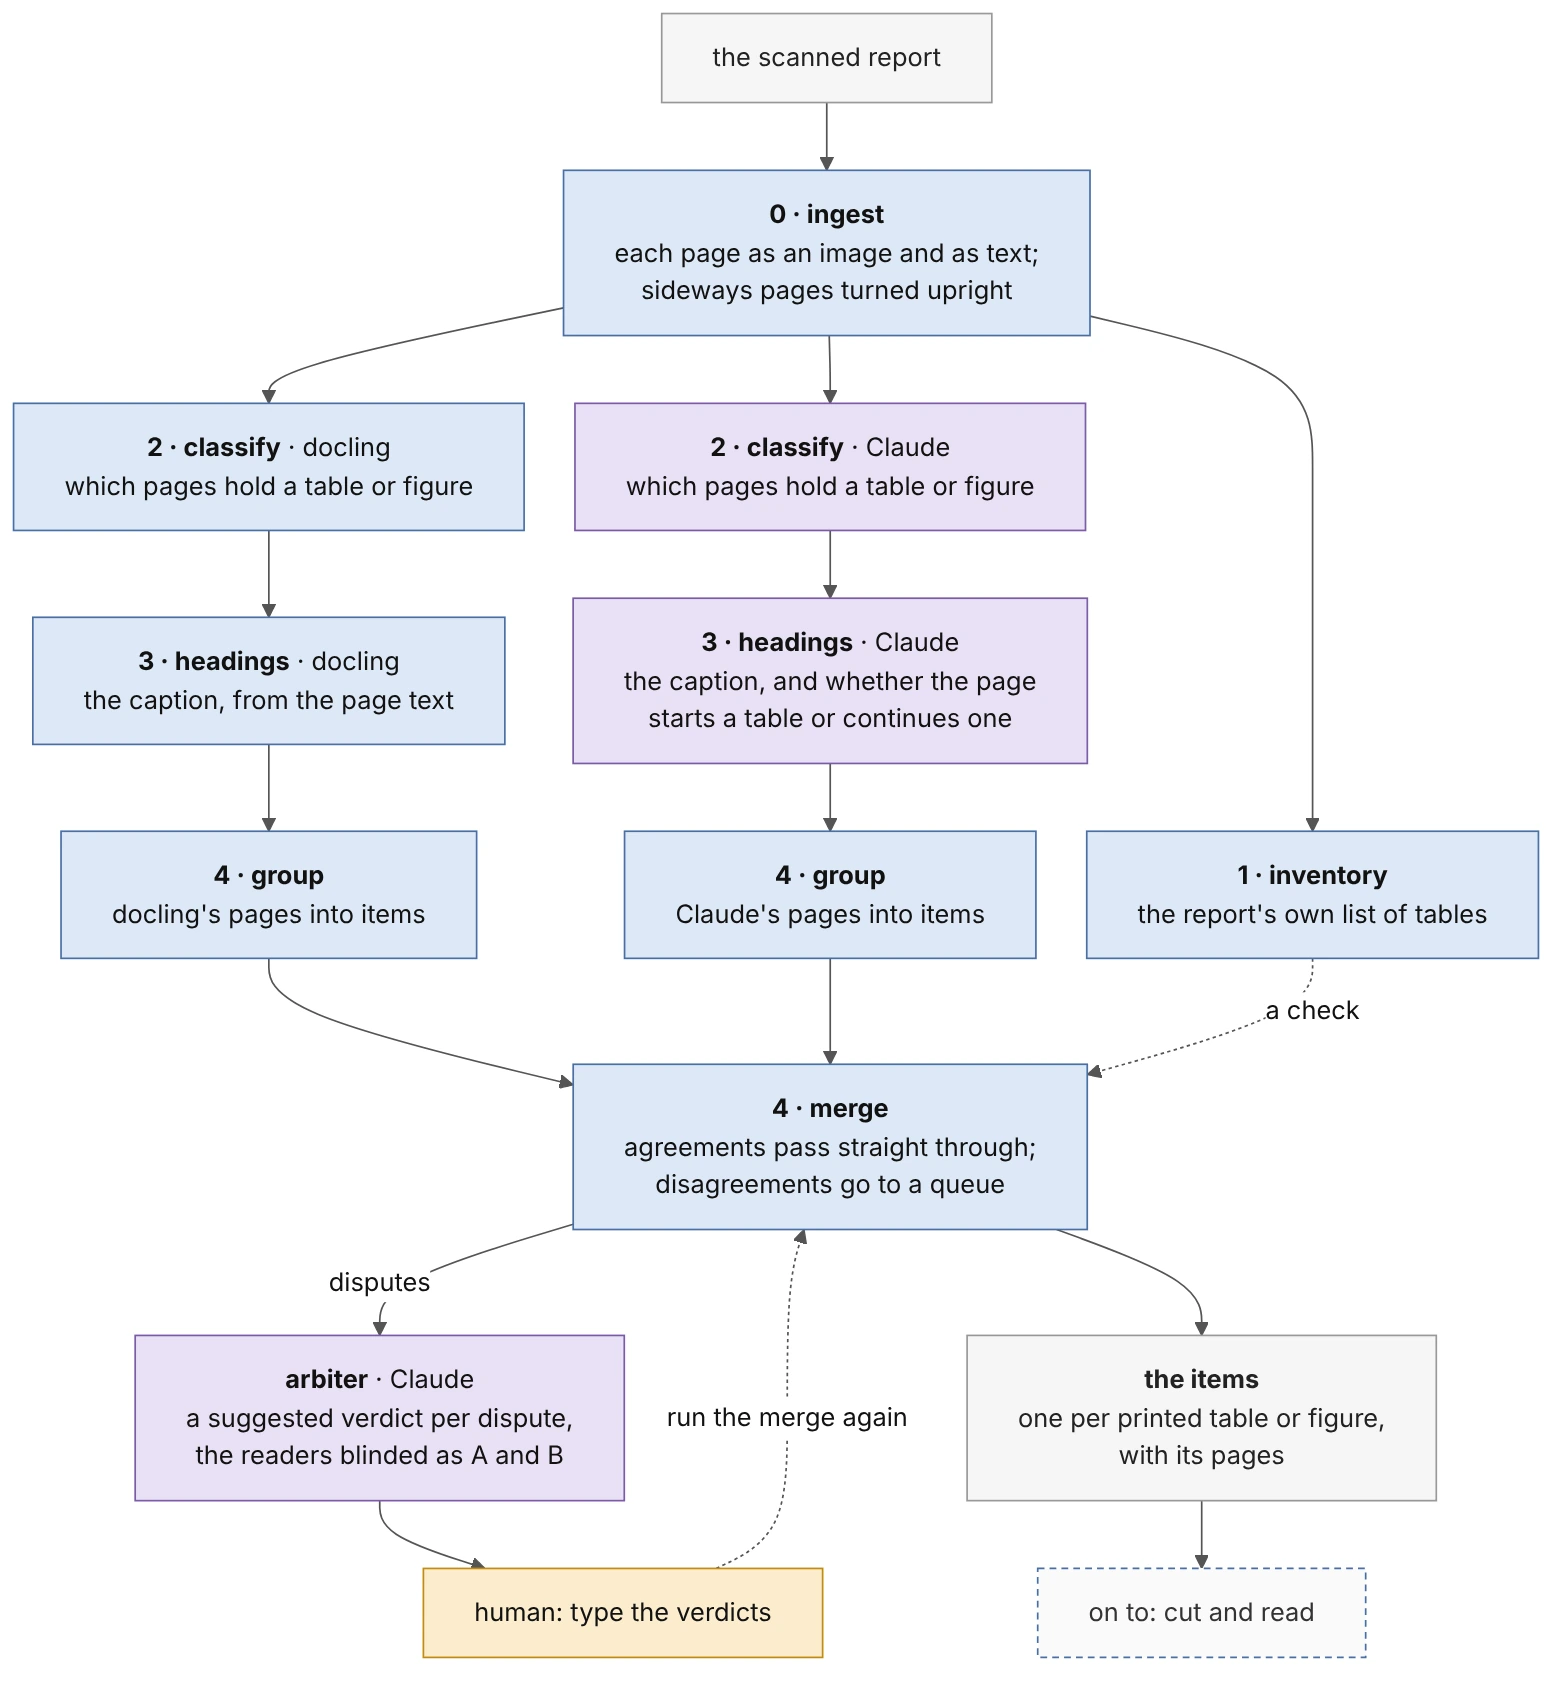
1 · Find the tablesWhich pages hold a table or figure, and which pages belong together.
Flowchart: each scanned report is ingested, then docling and Claude separately classify pages, read headings and group pages into items; a merge passes agreements through and sends disputes to a Claude arbiter and then a human.
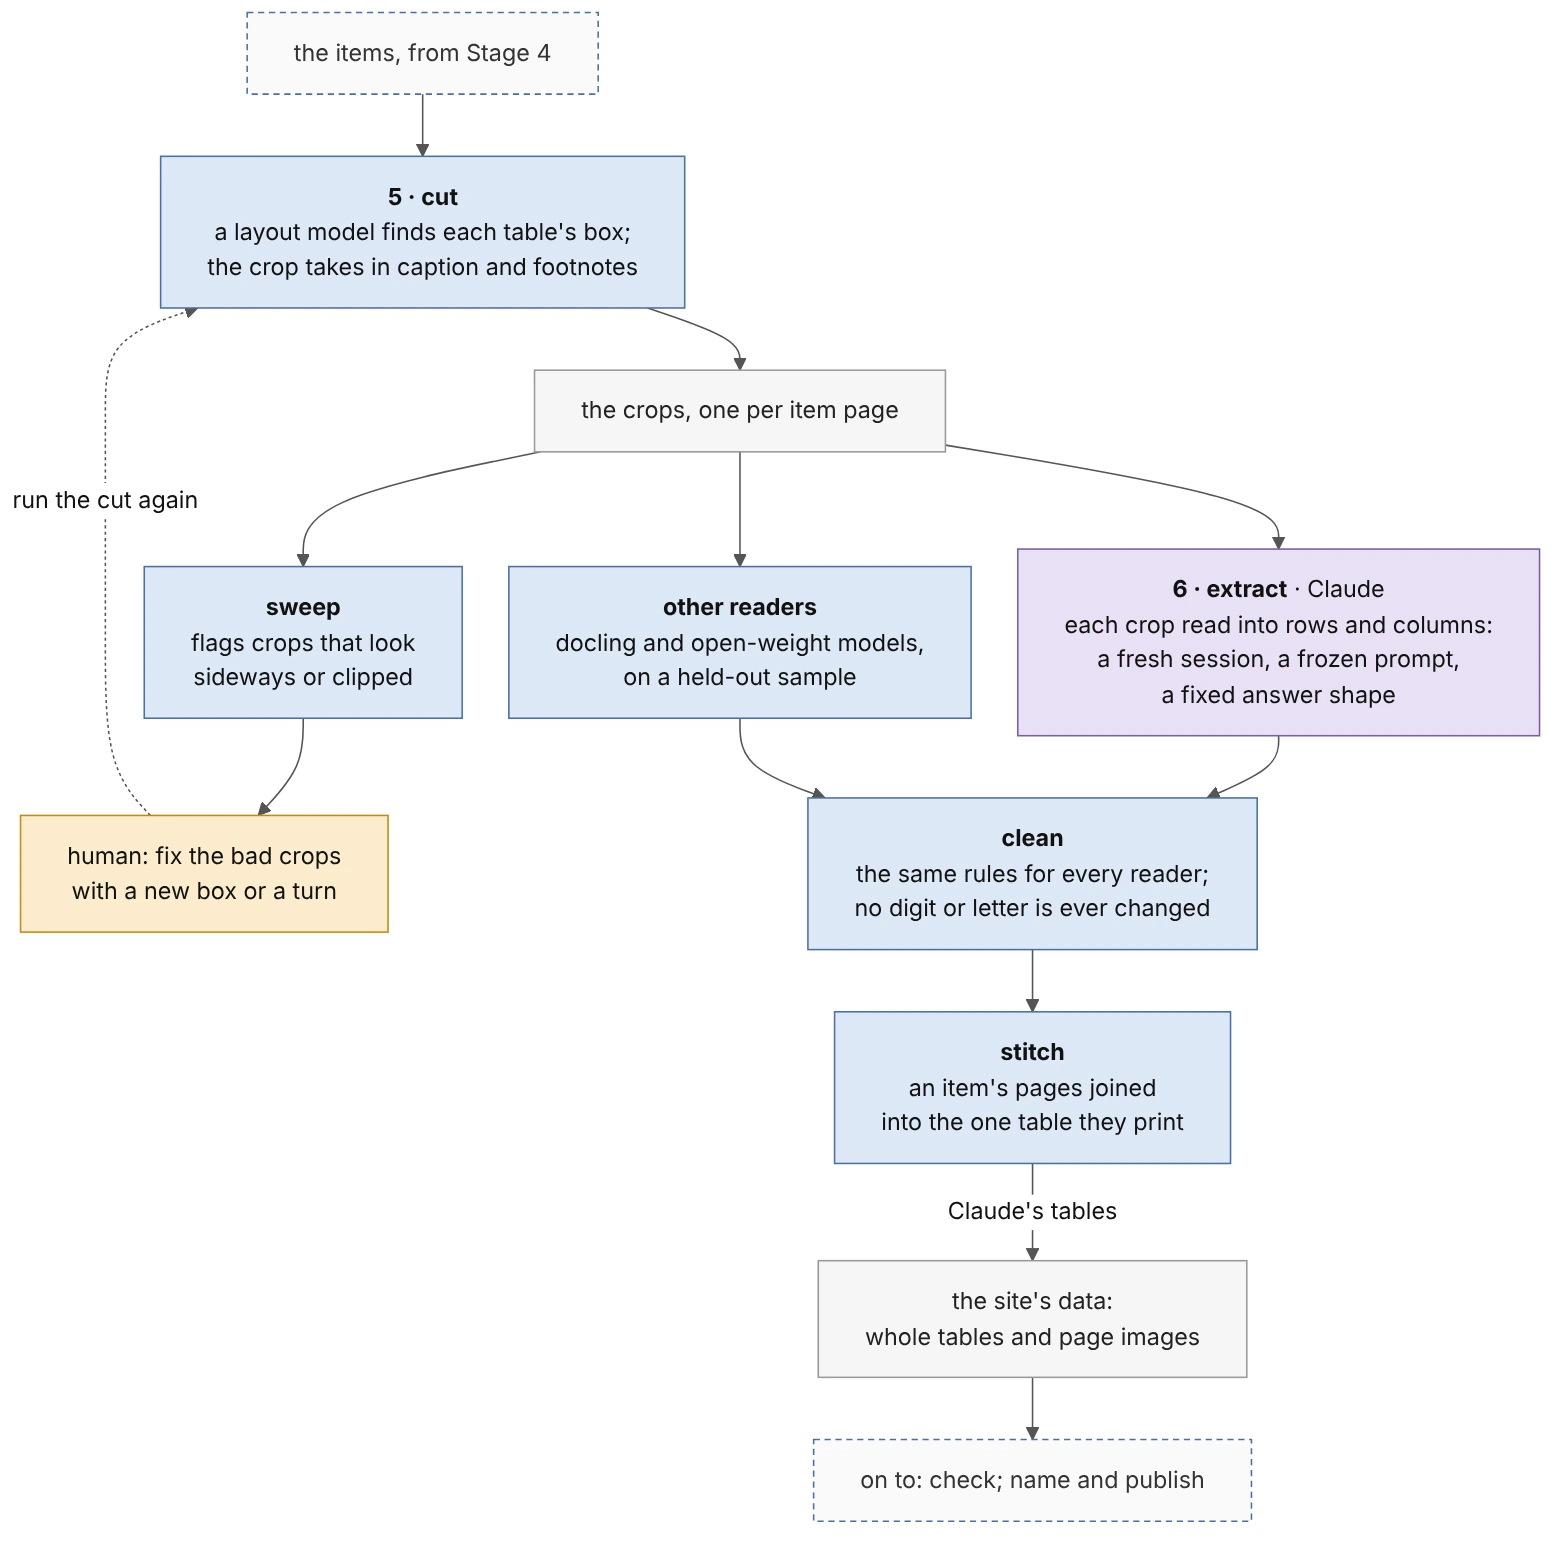
2 · Cut and readCrop each table from its pages, then read it into rows and columns.
Flowchart: a layout model crops each table from its pages and a sweep flags bad crops for a person to fix; Claude, and on a held-out sample docling and open-weight models, read each crop into rows and columns, which are cleaned and stitched into whole tables.
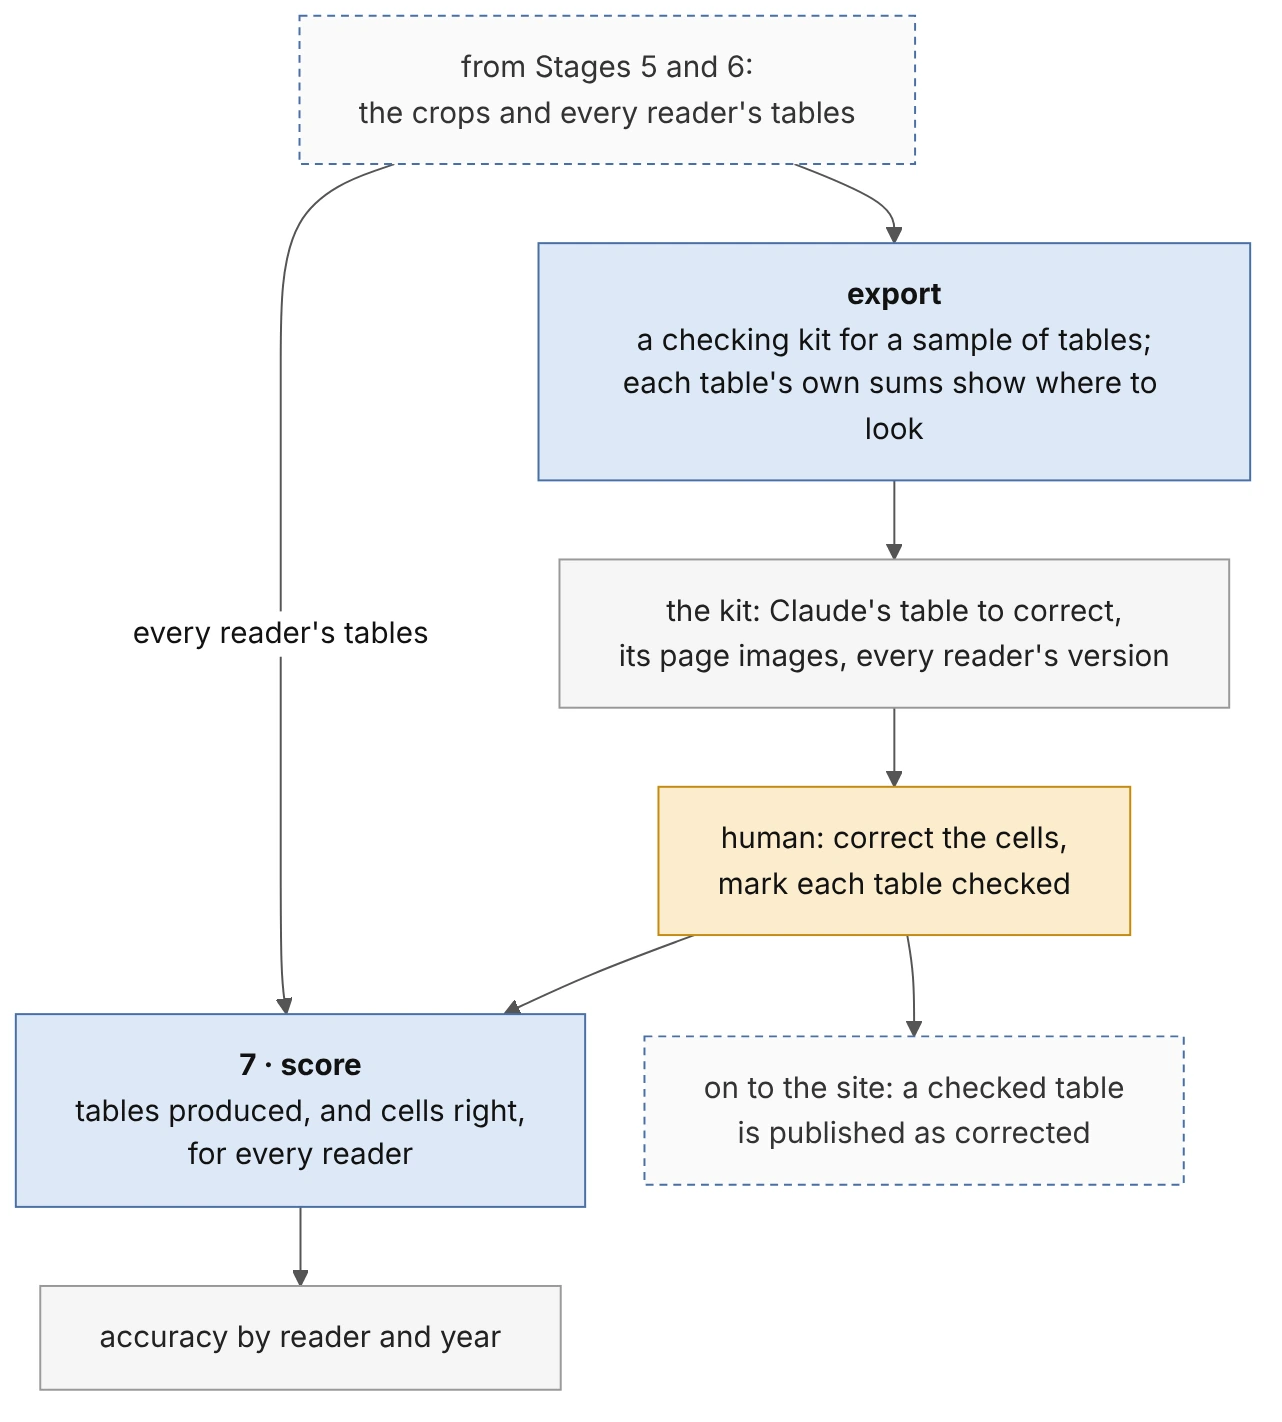
3 · CheckCorrect a sample of tables by hand, and score each reader against them.
Flowchart: a checking kit is exported for a sample of tables, a person corrects the cells, and every reader is scored on tables produced and cells right; checked tables are published as corrected.
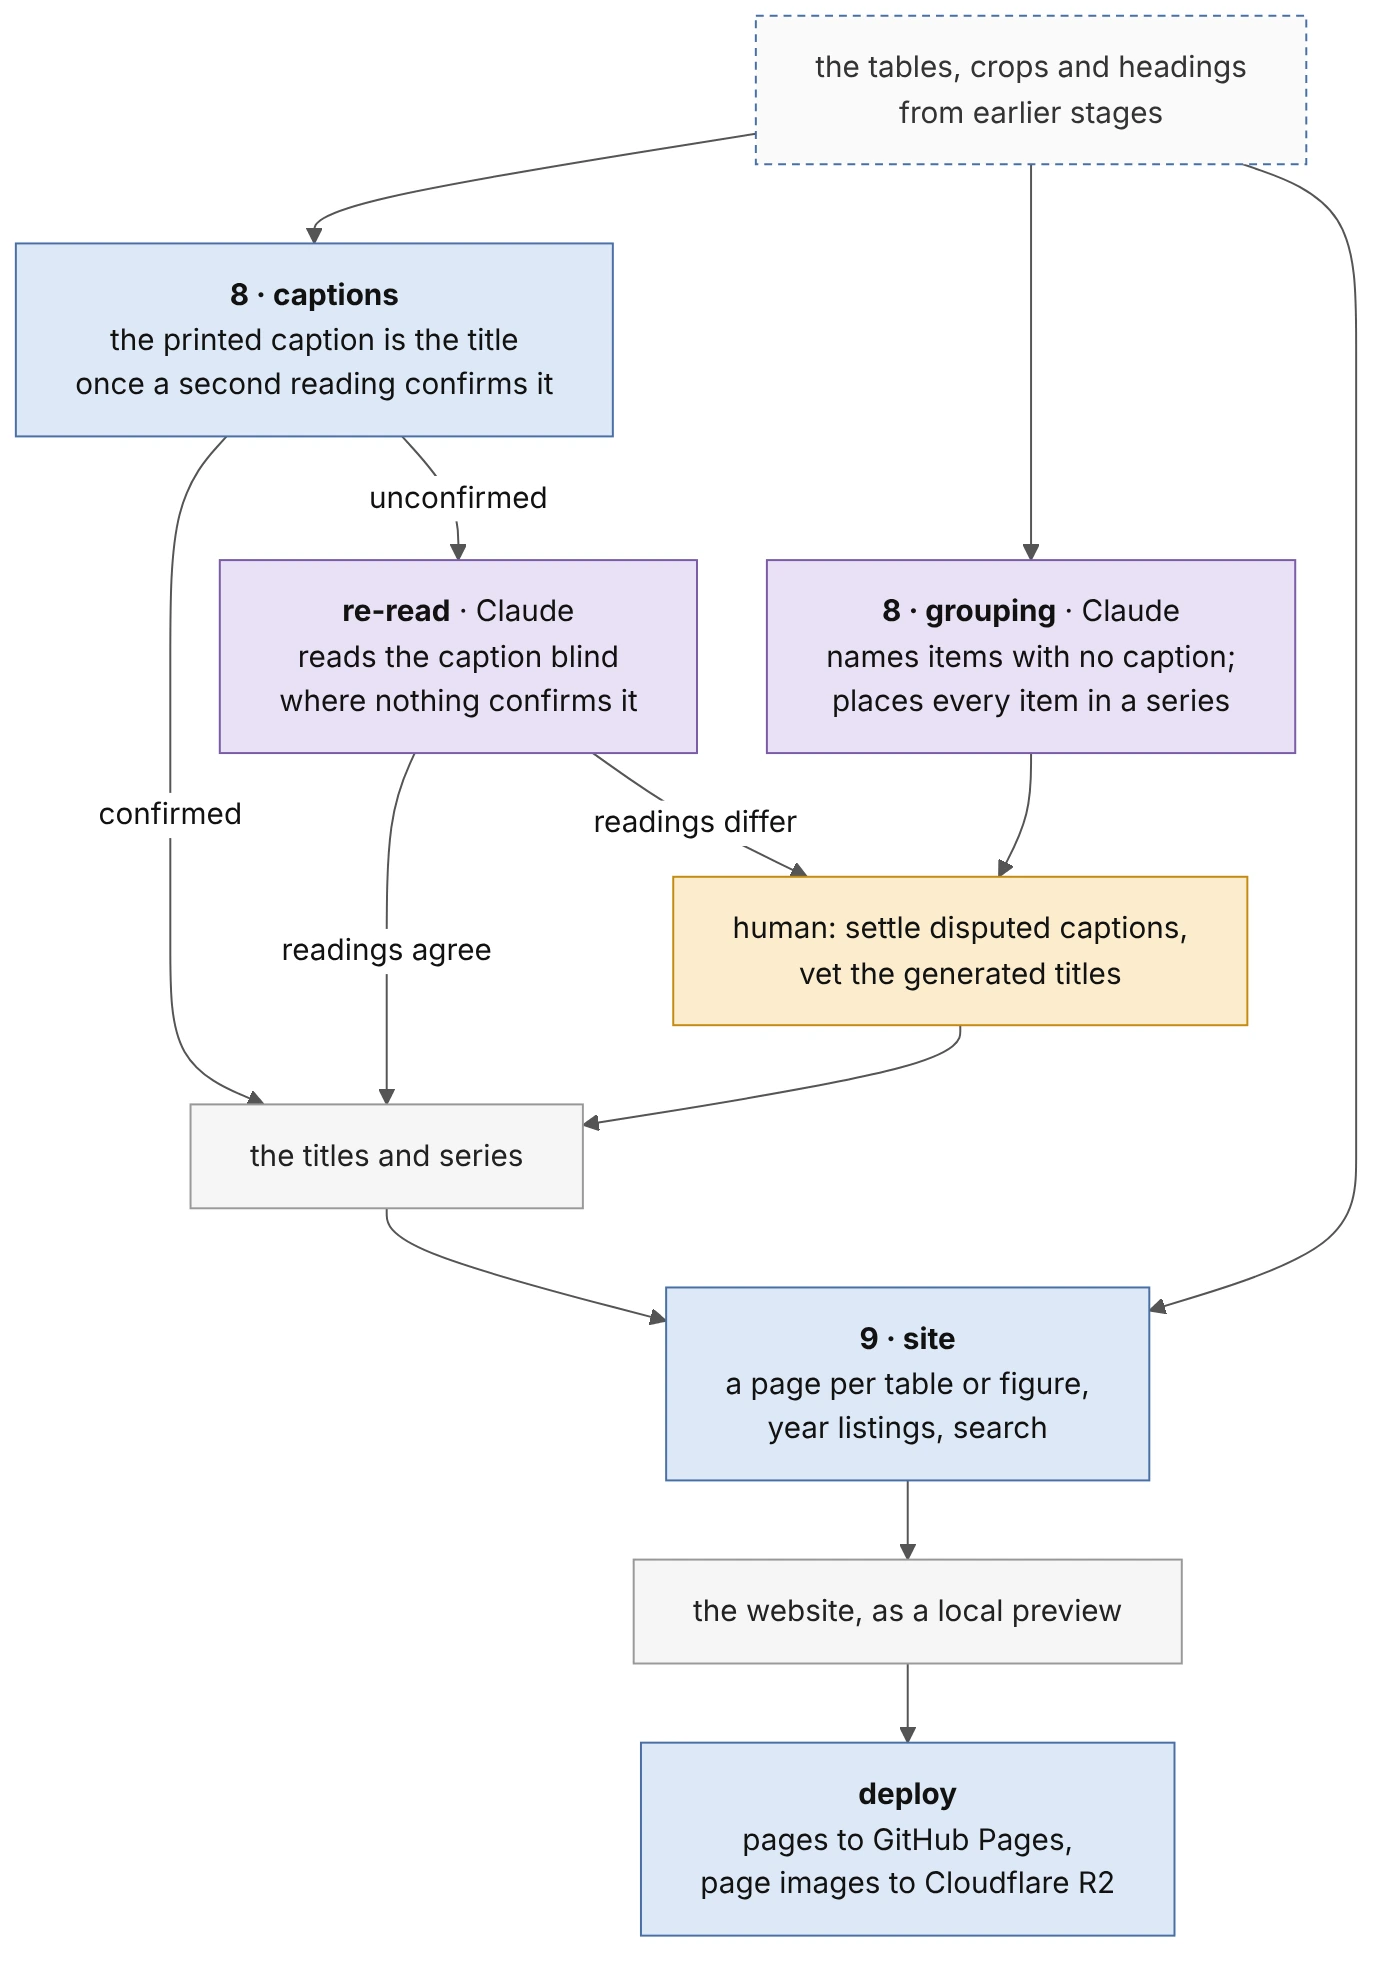
4 · Name and publishGive every table and figure a title, then build the site.
Flowchart: confirmed printed captions become titles, Claude re-reads unconfirmed captions and names uncaptioned items, a human settles disputes, and the site is built from the tables and titles, then deployed to GitHub Pages with page images on Cloudflare R2.

NLRB Stats Archive · diagrams from Rebuilding the NLRB Stats Archive · nlrb.andrewjoung.com