NLRB Stats Archive › Annual Reports › FY2009 › Proceedings Decided by Circuit Courts of Appeals on Petitions for Enforcement and/or Review of Board Orders, Fiscal Year 2009, Compared With 5-Year Cumulative Totals, 2004 Through 2009
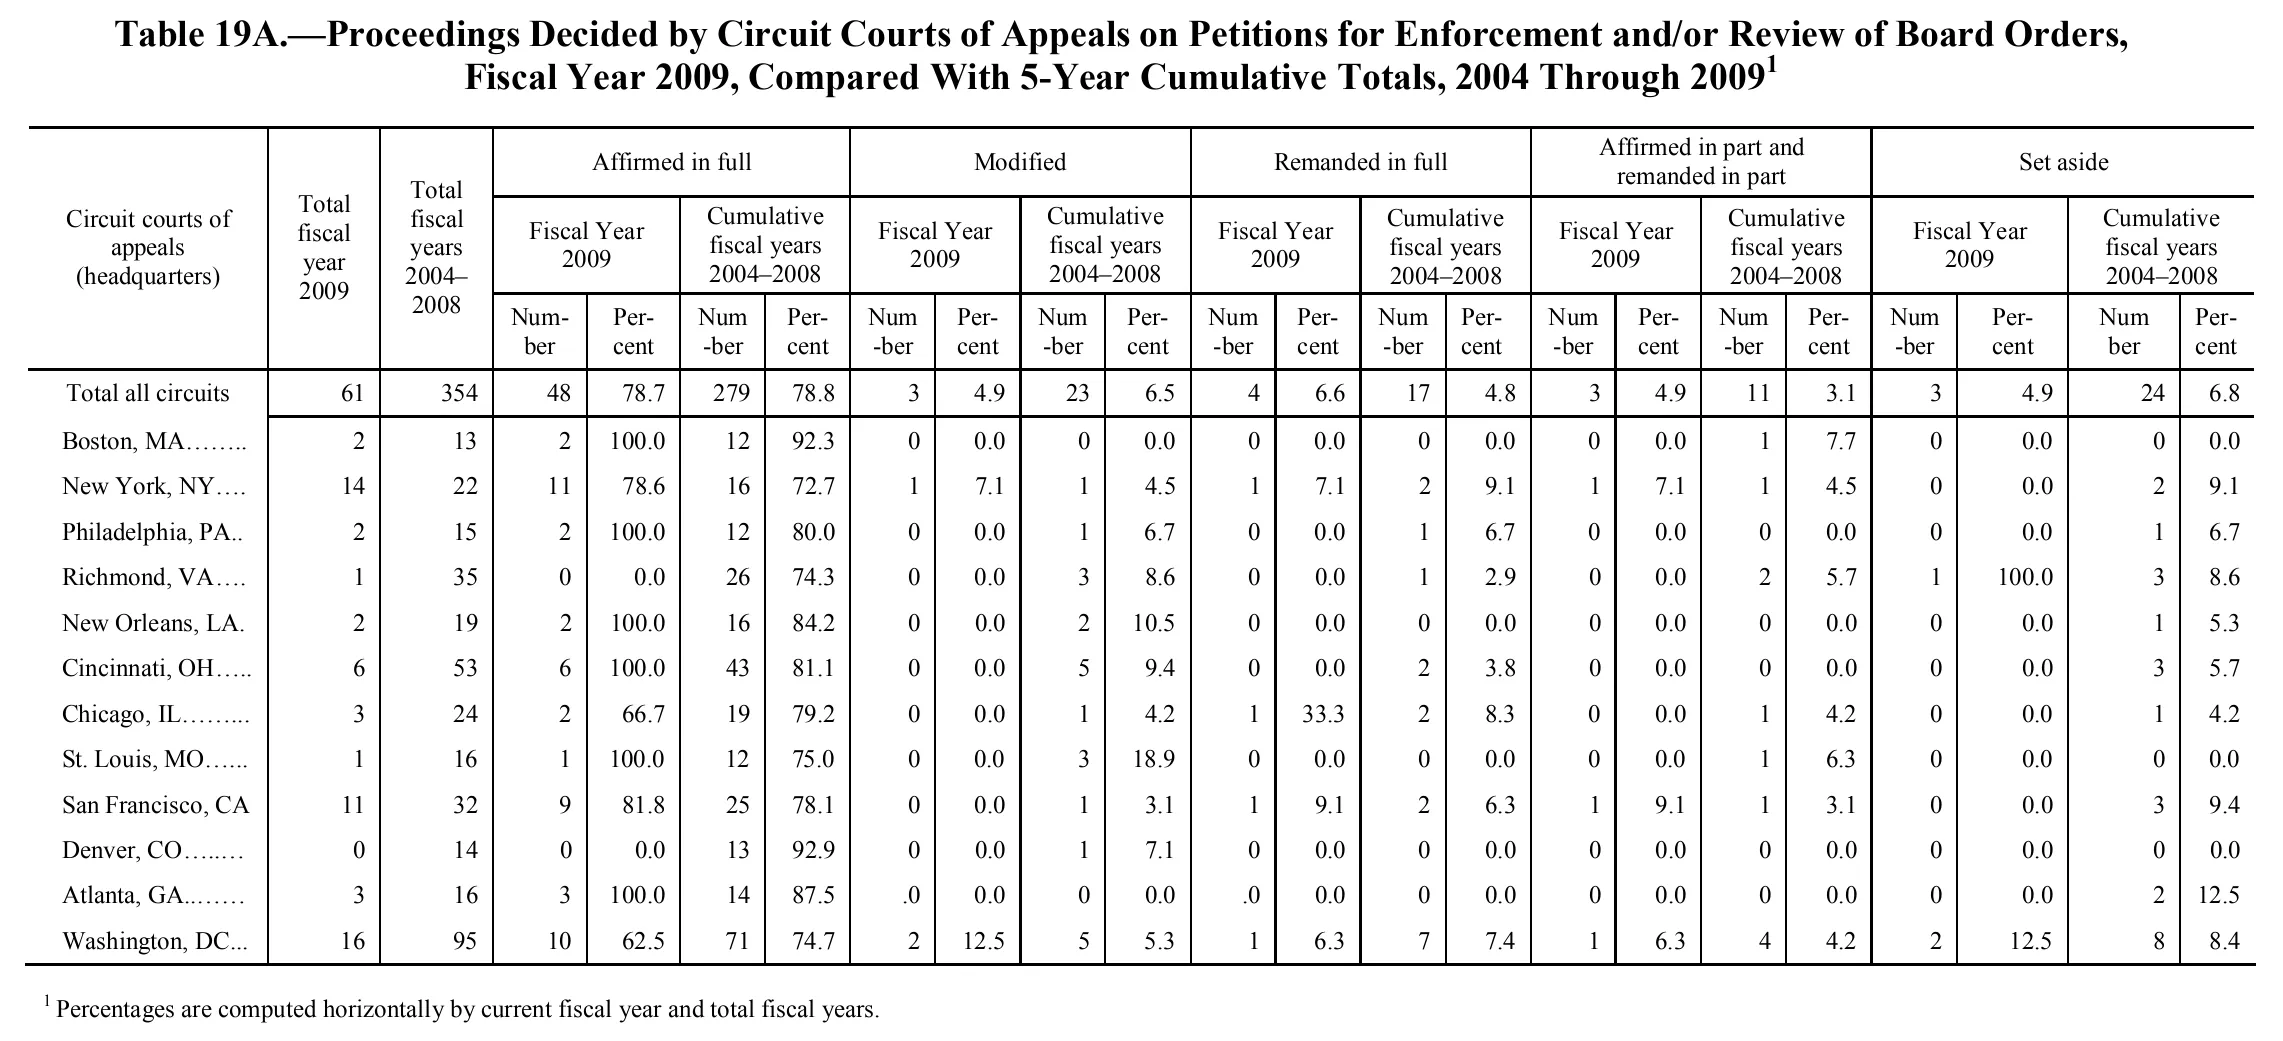
Proceedings Decided by Circuit Courts of Appeals on Petitions for Enforcement and/or Review of Board Orders, Fiscal Year 2009, Compared With 5-Year Cumulative Totals, 2004 Through 2009
| Circuit courts of appeals (headquarters) | Total fiscal year 2009 | Total fiscal years 2004–2008 | Affirmed in full | Modified | Remanded in full | Affirmed in part and remanded in part | Set aside | |||||||||||||||
|---|---|---|---|---|---|---|---|---|---|---|---|---|---|---|---|---|---|---|---|---|---|---|
| Circuit courts of appeals (headquarters) | Total fiscal year 2009 | Total fiscal years 2004–2008 | Fiscal Year 2009 | Cumulative fiscal years 2004–2008 | Fiscal Year 2009 | Cumulative fiscal years 2004–2008 | Fiscal Year 2009 | Cumulative fiscal years 2004–2008 | Fiscal Year 2009 | Cumulative fiscal years 2004–2008 | Fiscal Year 2009 | Cumulative fiscal years 2004–2008 | ||||||||||
| Circuit courts of appeals (headquarters) | Total fiscal year 2009 | Total fiscal years 2004–2008 | Number | Percent | Number | Percent | Number | Percent | Number | Percent | Number | Percent | Number | Percent | Number | Percent | Number | Percent | Number | Percent | Number | Percent |
| Total all circuits | 61 | 354 | 48 | 78.7 | 279 | 78.8 | 3 | 4.9 | 23 | 6.5 | 4 | 6.6 | 17 | 4.8 | 3 | 4.9 | 11 | 3.1 | 3 | 4.9 | 24 | 6.8 |
| Boston, MA | 2 | 13 | 2 | 100.0 | 12 | 92.3 | 0 | 0.0 | 0 | 0.0 | 0 | 0.0 | 0 | 0.0 | 0 | 0.0 | 1 | 7.7 | 0 | 0.0 | 0 | 0.0 |
| New York, NY | 14 | 22 | 11 | 78.6 | 16 | 72.7 | 1 | 7.1 | 1 | 4.5 | 1 | 7.1 | 2 | 9.1 | 1 | 7.1 | 1 | 4.5 | 0 | 0.0 | 2 | 9.1 |
| Philadelphia, PA | 2 | 15 | 2 | 100.0 | 12 | 80.0 | 0 | 0.0 | 1 | 6.7 | 0 | 0.0 | 1 | 6.7 | 0 | 0.0 | 0 | 0.0 | 0 | 0.0 | 1 | 6.7 |
| Richmond, VA | 1 | 35 | 0 | 0.0 | 26 | 74.3 | 0 | 0.0 | 3 | 8.6 | 0 | 0.0 | 1 | 2.9 | 0 | 0.0 | 2 | 5.7 | 1 | 100.0 | 3 | 8.6 |
| New Orleans, LA | 2 | 19 | 2 | 100.0 | 16 | 84.2 | 0 | 0.0 | 2 | 10.5 | 0 | 0.0 | 0 | 0.0 | 0 | 0.0 | 0 | 0.0 | 0 | 0.0 | 1 | 5.3 |
| Cincinnati, OH | 6 | 53 | 6 | 100.0 | 43 | 81.1 | 0 | 0.0 | 5 | 9.4 | 0 | 0.0 | 2 | 3.8 | 0 | 0.0 | 0 | 0.0 | 0 | 0.0 | 3 | 5.7 |
| Chicago, IL | 3 | 24 | 2 | 66.7 | 19 | 79.2 | 0 | 0.0 | 1 | 4.2 | 1 | 33.3 | 2 | 8.3 | 0 | 0.0 | 1 | 4.2 | 0 | 0.0 | 1 | 4.2 |
| St. Louis, MO | 1 | 16 | 1 | 100.0 | 12 | 75.0 | 0 | 0.0 | 3 | 18.9 | 0 | 0.0 | 0 | 0.0 | 0 | 0.0 | 1 | 6.3 | 0 | 0.0 | 0 | 0.0 |
| San Francisco, CA | 11 | 32 | 9 | 81.8 | 25 | 78.1 | 0 | 0.0 | 1 | 3.1 | 1 | 9.1 | 2 | 6.3 | 1 | 9.1 | 1 | 3.1 | 0 | 0.0 | 3 | 9.4 |
| Denver, CO | 0 | 14 | 0 | 0.0 | 13 | 92.9 | 0 | 0.0 | 1 | 7.1 | 0 | 0.0 | 0 | 0.0 | 0 | 0.0 | 0 | 0.0 | 0 | 0.0 | 0 | 0.0 |
| Atlanta, GA | 3 | 16 | 3 | 100.0 | 14 | 87.5 | .0 | 0.0 | 0 | 0.0 | .0 | 0.0 | 0 | 0.0 | 0 | 0.0 | 0 | 0.0 | 0 | 0.0 | 2 | 12.5 |
| Washington, DC | 16 | 95 | 10 | 62.5 | 71 | 74.7 | 2 | 12.5 | 5 | 5.3 | 1 | 6.3 | 7 | 7.4 | 1 | 6.3 | 4 | 4.2 | 2 | 12.5 | 8 | 8.4 |
- 1 Percentages are computed horizontally by current fiscal year and total fiscal years.
93 of 101 figures sit in a row or column sum that works out.
Reader’s notes
p. 151. Column count is 23: stub, "Total fiscal year 2009", "Total fiscal years 2004-2008", then five outcome blocks ("Affirmed in full", "Modified", "Remanded in full", "Affirmed in part and remanded in part", "Set aside"), each split into Fiscal Year 2009 (Number, Percent) and Cumulative fiscal years 2004-2008 (Number, Percent). Header "Num-ber"/"Per-cent" are end-of-line hyphenations, joined to "Number"/"Percent". Row "Atlanta, GA": two Number cells are printed as ".0" rather than "0" - the "Modified / Fiscal Year 2009 / Number" cell and the "Remanded in full / Fiscal Year 2009 / Number" cell. Transcribed as printed. Both are almost certainly misprints for 0 (the adjacent percents are 0.0, and Atlanta's FY2009 total of 3 is fully accounted for by the 3 affirmed in full). The source page is a born-digital/vector print rather than a bitmap scan, so these look like typesetting errors in the original rather than scanning specks, but a reader should treat them as 0. Possible arithmetic misprint, transcribed as printed: row "St. Louis, MO", column "Modified / Cumulative fiscal years 2004-2008 / Percent" reads 18.9, whereas 3 of 16 is 18.75, which would round to 18.8. Nothing was corrected. The table caption carries footnote marker 1 on "2009", which is the footnote printed below the table; the caption itself is omitted per instructions. No part of the table appears cut off by the crop; the body ends with the Washington, DC row and the single footnote line.
Source image
Source data: U.S. NLRB Annual Reports (public domain). Reconstruction by NLRB Stats Archive. Read by claude-opus-5 (effort max, prompt extract_v1) from the 300-dpi scan; stitched by page. Updated October 2026.