NLRB Stats Archive › Annual Reports › FY2009 › Distribution of Unfair Labor Practice Situations Received, by Number of Employees in Establishments, Fiscal Year 2009
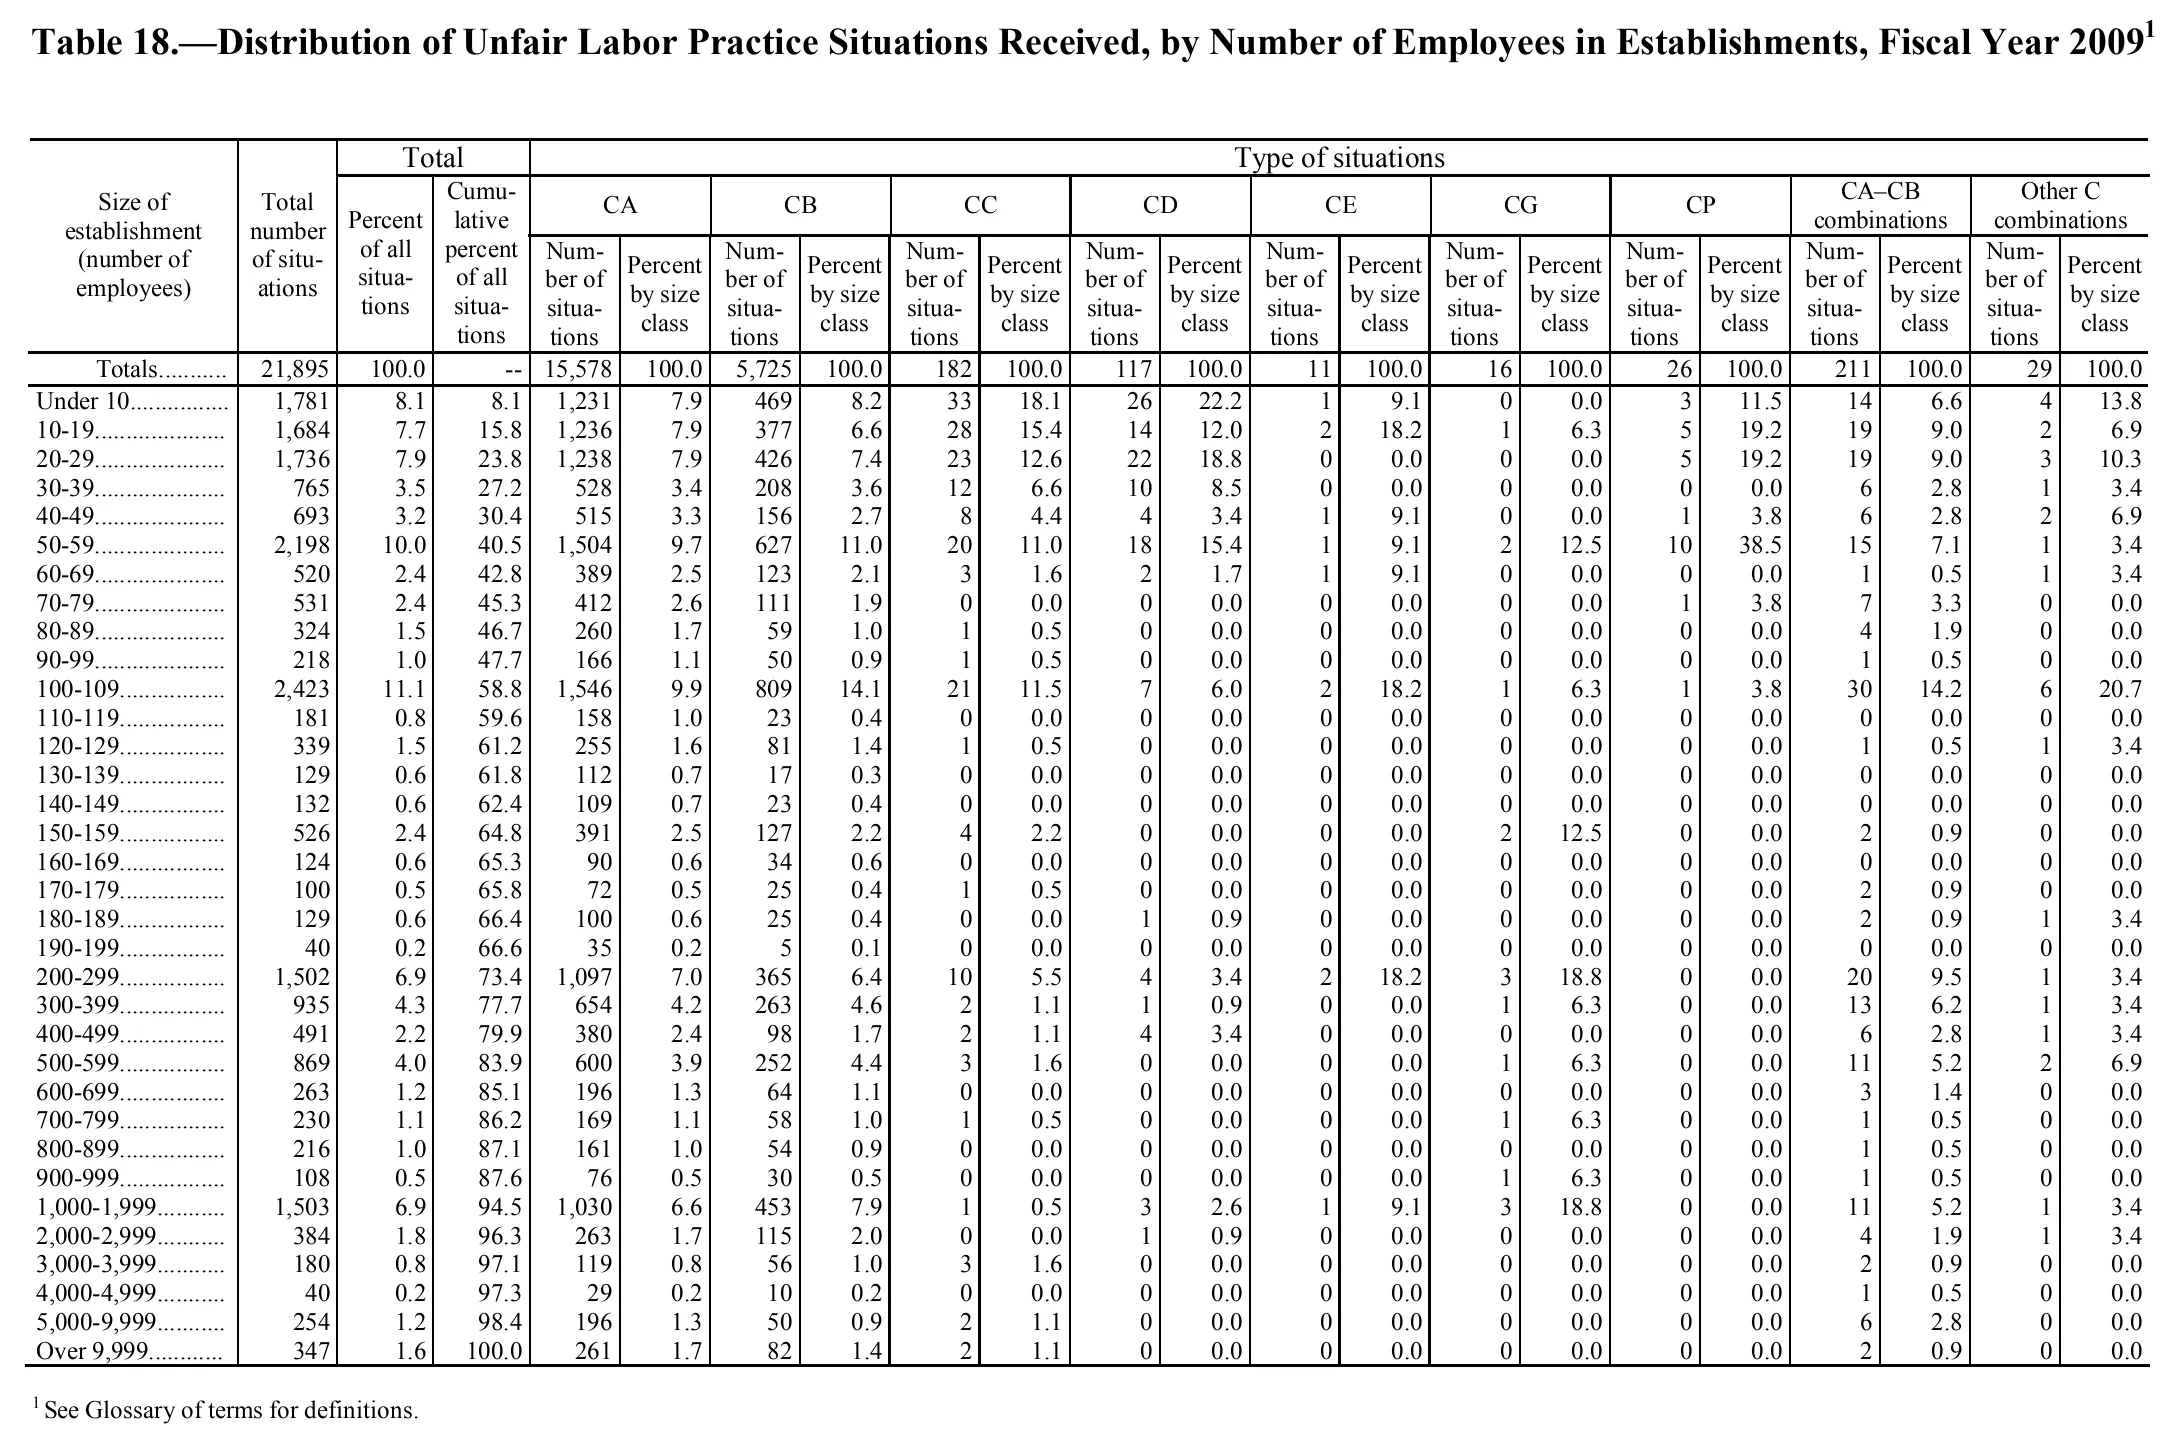
Distribution of Unfair Labor Practice Situations Received, by Number of Employees in Establishments, Fiscal Year 2009
| Size of establishment (number of employees) | Total number of situations | Total | Type of situations | ||||||||||||||||||
|---|---|---|---|---|---|---|---|---|---|---|---|---|---|---|---|---|---|---|---|---|---|
| Size of establishment (number of employees) | Total number of situations | Percent of all situations | Cumulative percent of all situations | CA | CB | CC | CD | CE | CG | CP | CA–CB combinations | Other C combinations | |||||||||
| Size of establishment (number of employees) | Total number of situations | Percent of all situations | Cumulative percent of all situations | Number of situations | Percent by size class | Number of situations | Percent by size class | Number of situations | Percent by size class | Number of situations | Percent by size class | Number of situations | Percent by size class | Number of situations | Percent by size class | Number of situations | Percent by size class | Number of situations | Percent by size class | Number of situations | Percent by size class |
| Totals | 21,895 | 100.0 | 15,578 | 100.0 | 5,725 | 100.0 | 182 | 100.0 | 117 | 100.0 | 11 | 100.0 | 16 | 100.0 | 26 | 100.0 | 211 | 100.0 | 29 | 100.0 | |
| Under 10 | 1,781 | 8.1 | 8.1 | 1,231 | 7.9 | 469 | 8.2 | 33 | 18.1 | 26 | 22.2 | 1 | 9.1 | 0 | 0.0 | 3 | 11.5 | 14 | 6.6 | 4 | 13.8 |
| 10-19 | 1,684 | 7.7 | 15.8 | 1,236 | 7.9 | 377 | 6.6 | 28 | 15.4 | 14 | 12.0 | 2 | 18.2 | 1 | 6.3 | 5 | 19.2 | 19 | 9.0 | 2 | 6.9 |
| 20-29 | 1,736 | 7.9 | 23.8 | 1,238 | 7.9 | 426 | 7.4 | 23 | 12.6 | 22 | 18.8 | 0 | 0.0 | 0 | 0.0 | 5 | 19.2 | 19 | 9.0 | 3 | 10.3 |
| 30-39 | 765 | 3.5 | 27.2 | 528 | 3.4 | 208 | 3.6 | 12 | 6.6 | 10 | 8.5 | 0 | 0.0 | 0 | 0.0 | 0 | 0.0 | 6 | 2.8 | 1 | 3.4 |
| 40-49 | 693 | 3.2 | 30.4 | 515 | 3.3 | 156 | 2.7 | 8 | 4.4 | 4 | 3.4 | 1 | 9.1 | 0 | 0.0 | 1 | 3.8 | 6 | 2.8 | 2 | 6.9 |
| 50-59 | 2,198 | 10.0 | 40.5 | 1,504 | 9.7 | 627 | 11.0 | 20 | 11.0 | 18 | 15.4 | 1 | 9.1 | 2 | 12.5 | 10 | 38.5 | 15 | 7.1 | 1 | 3.4 |
| 60-69 | 520 | 2.4 | 42.8 | 389 | 2.5 | 123 | 2.1 | 3 | 1.6 | 2 | 1.7 | 1 | 9.1 | 0 | 0.0 | 0 | 0.0 | 1 | 0.5 | 1 | 3.4 |
| 70-79 | 531 | 2.4 | 45.3 | 412 | 2.6 | 111 | 1.9 | 0 | 0.0 | 0 | 0.0 | 0 | 0.0 | 0 | 0.0 | 1 | 3.8 | 7 | 3.3 | 0 | 0.0 |
| 80-89 | 324 | 1.5 | 46.7 | 260 | 1.7 | 59 | 1.0 | 1 | 0.5 | 0 | 0.0 | 0 | 0.0 | 0 | 0.0 | 0 | 0.0 | 4 | 1.9 | 0 | 0.0 |
| 90-99 | 218 | 1.0 | 47.7 | 166 | 1.1 | 50 | 0.9 | 1 | 0.5 | 0 | 0.0 | 0 | 0.0 | 0 | 0.0 | 0 | 0.0 | 1 | 0.5 | 0 | 0.0 |
| 100-109 | 2,423 | 11.1 | 58.8 | 1,546 | 9.9 | 809 | 14.1 | 21 | 11.5 | 7 | 6.0 | 2 | 18.2 | 1 | 6.3 | 1 | 3.8 | 30 | 14.2 | 6 | 20.7 |
| 110-119 | 181 | 0.8 | 59.6 | 158 | 1.0 | 23 | 0.4 | 0 | 0.0 | 0 | 0.0 | 0 | 0.0 | 0 | 0.0 | 0 | 0.0 | 0 | 0.0 | 0 | 0.0 |
| 120-129 | 339 | 1.5 | 61.2 | 255 | 1.6 | 81 | 1.4 | 1 | 0.5 | 0 | 0.0 | 0 | 0.0 | 0 | 0.0 | 0 | 0.0 | 1 | 0.5 | 1 | 3.4 |
| 130-139 | 129 | 0.6 | 61.8 | 112 | 0.7 | 17 | 0.3 | 0 | 0.0 | 0 | 0.0 | 0 | 0.0 | 0 | 0.0 | 0 | 0.0 | 0 | 0.0 | 0 | 0.0 |
| 140-149 | 132 | 0.6 | 62.4 | 109 | 0.7 | 23 | 0.4 | 0 | 0.0 | 0 | 0.0 | 0 | 0.0 | 0 | 0.0 | 0 | 0.0 | 0 | 0.0 | 0 | 0.0 |
| 150-159 | 526 | 2.4 | 64.8 | 391 | 2.5 | 127 | 2.2 | 4 | 2.2 | 0 | 0.0 | 0 | 0.0 | 2 | 12.5 | 0 | 0.0 | 2 | 0.9 | 0 | 0.0 |
| 160-169 | 124 | 0.6 | 65.3 | 90 | 0.6 | 34 | 0.6 | 0 | 0.0 | 0 | 0.0 | 0 | 0.0 | 0 | 0.0 | 0 | 0.0 | 0 | 0.0 | 0 | 0.0 |
| 170-179 | 100 | 0.5 | 65.8 | 72 | 0.5 | 25 | 0.4 | 1 | 0.5 | 0 | 0.0 | 0 | 0.0 | 0 | 0.0 | 0 | 0.0 | 2 | 0.9 | 0 | 0.0 |
| 180-189 | 129 | 0.6 | 66.4 | 100 | 0.6 | 25 | 0.4 | 0 | 0.0 | 1 | 0.9 | 0 | 0.0 | 0 | 0.0 | 0 | 0.0 | 2 | 0.9 | 1 | 3.4 |
| 190-199 | 40 | 0.2 | 66.6 | 35 | 0.2 | 5 | 0.1 | 0 | 0.0 | 0 | 0.0 | 0 | 0.0 | 0 | 0.0 | 0 | 0.0 | 0 | 0.0 | 0 | 0.0 |
| 200-299 | 1,502 | 6.9 | 73.4 | 1,097 | 7.0 | 365 | 6.4 | 10 | 5.5 | 4 | 3.4 | 2 | 18.2 | 3 | 18.8 | 0 | 0.0 | 20 | 9.5 | 1 | 3.4 |
| 300-399 | 935 | 4.3 | 77.7 | 654 | 4.2 | 263 | 4.6 | 2 | 1.1 | 1 | 0.9 | 0 | 0.0 | 1 | 6.3 | 0 | 0.0 | 13 | 6.2 | 1 | 3.4 |
| 400-499 | 491 | 2.2 | 79.9 | 380 | 2.4 | 98 | 1.7 | 2 | 1.1 | 4 | 3.4 | 0 | 0.0 | 0 | 0.0 | 0 | 0.0 | 6 | 2.8 | 1 | 3.4 |
| 500-599 | 869 | 4.0 | 83.9 | 600 | 3.9 | 252 | 4.4 | 3 | 1.6 | 0 | 0.0 | 0 | 0.0 | 1 | 6.3 | 0 | 0.0 | 11 | 5.2 | 2 | 6.9 |
| 600-699 | 263 | 1.2 | 85.1 | 196 | 1.3 | 64 | 1.1 | 0 | 0.0 | 0 | 0.0 | 0 | 0.0 | 0 | 0.0 | 0 | 0.0 | 3 | 1.4 | 0 | 0.0 |
| 700-799 | 230 | 1.1 | 86.2 | 169 | 1.1 | 58 | 1.0 | 1 | 0.5 | 0 | 0.0 | 0 | 0.0 | 1 | 6.3 | 0 | 0.0 | 1 | 0.5 | 0 | 0.0 |
| 800-899 | 216 | 1.0 | 87.1 | 161 | 1.0 | 54 | 0.9 | 0 | 0.0 | 0 | 0.0 | 0 | 0.0 | 0 | 0.0 | 0 | 0.0 | 1 | 0.5 | 0 | 0.0 |
| 900-999 | 108 | 0.5 | 87.6 | 76 | 0.5 | 30 | 0.5 | 0 | 0.0 | 0 | 0.0 | 0 | 0.0 | 1 | 6.3 | 0 | 0.0 | 1 | 0.5 | 0 | 0.0 |
| 1,000-1,999 | 1,503 | 6.9 | 94.5 | 1,030 | 6.6 | 453 | 7.9 | 1 | 0.5 | 3 | 2.6 | 1 | 9.1 | 3 | 18.8 | 0 | 0.0 | 11 | 5.2 | 1 | 3.4 |
| 2,000-2,999 | 384 | 1.8 | 96.3 | 263 | 1.7 | 115 | 2.0 | 0 | 0.0 | 1 | 0.9 | 0 | 0.0 | 0 | 0.0 | 0 | 0.0 | 4 | 1.9 | 1 | 3.4 |
| 3,000-3,999 | 180 | 0.8 | 97.1 | 119 | 0.8 | 56 | 1.0 | 3 | 1.6 | 0 | 0.0 | 0 | 0.0 | 0 | 0.0 | 0 | 0.0 | 2 | 0.9 | 0 | 0.0 |
| 4,000-4,999 | 40 | 0.2 | 97.3 | 29 | 0.2 | 10 | 0.2 | 0 | 0.0 | 0 | 0.0 | 0 | 0.0 | 0 | 0.0 | 0 | 0.0 | 1 | 0.5 | 0 | 0.0 |
| 5,000-9,999 | 254 | 1.2 | 98.4 | 196 | 1.3 | 50 | 0.9 | 2 | 1.1 | 0 | 0.0 | 0 | 0.0 | 0 | 0.0 | 0 | 0.0 | 6 | 2.8 | 0 | 0.0 |
| Over 9,999 | 347 | 1.6 | 100.0 | 261 | 1.7 | 82 | 1.4 | 2 | 1.1 | 0 | 0.0 | 0 | 0.0 | 0 | 0.0 | 0 | 0.0 | 2 | 0.9 | 0 | 0.0 |
- 1 See Glossary of terms for definitions.
218 of 218 figures sit in a row or column sum that works out.
Reader’s notes
p. 149. 22 columns: stub, "Total number of situations", two "Total" percent columns, then a Number/Percent pair for each of CA, CB, CC, CD, CE, CG, CP, CA-CB combinations, Other C combinations. The stub heading and "Total number of situations" are tall headings spanning all three header levels; "Percent of all situations" and "Cumulative percent of all situations" span levels 2-3. Totals row, "Cumulative percent of all situations" column: the cell prints a short double dash ("--"), not a figure; transcribed as "" per the dash-rule rule. The footnote marker 1 appears only on the caption ("...Fiscal Year 2009^1"), which is excluded from the grid; no in-table cell carries a marker. All nine type-of-situation column sums, the "Total number of situations" column sum, and spot-checked row sums reconcile exactly with the printed Totals row (e.g. CA 15,578; CB 5,725; CC 182; CD 117; CE 11; CG 16; CP 26; CA-CB 211; Other C 29; grand total 21,895), so no misprints are suspected.
Source image
Source data: U.S. NLRB Annual Reports (public domain). Reconstruction by NLRB Stats Archive. Read by claude-opus-5 (effort max, prompt extract_v1) from the 300-dpi scan; stitched by page. Updated October 2026.