NLRB Stats Archive › Annual Reports › FY2009 › Geographic Distribution of Decertification Elections Held in Cases Closed, Fiscal Year 2009
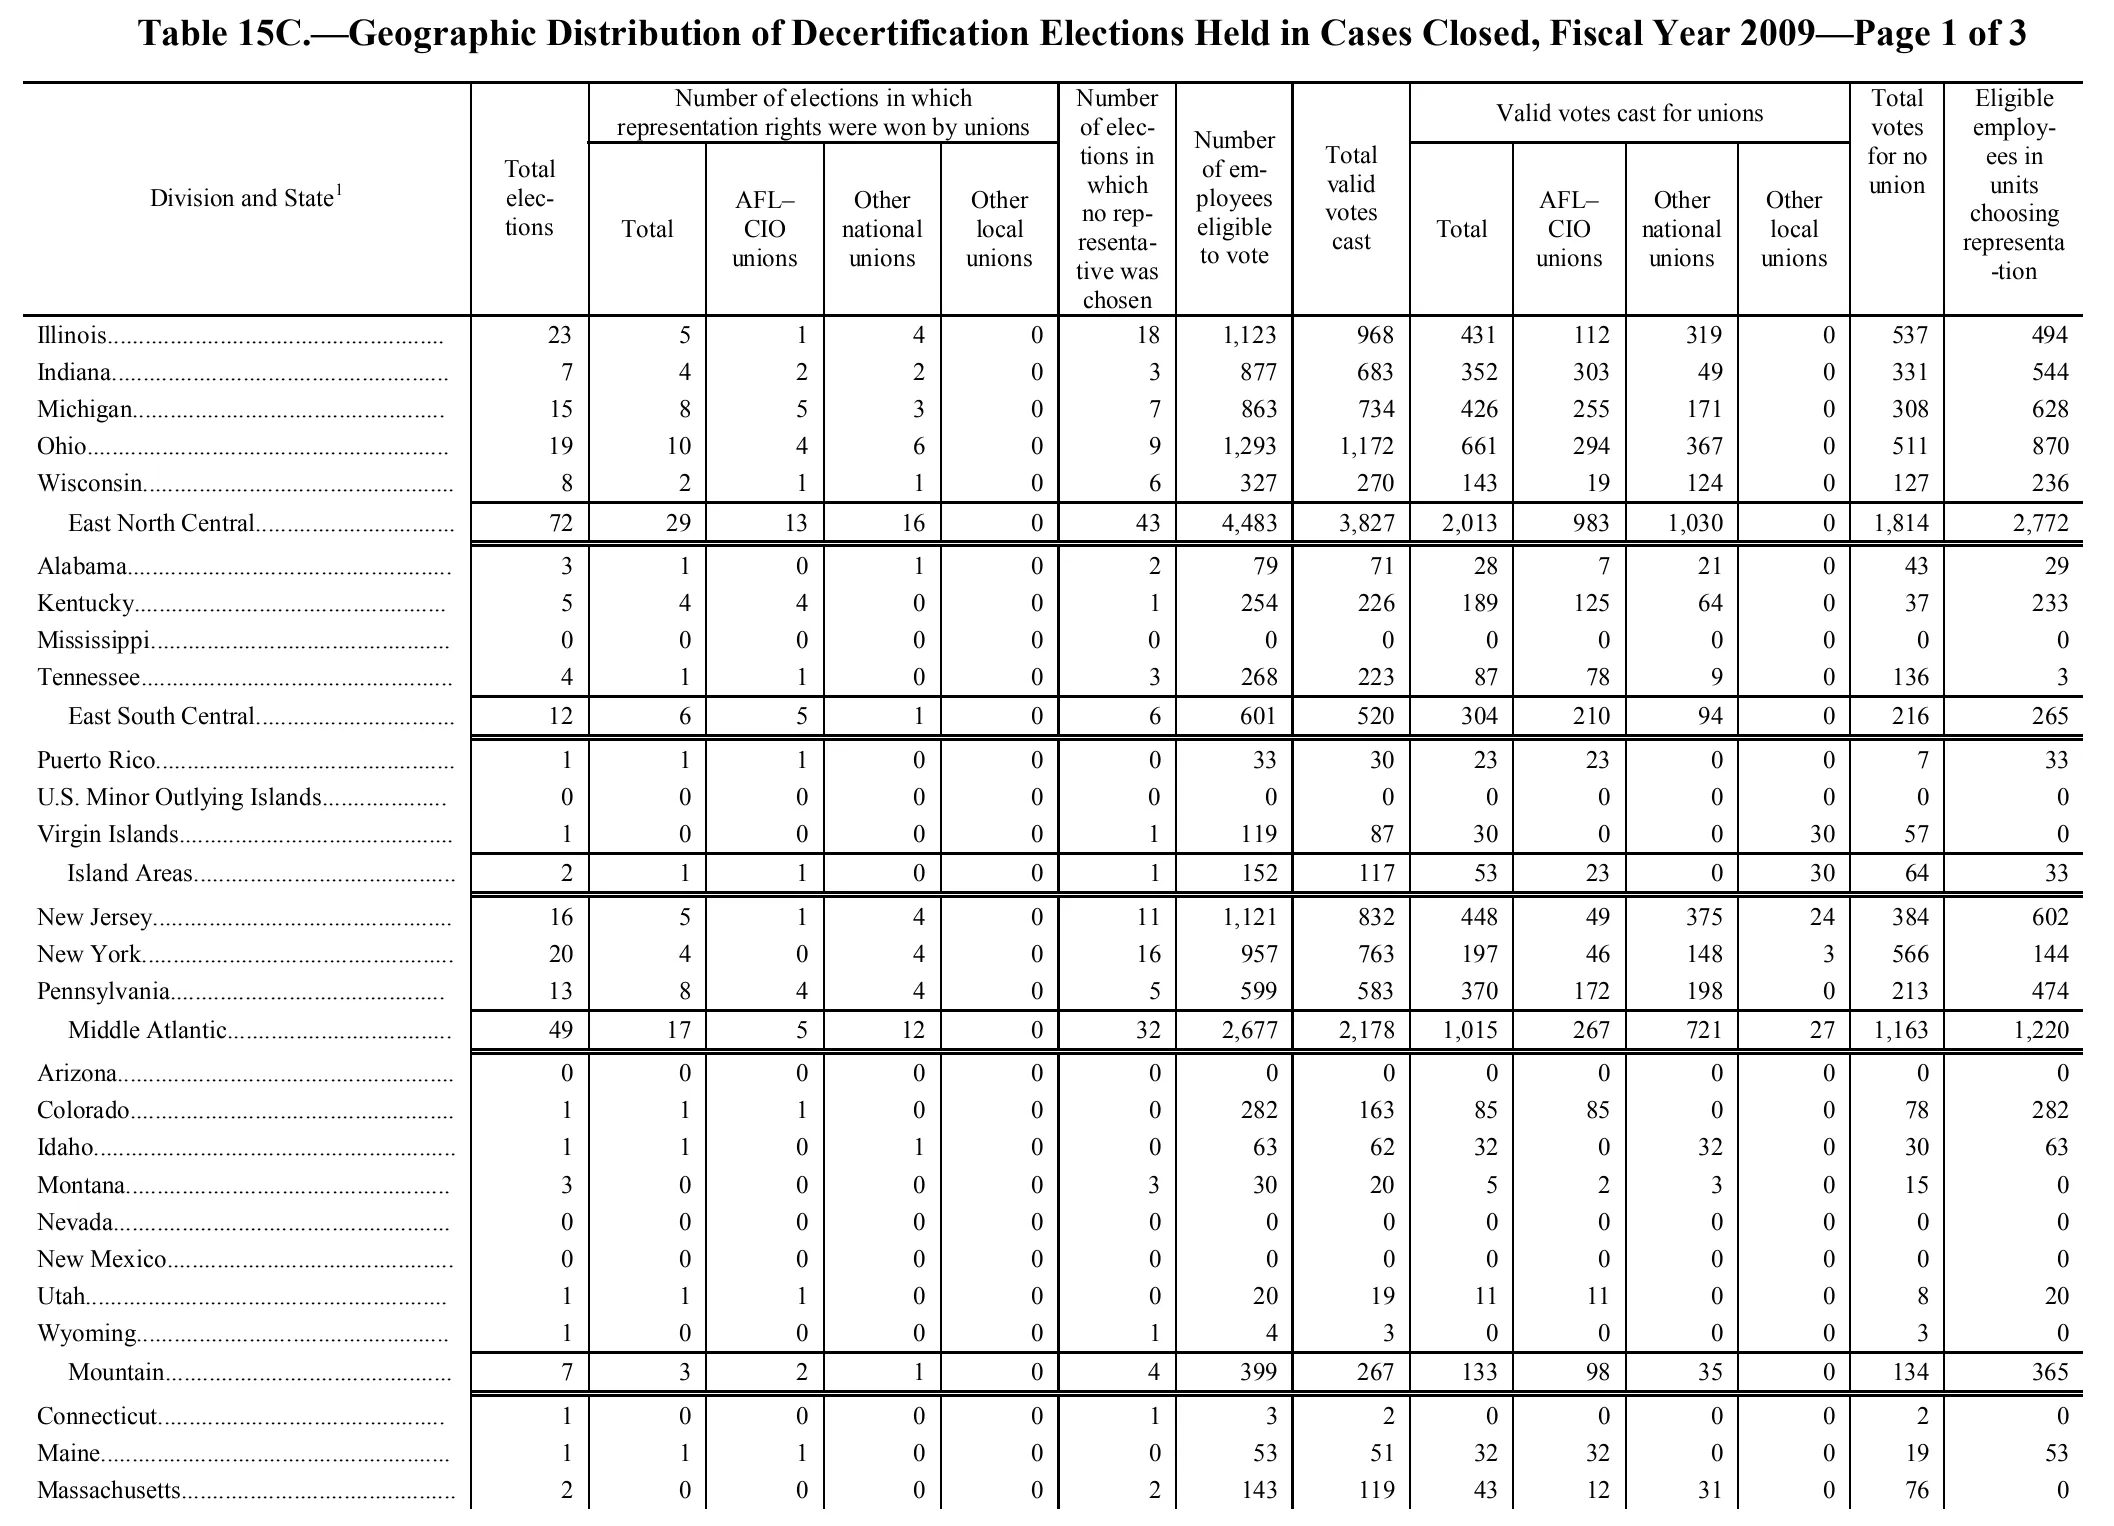
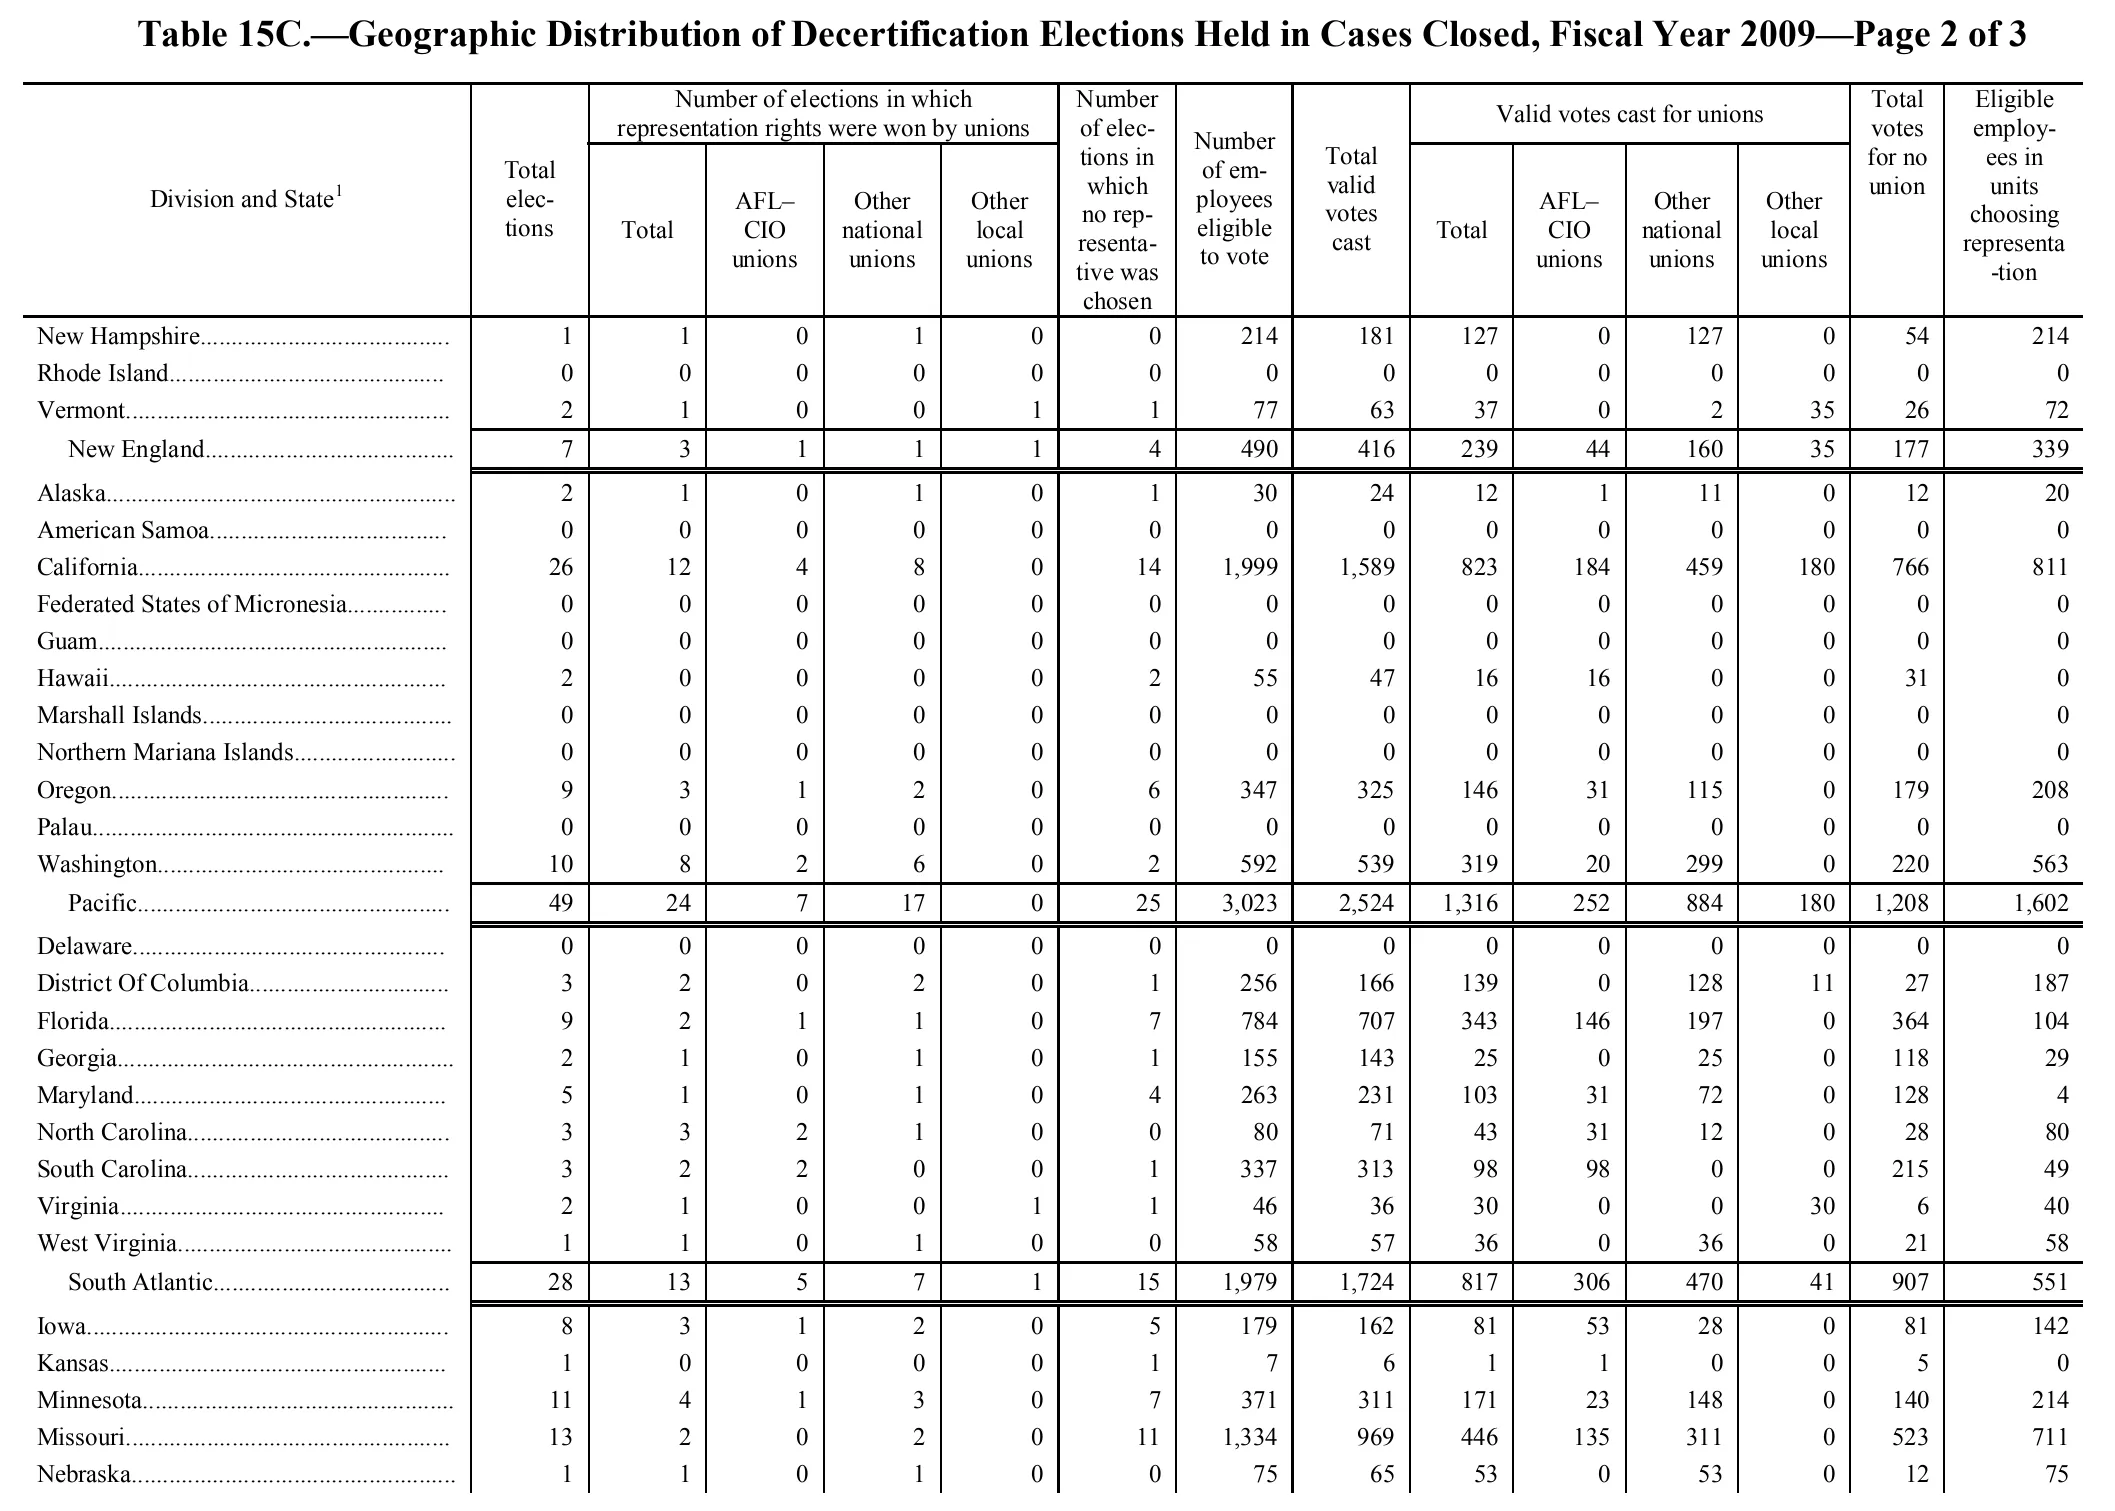
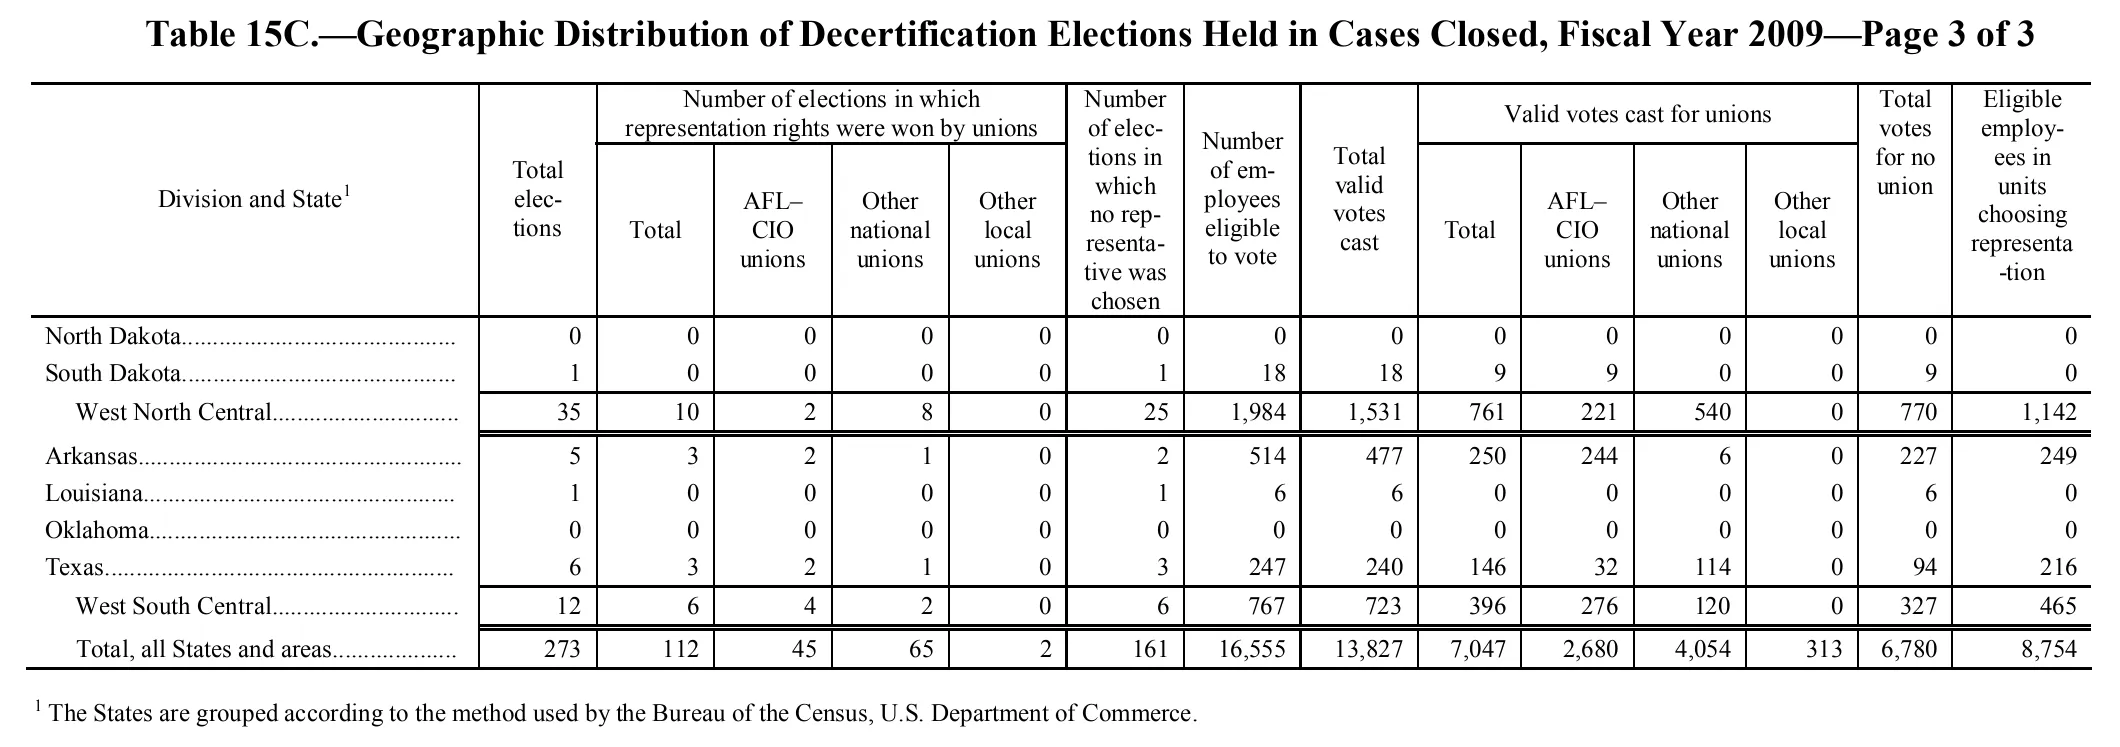
Geographic Distribution of Decertification Elections Held in Cases Closed, Fiscal Year 2009
Stitched from pp. 139–141.
| Division and State | Total elections | Number of elections in which representation rights were won by unions | Number of elections in which no representative was chosen | Number of employees eligible to vote | Total valid votes cast | Valid votes cast for unions | Total votes for no union | Eligible employees in units choosing representation | ||||||
|---|---|---|---|---|---|---|---|---|---|---|---|---|---|---|
| Division and State | Total elections | Total | AFL–CIO unions | Other national unions | Other local unions | Number of elections in which no representative was chosen | Number of employees eligible to vote | Total valid votes cast | Total | AFL–CIO unions | Other national unions | Other local unions | Total votes for no union | Eligible employees in units choosing representation |
| Illinois | 23 | 5 | 1 | 4 | 0 | 18 | 1,123 | 968 | 431 | 112 | 319 | 0 | 537 | 494 |
| Indiana | 7 | 4 | 2 | 2 | 0 | 3 | 877 | 683 | 352 | 303 | 49 | 0 | 331 | 544 |
| Michigan | 15 | 8 | 5 | 3 | 0 | 7 | 863 | 734 | 426 | 255 | 171 | 0 | 308 | 628 |
| Ohio | 19 | 10 | 4 | 6 | 0 | 9 | 1,293 | 1,172 | 661 | 294 | 367 | 0 | 511 | 870 |
| Wisconsin | 8 | 2 | 1 | 1 | 0 | 6 | 327 | 270 | 143 | 19 | 124 | 0 | 127 | 236 |
| East North Central | 72 | 29 | 13 | 16 | 0 | 43 | 4,483 | 3,827 | 2,013 | 983 | 1,030 | 0 | 1,814 | 2,772 |
| Alabama | 3 | 1 | 0 | 1 | 0 | 2 | 79 | 71 | 28 | 7 | 21 | 0 | 43 | 29 |
| Kentucky | 5 | 4 | 4 | 0 | 0 | 1 | 254 | 226 | 189 | 125 | 64 | 0 | 37 | 233 |
| Mississippi | 0 | 0 | 0 | 0 | 0 | 0 | 0 | 0 | 0 | 0 | 0 | 0 | 0 | 0 |
| Tennessee | 4 | 1 | 1 | 0 | 0 | 3 | 268 | 223 | 87 | 78 | 9 | 0 | 136 | 3 |
| East South Central | 12 | 6 | 5 | 1 | 0 | 6 | 601 | 520 | 304 | 210 | 94 | 0 | 216 | 265 |
| Puerto Rico | 1 | 1 | 1 | 0 | 0 | 0 | 33 | 30 | 23 | 23 | 0 | 0 | 7 | 33 |
| U.S. Minor Outlying Islands | 0 | 0 | 0 | 0 | 0 | 0 | 0 | 0 | 0 | 0 | 0 | 0 | 0 | 0 |
| Virgin Islands | 1 | 0 | 0 | 0 | 0 | 1 | 119 | 87 | 30 | 0 | 0 | 30 | 57 | 0 |
| Island Areas | 2 | 1 | 1 | 0 | 0 | 1 | 152 | 117 | 53 | 23 | 0 | 30 | 64 | 33 |
| New Jersey | 16 | 5 | 1 | 4 | 0 | 11 | 1,121 | 832 | 448 | 49 | 375 | 24 | 384 | 602 |
| New York | 20 | 4 | 0 | 4 | 0 | 16 | 957 | 763 | 197 | 46 | 148 | 3 | 566 | 144 |
| Pennsylvania | 13 | 8 | 4 | 4 | 0 | 5 | 599 | 583 | 370 | 172 | 198 | 0 | 213 | 474 |
| Middle Atlantic | 49 | 17 | 5 | 12 | 0 | 32 | 2,677 | 2,178 | 1,015 | 267 | 721 | 27 | 1,163 | 1,220 |
| Arizona | 0 | 0 | 0 | 0 | 0 | 0 | 0 | 0 | 0 | 0 | 0 | 0 | 0 | 0 |
| Colorado | 1 | 1 | 1 | 0 | 0 | 0 | 282 | 163 | 85 | 85 | 0 | 0 | 78 | 282 |
| Idaho | 1 | 1 | 0 | 1 | 0 | 0 | 63 | 62 | 32 | 0 | 32 | 0 | 30 | 63 |
| Montana | 3 | 0 | 0 | 0 | 0 | 3 | 30 | 20 | 5 | 2 | 3 | 0 | 15 | 0 |
| Nevada | 0 | 0 | 0 | 0 | 0 | 0 | 0 | 0 | 0 | 0 | 0 | 0 | 0 | 0 |
| New Mexico | 0 | 0 | 0 | 0 | 0 | 0 | 0 | 0 | 0 | 0 | 0 | 0 | 0 | 0 |
| Utah | 1 | 1 | 1 | 0 | 0 | 0 | 20 | 19 | 11 | 11 | 0 | 0 | 8 | 20 |
| Wyoming | 1 | 0 | 0 | 0 | 0 | 1 | 4 | 3 | 0 | 0 | 0 | 0 | 3 | 0 |
| Mountain | 7 | 3 | 2 | 1 | 0 | 4 | 399 | 267 | 133 | 98 | 35 | 0 | 134 | 365 |
| Connecticut | 1 | 0 | 0 | 0 | 0 | 1 | 3 | 2 | 0 | 0 | 0 | 0 | 2 | 0 |
| Maine | 1 | 1 | 1 | 0 | 0 | 0 | 53 | 51 | 32 | 32 | 0 | 0 | 19 | 53 |
| Massachusetts | 2 | 0 | 0 | 0 | 0 | 2 | 143 | 119 | 43 | 12 | 31 | 0 | 76 | 0 |
| New Hampshire | 1 | 1 | 0 | 1 | 0 | 0 | 214 | 181 | 127 | 0 | 127 | 0 | 54 | 214 |
| Rhode Island | 0 | 0 | 0 | 0 | 0 | 0 | 0 | 0 | 0 | 0 | 0 | 0 | 0 | 0 |
| Vermont | 2 | 1 | 0 | 0 | 1 | 1 | 77 | 63 | 37 | 0 | 2 | 35 | 26 | 72 |
| New England | 7 | 3 | 1 | 1 | 1 | 4 | 490 | 416 | 239 | 44 | 160 | 35 | 177 | 339 |
| Alaska | 2 | 1 | 0 | 1 | 0 | 1 | 30 | 24 | 12 | 1 | 11 | 0 | 12 | 20 |
| American Samoa | 0 | 0 | 0 | 0 | 0 | 0 | 0 | 0 | 0 | 0 | 0 | 0 | 0 | 0 |
| California | 26 | 12 | 4 | 8 | 0 | 14 | 1,999 | 1,589 | 823 | 184 | 459 | 180 | 766 | 811 |
| Federated States of Micronesia | 0 | 0 | 0 | 0 | 0 | 0 | 0 | 0 | 0 | 0 | 0 | 0 | 0 | 0 |
| Guam | 0 | 0 | 0 | 0 | 0 | 0 | 0 | 0 | 0 | 0 | 0 | 0 | 0 | 0 |
| Hawaii | 2 | 0 | 0 | 0 | 0 | 2 | 55 | 47 | 16 | 16 | 0 | 0 | 31 | 0 |
| Marshall Islands | 0 | 0 | 0 | 0 | 0 | 0 | 0 | 0 | 0 | 0 | 0 | 0 | 0 | 0 |
| Northern Mariana Islands | 0 | 0 | 0 | 0 | 0 | 0 | 0 | 0 | 0 | 0 | 0 | 0 | 0 | 0 |
| Oregon | 9 | 3 | 1 | 2 | 0 | 6 | 347 | 325 | 146 | 31 | 115 | 0 | 179 | 208 |
| Palau | 0 | 0 | 0 | 0 | 0 | 0 | 0 | 0 | 0 | 0 | 0 | 0 | 0 | 0 |
| Washington | 10 | 8 | 2 | 6 | 0 | 2 | 592 | 539 | 319 | 20 | 299 | 0 | 220 | 563 |
| Pacific | 49 | 24 | 7 | 17 | 0 | 25 | 3,023 | 2,524 | 1,316 | 252 | 884 | 180 | 1,208 | 1,602 |
| Delaware | 0 | 0 | 0 | 0 | 0 | 0 | 0 | 0 | 0 | 0 | 0 | 0 | 0 | 0 |
| District Of Columbia | 3 | 2 | 0 | 2 | 0 | 1 | 256 | 166 | 139 | 0 | 128 | 11 | 27 | 187 |
| Florida | 9 | 2 | 1 | 1 | 0 | 7 | 784 | 707 | 343 | 146 | 197 | 0 | 364 | 104 |
| Georgia | 2 | 1 | 0 | 1 | 0 | 1 | 155 | 143 | 25 | 0 | 25 | 0 | 118 | 29 |
| Maryland | 5 | 1 | 0 | 1 | 0 | 4 | 263 | 231 | 103 | 31 | 72 | 0 | 128 | 4 |
| North Carolina | 3 | 3 | 2 | 1 | 0 | 0 | 80 | 71 | 43 | 31 | 12 | 0 | 28 | 80 |
| South Carolina | 3 | 2 | 2 | 0 | 0 | 1 | 337 | 313 | 98 | 98 | 0 | 0 | 215 | 49 |
| Virginia | 2 | 1 | 0 | 0 | 1 | 1 | 46 | 36 | 30 | 0 | 0 | 30 | 6 | 40 |
| West Virginia | 1 | 1 | 0 | 1 | 0 | 0 | 58 | 57 | 36 | 0 | 36 | 0 | 21 | 58 |
| South Atlantic | 28 | 13 | 5 | 7 | 1 | 15 | 1,979 | 1,724 | 817 | 306 | 470 | 41 | 907 | 551 |
| Iowa | 8 | 3 | 1 | 2 | 0 | 5 | 179 | 162 | 81 | 53 | 28 | 0 | 81 | 142 |
| Kansas | 1 | 0 | 0 | 0 | 0 | 1 | 7 | 6 | 1 | 1 | 0 | 0 | 5 | 0 |
| Minnesota | 11 | 4 | 1 | 3 | 0 | 7 | 371 | 311 | 171 | 23 | 148 | 0 | 140 | 214 |
| Missouri | 13 | 2 | 0 | 2 | 0 | 11 | 1,334 | 969 | 446 | 135 | 311 | 0 | 523 | 711 |
| Nebraska | 1 | 1 | 0 | 1 | 0 | 0 | 75 | 65 | 53 | 0 | 53 | 0 | 12 | 75 |
| North Dakota | 0 | 0 | 0 | 0 | 0 | 0 | 0 | 0 | 0 | 0 | 0 | 0 | 0 | 0 |
| South Dakota | 1 | 0 | 0 | 0 | 0 | 1 | 18 | 18 | 9 | 9 | 0 | 0 | 9 | 0 |
| West North Central | 35 | 10 | 2 | 8 | 0 | 25 | 1,984 | 1,531 | 761 | 221 | 540 | 0 | 770 | 1,142 |
| Arkansas | 5 | 3 | 2 | 1 | 0 | 2 | 514 | 477 | 250 | 244 | 6 | 0 | 227 | 249 |
| Louisiana | 1 | 0 | 0 | 0 | 0 | 1 | 6 | 6 | 0 | 0 | 0 | 0 | 6 | 0 |
| Oklahoma | 0 | 0 | 0 | 0 | 0 | 0 | 0 | 0 | 0 | 0 | 0 | 0 | 0 | 0 |
| Texas | 6 | 3 | 2 | 1 | 0 | 3 | 247 | 240 | 146 | 32 | 114 | 0 | 94 | 216 |
| West South Central | 12 | 6 | 4 | 2 | 0 | 6 | 767 | 723 | 396 | 276 | 120 | 0 | 327 | 465 |
| Total, all States and areas | 273 | 112 | 45 | 65 | 2 | 161 | 16,555 | 13,827 | 7,047 | 2,680 | 4,054 | 313 | 6,780 | 8,754 |
- 1 The States are grouped according to the method used by the Bureau of the Census, U.S. Department of Commerce.
593 of 593 figures sit in a row or column sum that works out.
Reader’s notes
p. 139. 15 columns, two heading levels. Four spanner groups: "Number of elections in which representation rights were won by unions" over columns 2-5 (Total / AFL-CIO unions / Other national unions / Other local unions) and "Valid votes cast for unions" over columns 9-12 (same four sub-headings); the remaining headings are tall single cells repeated in both levels. The stub heading carries a superscript 1 ("Division and State^1"), but the footnote text itself is not printed on this crop — the caption reads "Page 1 of 3" and the table continues on following pages, so footnotes is empty here. The crop ends after the Massachusetts row, mid-division (the New England group's remaining states and its subtotal line fall on the next page). Rows such as "East North Central", "East South Central", "Island Areas", "Middle Atlantic" and "Mountain" are printed indented as division subtotals, set off by double rules; their labels are given as printed. All cells are legible; no doubtful digits. Every subtotal row I could check (East North Central, East South Central, Island Areas, Middle Atlantic, Mountain) sums correctly from its member states, and in each data row the three union sub-columns sum to the union "Total" column, so column alignment is corroborated arithmetically. Tennessee's last column ("Eligible employees in units choosing representation") is a single digit 3, which is confirmed by the East South Central subtotal of 265 = 29 + 233 + 0 + 3. The AFL-CIO headings are printed with an en dash ("AFL–CIO"); end-of-line hyphenation ("Total elec-tions", "Number of em-ployees eligible to vote", "no rep-resenta-tive was chosen", "representa-tion") has been rejoined.
p. 140. 15 columns: stub plus 14 numeric columns. Two heading levels; the tall single headings (stub, "Total elections", "Number of elections in which no representative was chosen", "Number of employees eligible to vote", "Total valid votes cast", "Total votes for no union", "Eligible employees in units choosing representation") are repeated in both levels, and the two spanner headings are repeated across the four columns each spans. End-of-line hyphenation repaired in the headings ("elec-tions", "em-ployees", "rep-resenta-tive", "employ-ees", "representa-tion"). "AFL-CIO" is set with an en dash in the original; transcribed with a plain hyphen. The stub heading carries footnote marker 1, but no footnote text is printed on this crop (it is page 2 of 3 of the table; the note presumably appears on the final page). The crop is cut off at the bottom: the body ends mid-division with Nebraska, and the West North Central subtotal and the remaining divisions continue on the next page. The indented division rows ("New England", "Pacific", "South Atlantic") are subtotal lines; the New England subtotal does not equal the sum of the three New England states shown here because Connecticut, Maine and Massachusetts are printed on the preceding page. The Pacific and South Atlantic subtotals reconcile exactly with the states listed above them in all 14 numeric columns, and every row satisfies "total valid votes = votes for unions + votes for no union" and "union total = AFL-CIO + other national + other local", so no misprints are suspected. No cells were illegible or doubtful.
p. 141. The crop is the final page of a table continued from earlier pages: the first two State rows (North Dakota, South Dakota) complete the West North Central division whose earlier States are not on this image, and the indented "West North Central" and "West South Central" lines are division subtotals. All printed values are legible; internal arithmetic checks out (e.g., 112 + 161 = 273; 2,680 + 4,054 + 313 = 7,047; 7,047 + 6,780 = 13,827), so no suspected misprints. The heading "AFL–CIO unions" is printed with an en dash.
Source image
Source data: U.S. NLRB Annual Reports (public domain). Reconstruction by NLRB Stats Archive. Read by claude-opus-5 (effort max, prompt extract_v1) from the 300-dpi scan; stitched by page. Updated October 2026.