NLRB Stats Archive › Annual Reports › FY2008 › Proceedings Decided by Circuit Courts of Appeals on Petitions for Enforcement and/or Review of Board Orders, Fiscal Year 2008, Compared With 5-Year Cumulative Totals, 2003 Through 2008
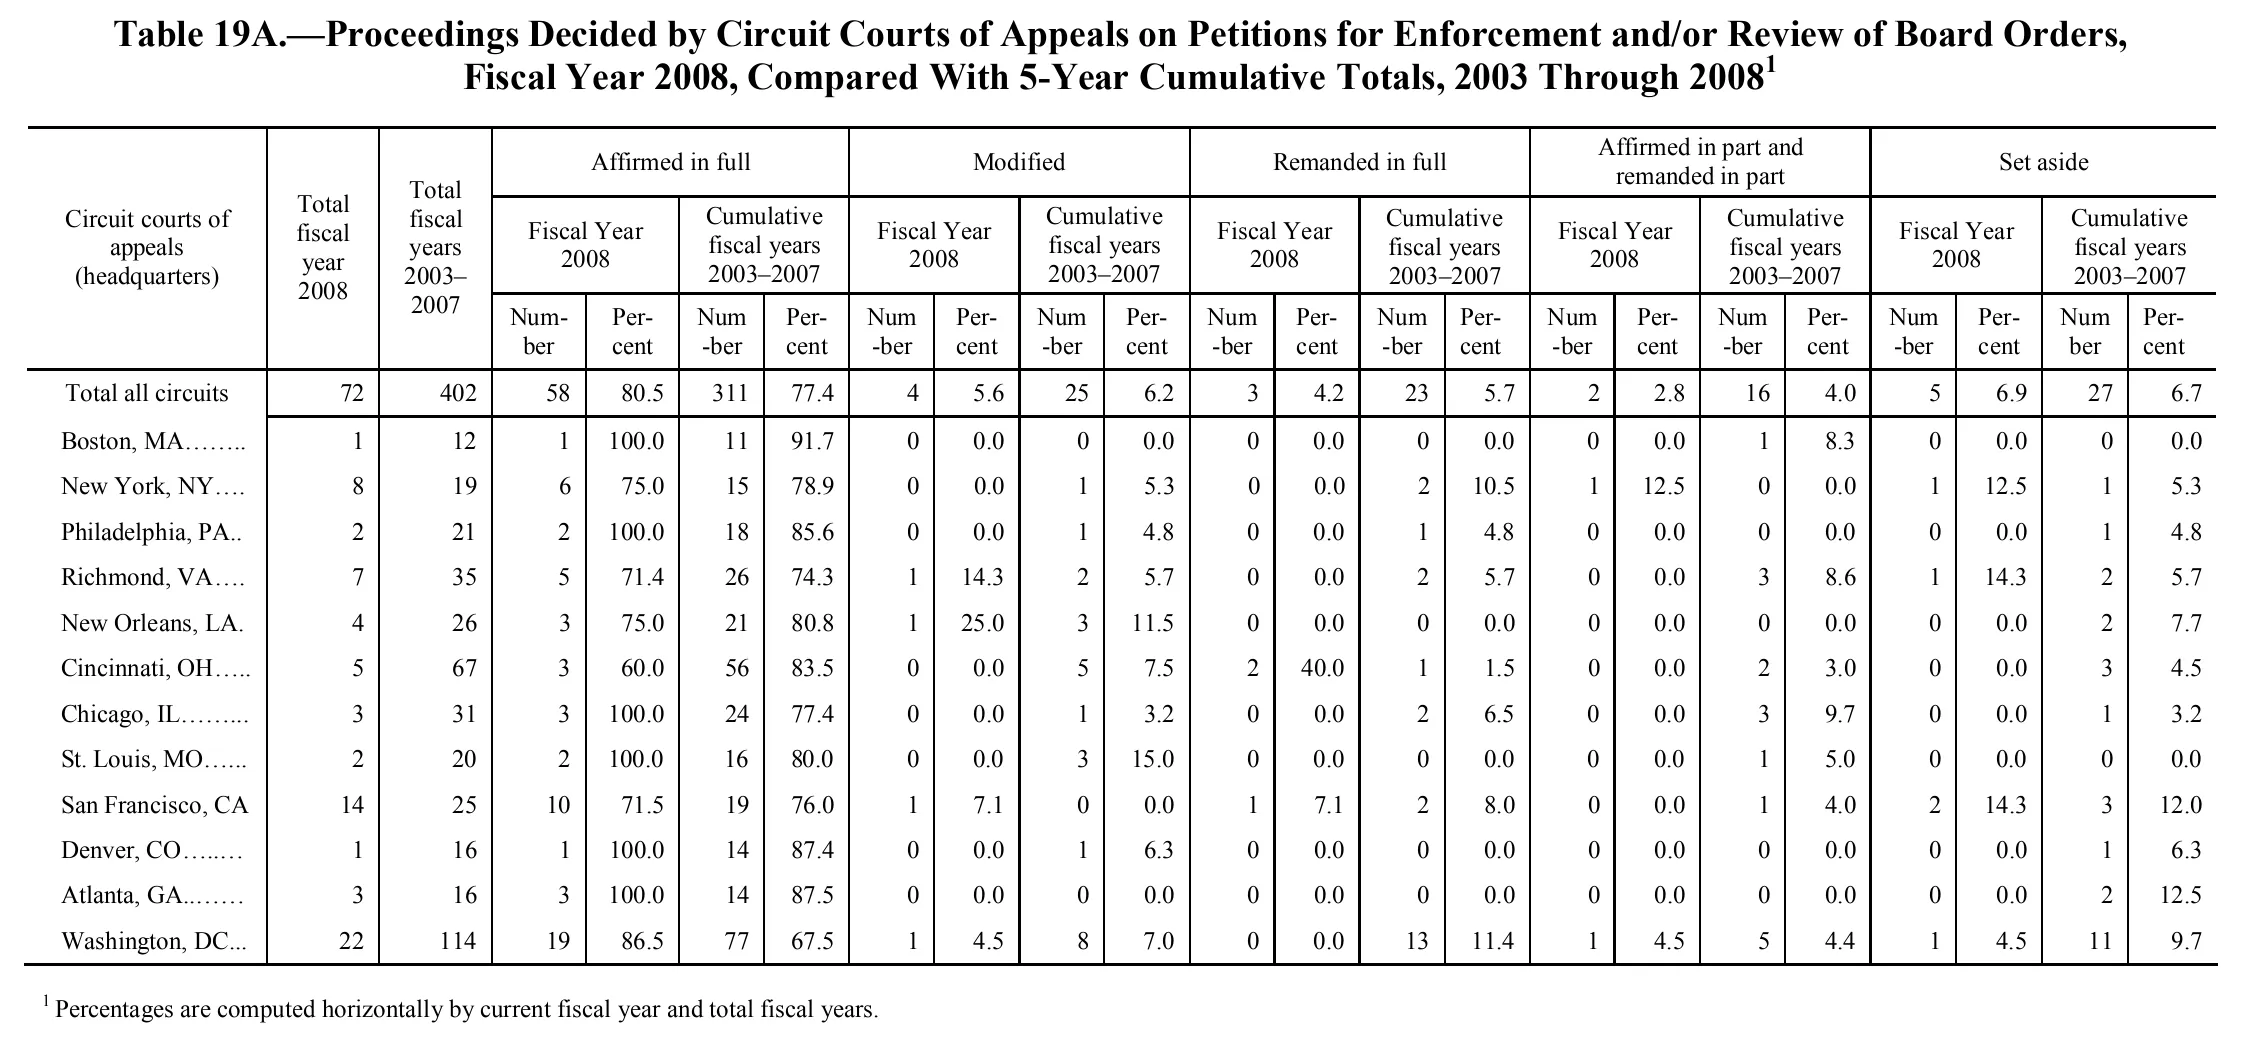
Proceedings Decided by Circuit Courts of Appeals on Petitions for Enforcement and/or Review of Board Orders, Fiscal Year 2008, Compared With 5-Year Cumulative Totals, 2003 Through 2008
| Circuit courts of appeals (headquarters) | Total fiscal year 2008 | Total fiscal years 2003–2007 | Affirmed in full | Modified | Remanded in full | Affirmed in part and remanded in part | Set aside | |||||||||||||||
|---|---|---|---|---|---|---|---|---|---|---|---|---|---|---|---|---|---|---|---|---|---|---|
| Circuit courts of appeals (headquarters) | Total fiscal year 2008 | Total fiscal years 2003–2007 | Fiscal Year 2008 | Cumulative fiscal years 2003–2007 | Fiscal Year 2008 | Cumulative fiscal years 2003–2007 | Fiscal Year 2008 | Cumulative fiscal years 2003–2007 | Fiscal Year 2008 | Cumulative fiscal years 2003–2007 | Fiscal Year 2008 | Cumulative fiscal years 2003–2007 | ||||||||||
| Circuit courts of appeals (headquarters) | Total fiscal year 2008 | Total fiscal years 2003–2007 | Number | Percent | Number | Percent | Number | Percent | Number | Percent | Number | Percent | Number | Percent | Number | Percent | Number | Percent | Number | Percent | Number | Percent |
| Total all circuits | 72 | 402 | 58 | 80.5 | 311 | 77.4 | 4 | 5.6 | 25 | 6.2 | 3 | 4.2 | 23 | 5.7 | 2 | 2.8 | 16 | 4.0 | 5 | 6.9 | 27 | 6.7 |
| Boston, MA | 1 | 12 | 1 | 100.0 | 11 | 91.7 | 0 | 0.0 | 0 | 0.0 | 0 | 0.0 | 0 | 0.0 | 0 | 0.0 | 1 | 8.3 | 0 | 0.0 | 0 | 0.0 |
| New York, NY | 8 | 19 | 6 | 75.0 | 15 | 78.9 | 0 | 0.0 | 1 | 5.3 | 0 | 0.0 | 2 | 10.5 | 1 | 12.5 | 0 | 0.0 | 1 | 12.5 | 1 | 5.3 |
| Philadelphia, PA | 2 | 21 | 2 | 100.0 | 18 | 85.6 | 0 | 0.0 | 1 | 4.8 | 0 | 0.0 | 1 | 4.8 | 0 | 0.0 | 0 | 0.0 | 0 | 0.0 | 1 | 4.8 |
| Richmond, VA | 7 | 35 | 5 | 71.4 | 26 | 74.3 | 1 | 14.3 | 2 | 5.7 | 0 | 0.0 | 2 | 5.7 | 0 | 0.0 | 3 | 8.6 | 1 | 14.3 | 2 | 5.7 |
| New Orleans, LA | 4 | 26 | 3 | 75.0 | 21 | 80.8 | 1 | 25.0 | 3 | 11.5 | 0 | 0.0 | 0 | 0.0 | 0 | 0.0 | 0 | 0.0 | 0 | 0.0 | 2 | 7.7 |
| Cincinnati, OH | 5 | 67 | 3 | 60.0 | 56 | 83.5 | 0 | 0.0 | 5 | 7.5 | 2 | 40.0 | 1 | 1.5 | 0 | 0.0 | 2 | 3.0 | 0 | 0.0 | 3 | 4.5 |
| Chicago, IL | 3 | 31 | 3 | 100.0 | 24 | 77.4 | 0 | 0.0 | 1 | 3.2 | 0 | 0.0 | 2 | 6.5 | 0 | 0.0 | 3 | 9.7 | 0 | 0.0 | 1 | 3.2 |
| St. Louis, MO | 2 | 20 | 2 | 100.0 | 16 | 80.0 | 0 | 0.0 | 3 | 15.0 | 0 | 0.0 | 0 | 0.0 | 0 | 0.0 | 1 | 5.0 | 0 | 0.0 | 0 | 0.0 |
| San Francisco, CA | 14 | 25 | 10 | 71.5 | 19 | 76.0 | 1 | 7.1 | 0 | 0.0 | 1 | 7.1 | 2 | 8.0 | 0 | 0.0 | 1 | 4.0 | 2 | 14.3 | 3 | 12.0 |
| Denver, CO | 1 | 16 | 1 | 100.0 | 14 | 87.4 | 0 | 0.0 | 1 | 6.3 | 0 | 0.0 | 0 | 0.0 | 0 | 0.0 | 0 | 0.0 | 0 | 0.0 | 1 | 6.3 |
| Atlanta, GA | 3 | 16 | 3 | 100.0 | 14 | 87.5 | 0 | 0.0 | 0 | 0.0 | 0 | 0.0 | 0 | 0.0 | 0 | 0.0 | 0 | 0.0 | 0 | 0.0 | 2 | 12.5 |
| Washington, DC | 22 | 114 | 19 | 86.5 | 77 | 67.5 | 1 | 4.5 | 8 | 7.0 | 0 | 0.0 | 13 | 11.4 | 1 | 4.5 | 5 | 4.4 | 1 | 4.5 | 11 | 9.7 |
- 1 Percentages are computed horizontally by current fiscal year and total fiscal years.
105 of 105 figures sit in a row or column sum that works out.
Reader’s notes
p. 139. Grid is 23 columns: stub, two "Total" columns, then five outcome groups (Affirmed in full; Modified; Remanded in full; Affirmed in part and remanded in part; Set aside), each split into Fiscal Year 2008 and Cumulative fiscal years 2003-2007, each of those split into Number and Percent. The stub heading and the two "Total" headings are tall single cells spanning all three heading levels, so they are repeated down the three header rows. The column-3 heading is printed as "Total fiscal years 2003- 2007" with the range dash at the line break; joined to "2003-2007". Arithmetic verification: every column of counts sums exactly to the printed "Total all circuits" figure, and every circuit's five outcome counts sum exactly to its printed row total, in both the fiscal-year-2008 and the cumulative columns. This gives high confidence that the counts and their column placement are correct. Five Percent cells are printed one tenth away from the value implied by the printed counts; all are transcribed exactly as printed, not corrected. They are the "Affirmed in full" percent cells for: Total all circuits, Fiscal Year 2008 Percent, printed 80.5 (58/72 = 80.6); Philadelphia, PA, Cumulative Percent, printed 85.6 (18/21 = 85.7); San Francisco, CA, Fiscal Year 2008 Percent, printed 71.5 (10/14 = 71.4); Denver, CO, Cumulative Percent, printed 87.4 (14/16 = 87.5); Washington, DC, Fiscal Year 2008 Percent, printed 86.5 (19/22 = 86.4). Because the discrepancy is confined to the final digit, these are the cells most at risk of a misread, though each reads clearly in the scan; they may equally be misprints in the source. Row labels are followed by leader dots, which have been dropped. "New Orleans, LA" is followed by a single dot that is a leader, not part of the state abbreviation, so no trailing period is kept; the period in "St. Louis" is retained. The superscript 1 after "2008" in the caption belongs to the caption and is omitted here along with the caption itself.
Source image
Source data: U.S. NLRB Annual Reports (public domain). Reconstruction by NLRB Stats Archive. Read by claude-opus-5 (effort max, prompt extract_v1) from the 300-dpi scan; stitched by page. Updated October 2026.