NLRB Stats Archive › Annual Reports › FY2008 › Disposition by Stage of Representation and Union Deauthorization Cases Closed, Fiscal Year 2008
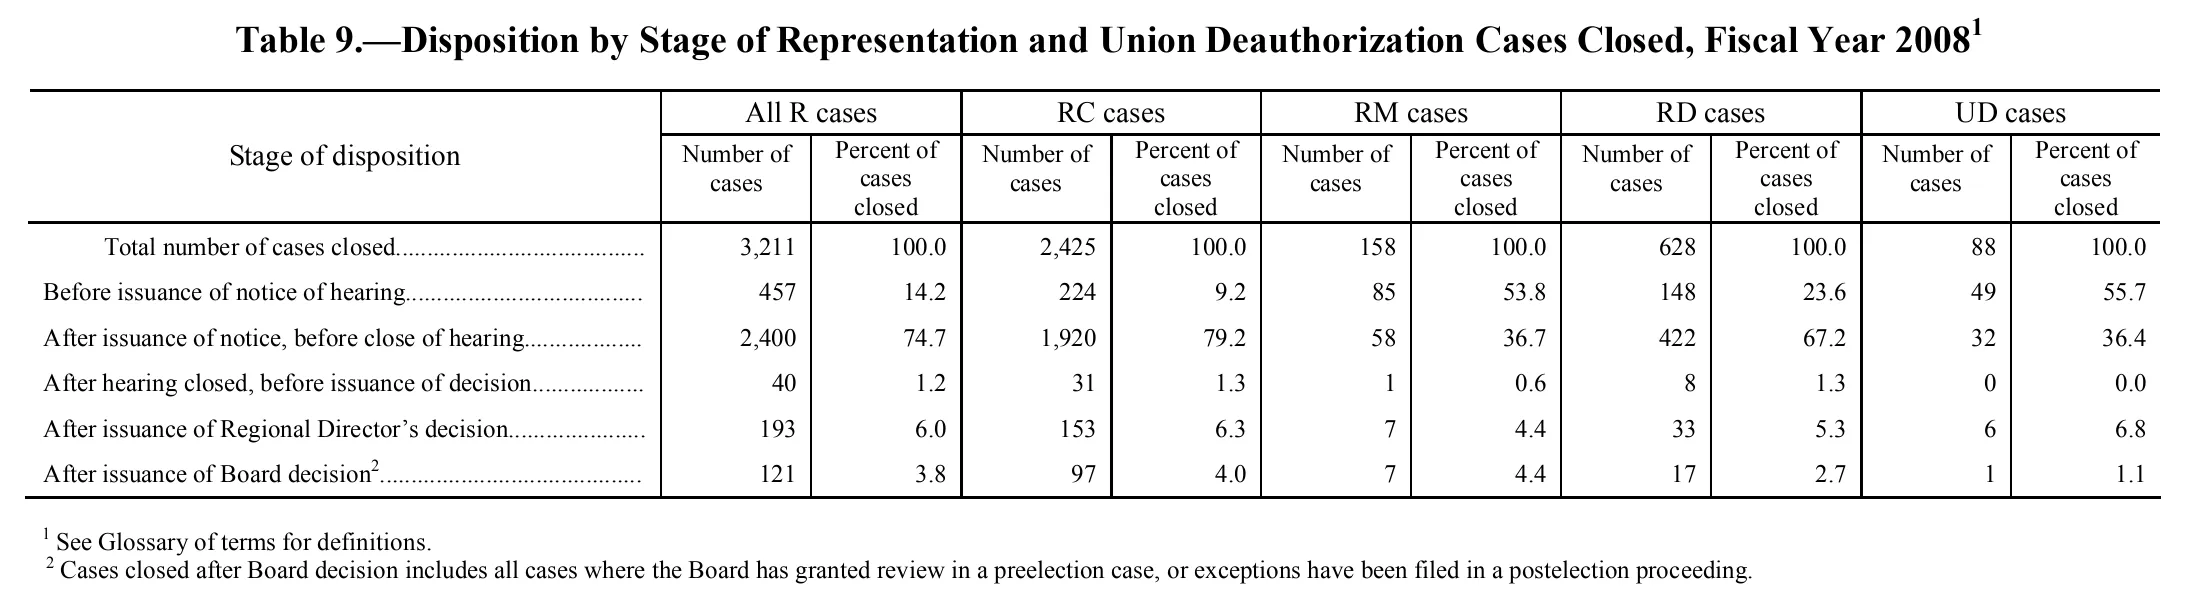
Disposition by Stage of Representation and Union Deauthorization Cases Closed, Fiscal Year 2008
| Stage of disposition | All R cases | RC cases | RM cases | RD cases | UD cases | |||||
|---|---|---|---|---|---|---|---|---|---|---|
| Stage of disposition | Number of cases | Percent of cases closed | Number of cases | Percent of cases closed | Number of cases | Percent of cases closed | Number of cases | Percent of cases closed | Number of cases | Percent of cases closed |
| Total number of cases closed | 3,211 | 100.0 | 2,425 | 100.0 | 158 | 100.0 | 628 | 100.0 | 88 | 100.0 |
| Before issuance of notice of hearing | 457 | 14.2 | 224 | 9.2 | 85 | 53.8 | 148 | 23.6 | 49 | 55.7 |
| After issuance of notice, before close of hearing | 2,400 | 74.7 | 1,920 | 79.2 | 58 | 36.7 | 422 | 67.2 | 32 | 36.4 |
| After hearing closed, before issuance of decision | 40 | 1.2 | 31 | 1.3 | 1 | 0.6 | 8 | 1.3 | 0 | 0.0 |
| After issuance of Regional Director's decision | 193 | 6.0 | 153 | 6.3 | 7 | 4.4 | 33 | 5.3 | 6 | 6.8 |
| After issuance of Board decision | 121 | 3.8 | 97 | 4.0 | 7 | 4.4 | 17 | 2.7 | 1 | 1.1 |
- 1 See Glossary of terms for definitions.
- 2 Cases closed after Board decision includes all cases where the Board has granted review in a preelection case, or exceptions have been filed in a postelection proceeding.
29 of 29 figures sit in a row or column sum that works out.
Reader’s notes
p. 106. Eleven columns: stub plus five two-column case-type panels (All R, RC, RM, RD, UD), each with "Number of cases" and "Percent of cases closed". The image is clean and no cell is doubtful. Footnote marker 1 is attached to the caption (Fiscal Year 2008^1), which is excluded per instructions; marker 2 sits on the row label "After issuance of Board decision". The apostrophe in "Regional Director's" is printed as a typographic right single quote. For reference only (nothing altered): the five stage rows sum exactly to each printed total — 3,211 / 2,425 / 158 / 628 / 88 — and the percent columns likewise sum to 99.7, 100.0, 99.9, 100.1 and 100.0 respectively, consistent with independent rounding.
Source image
Source data: U.S. NLRB Annual Reports (public domain). Reconstruction by NLRB Stats Archive. Read by claude-opus-5 (effort max, prompt extract_v1) from the 300-dpi scan; stitched by page. Updated October 2026.