NLRB Stats Archive › Annual Reports › FY2007 › Industrial Distribution of Representation Elections Held in Cases Closed, Fiscal Year 2007
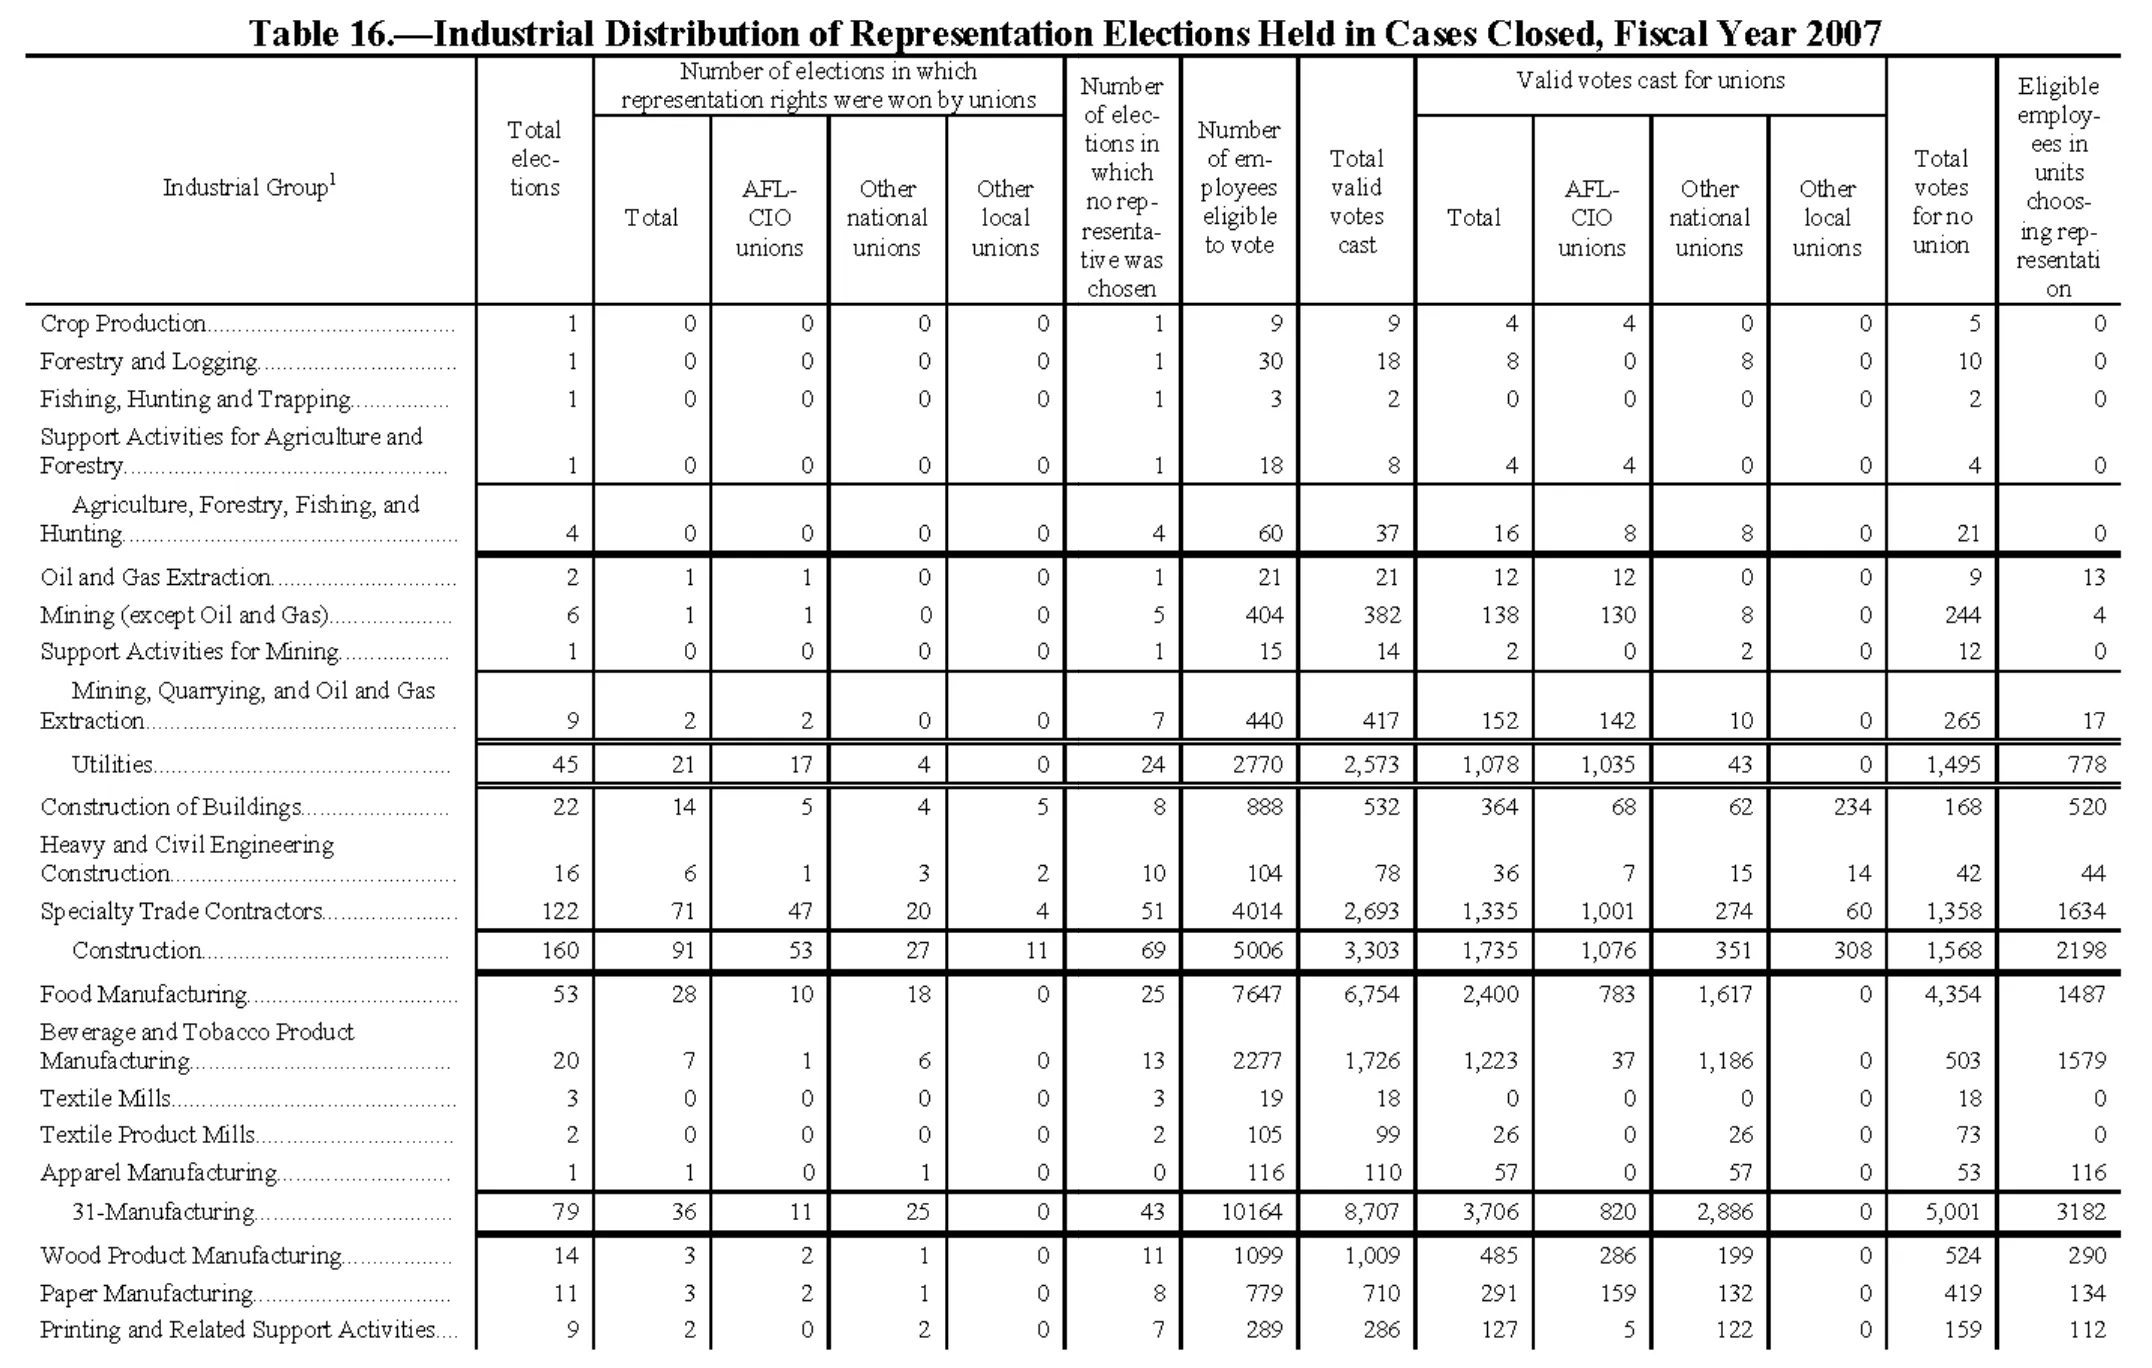
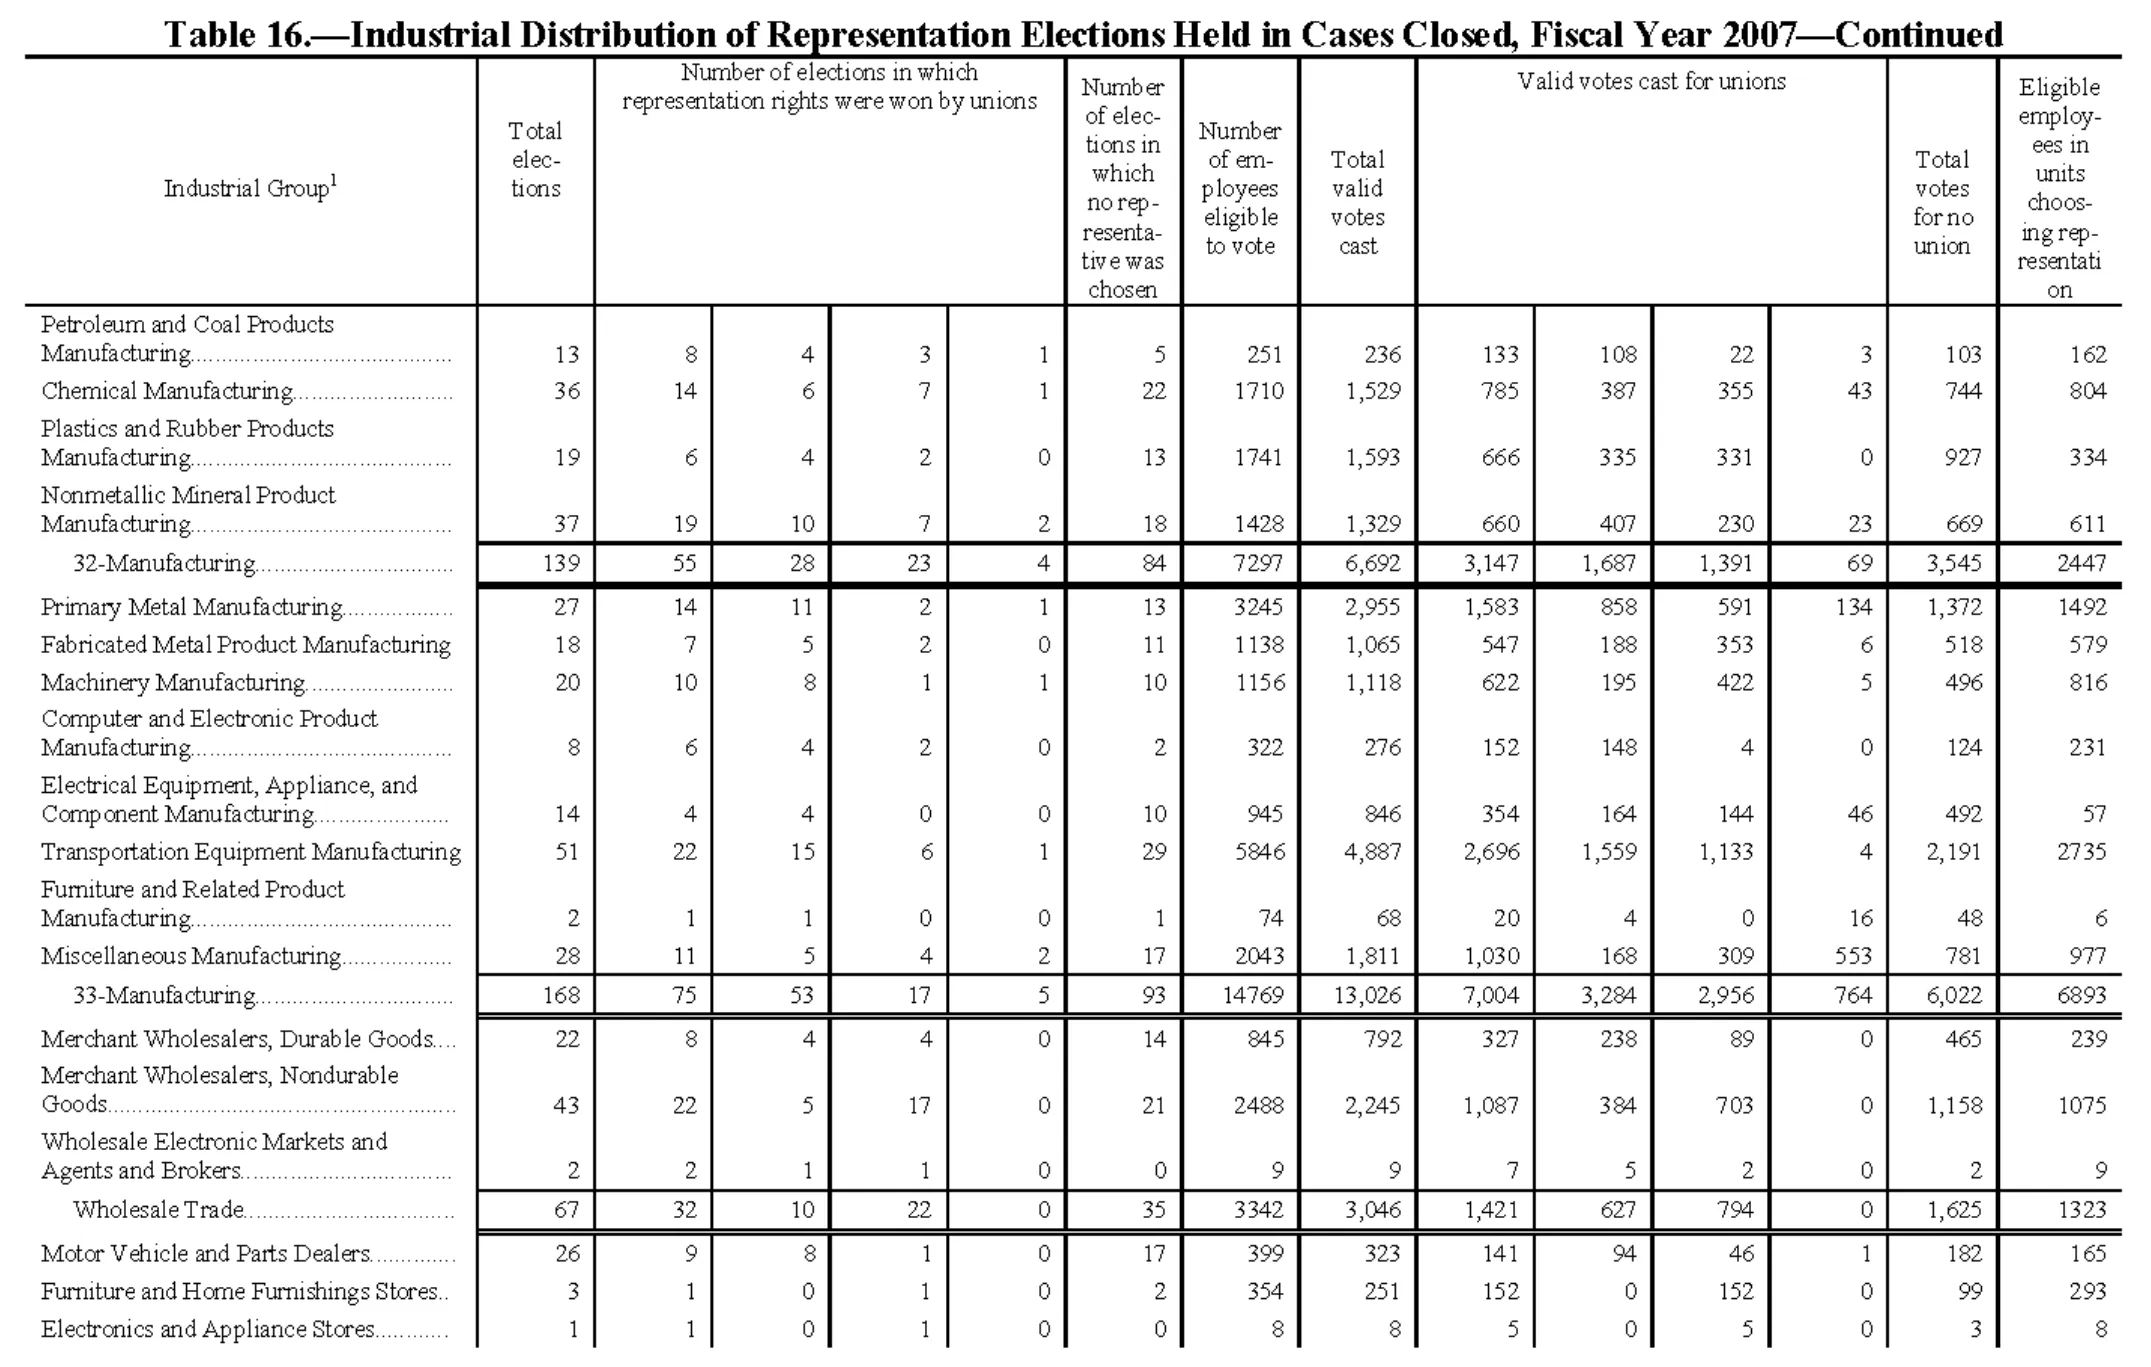
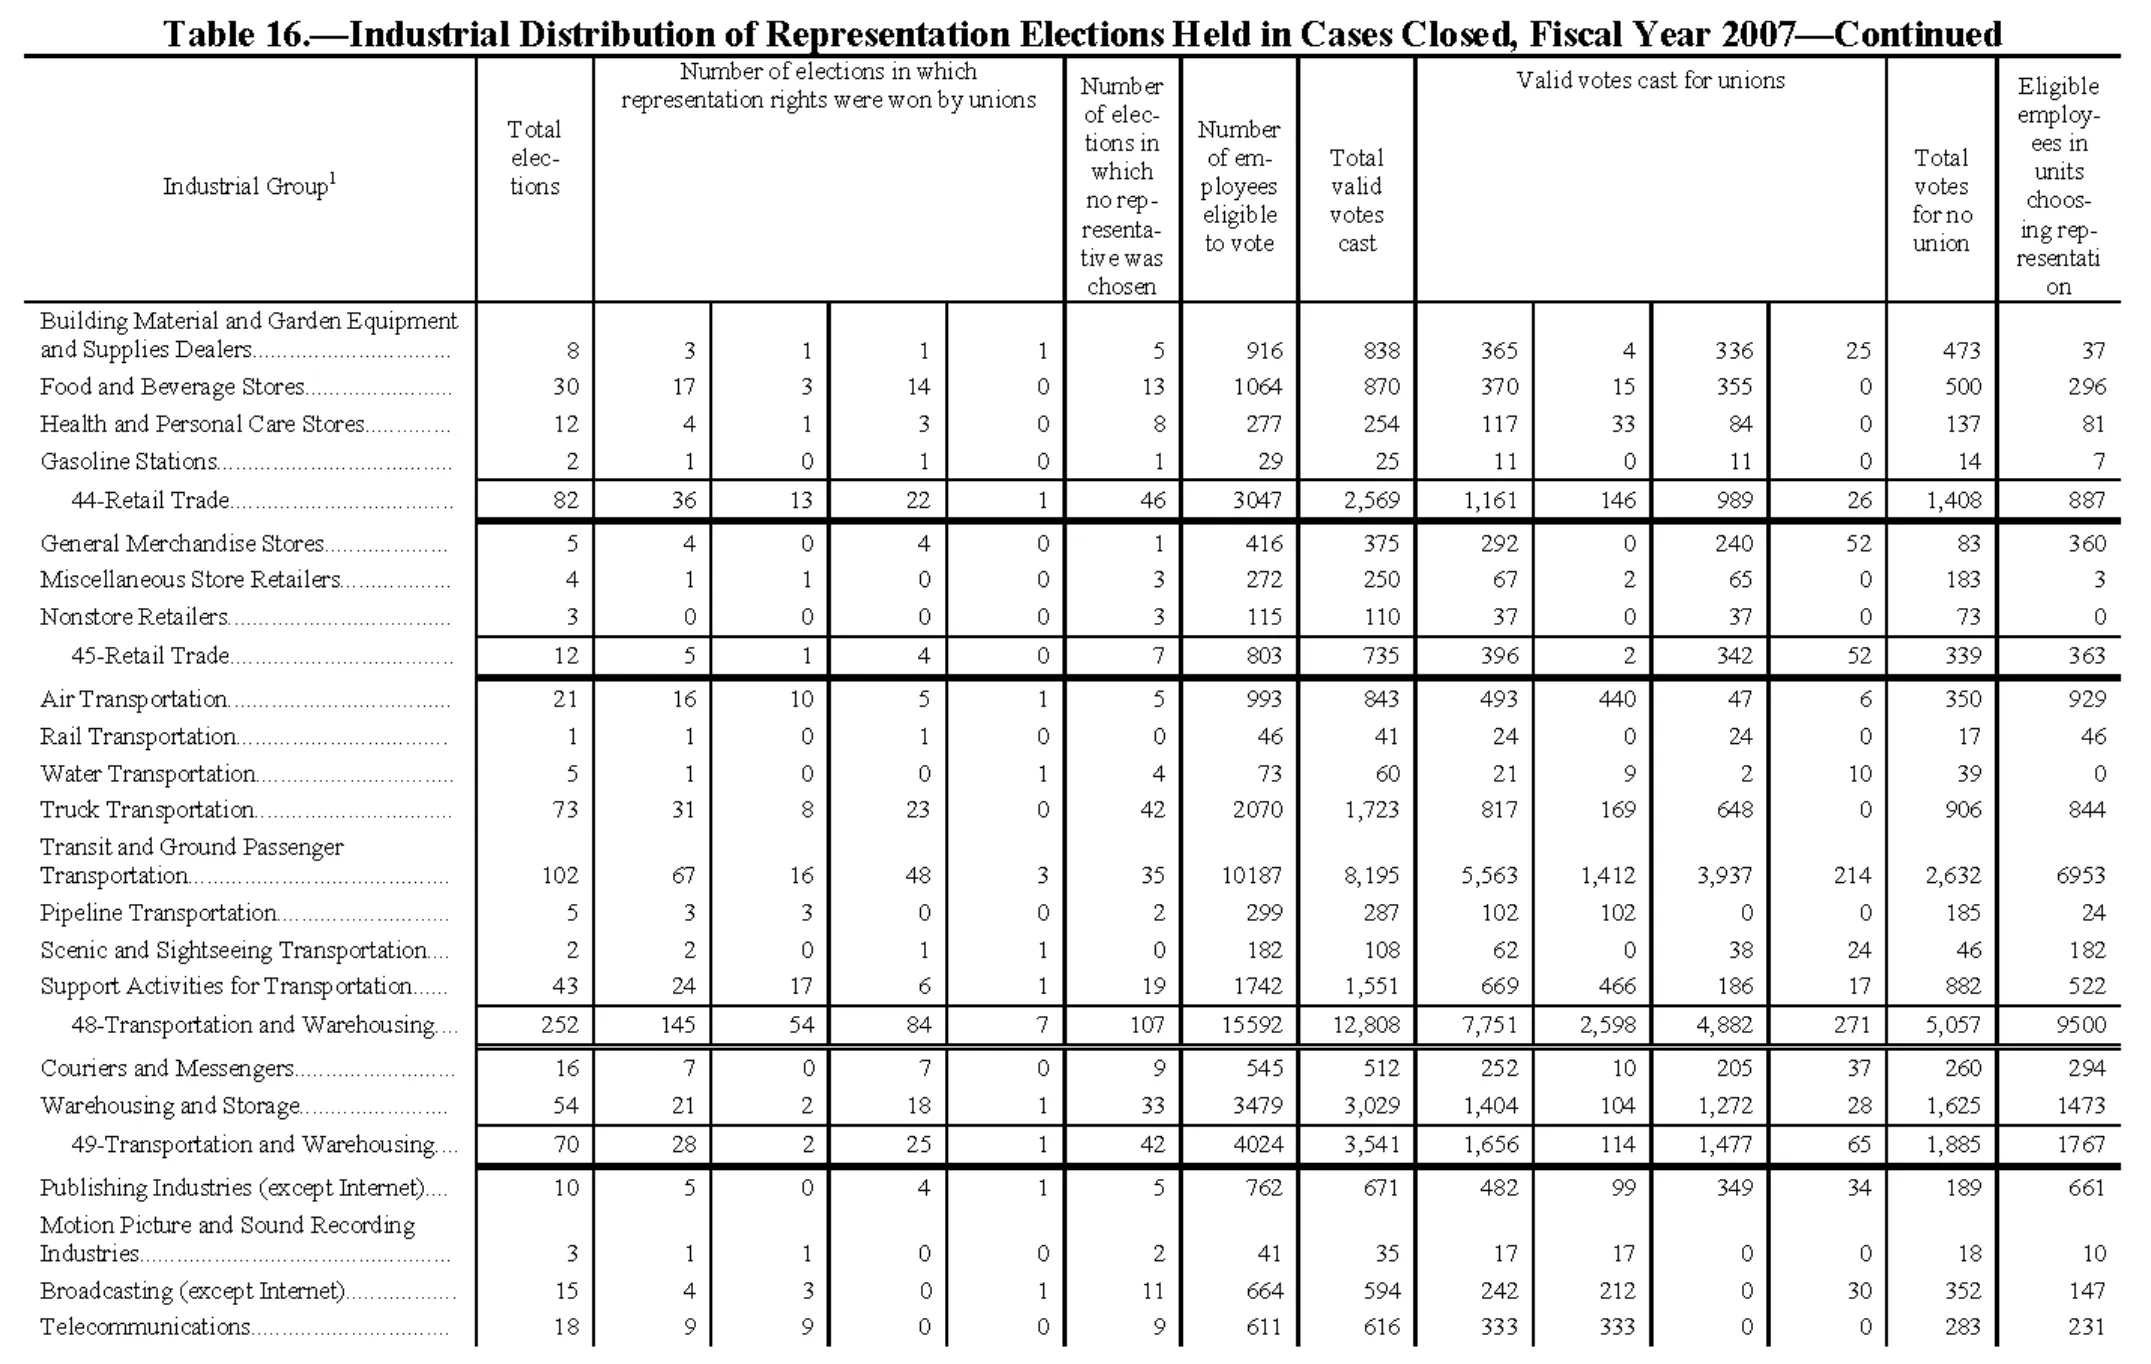
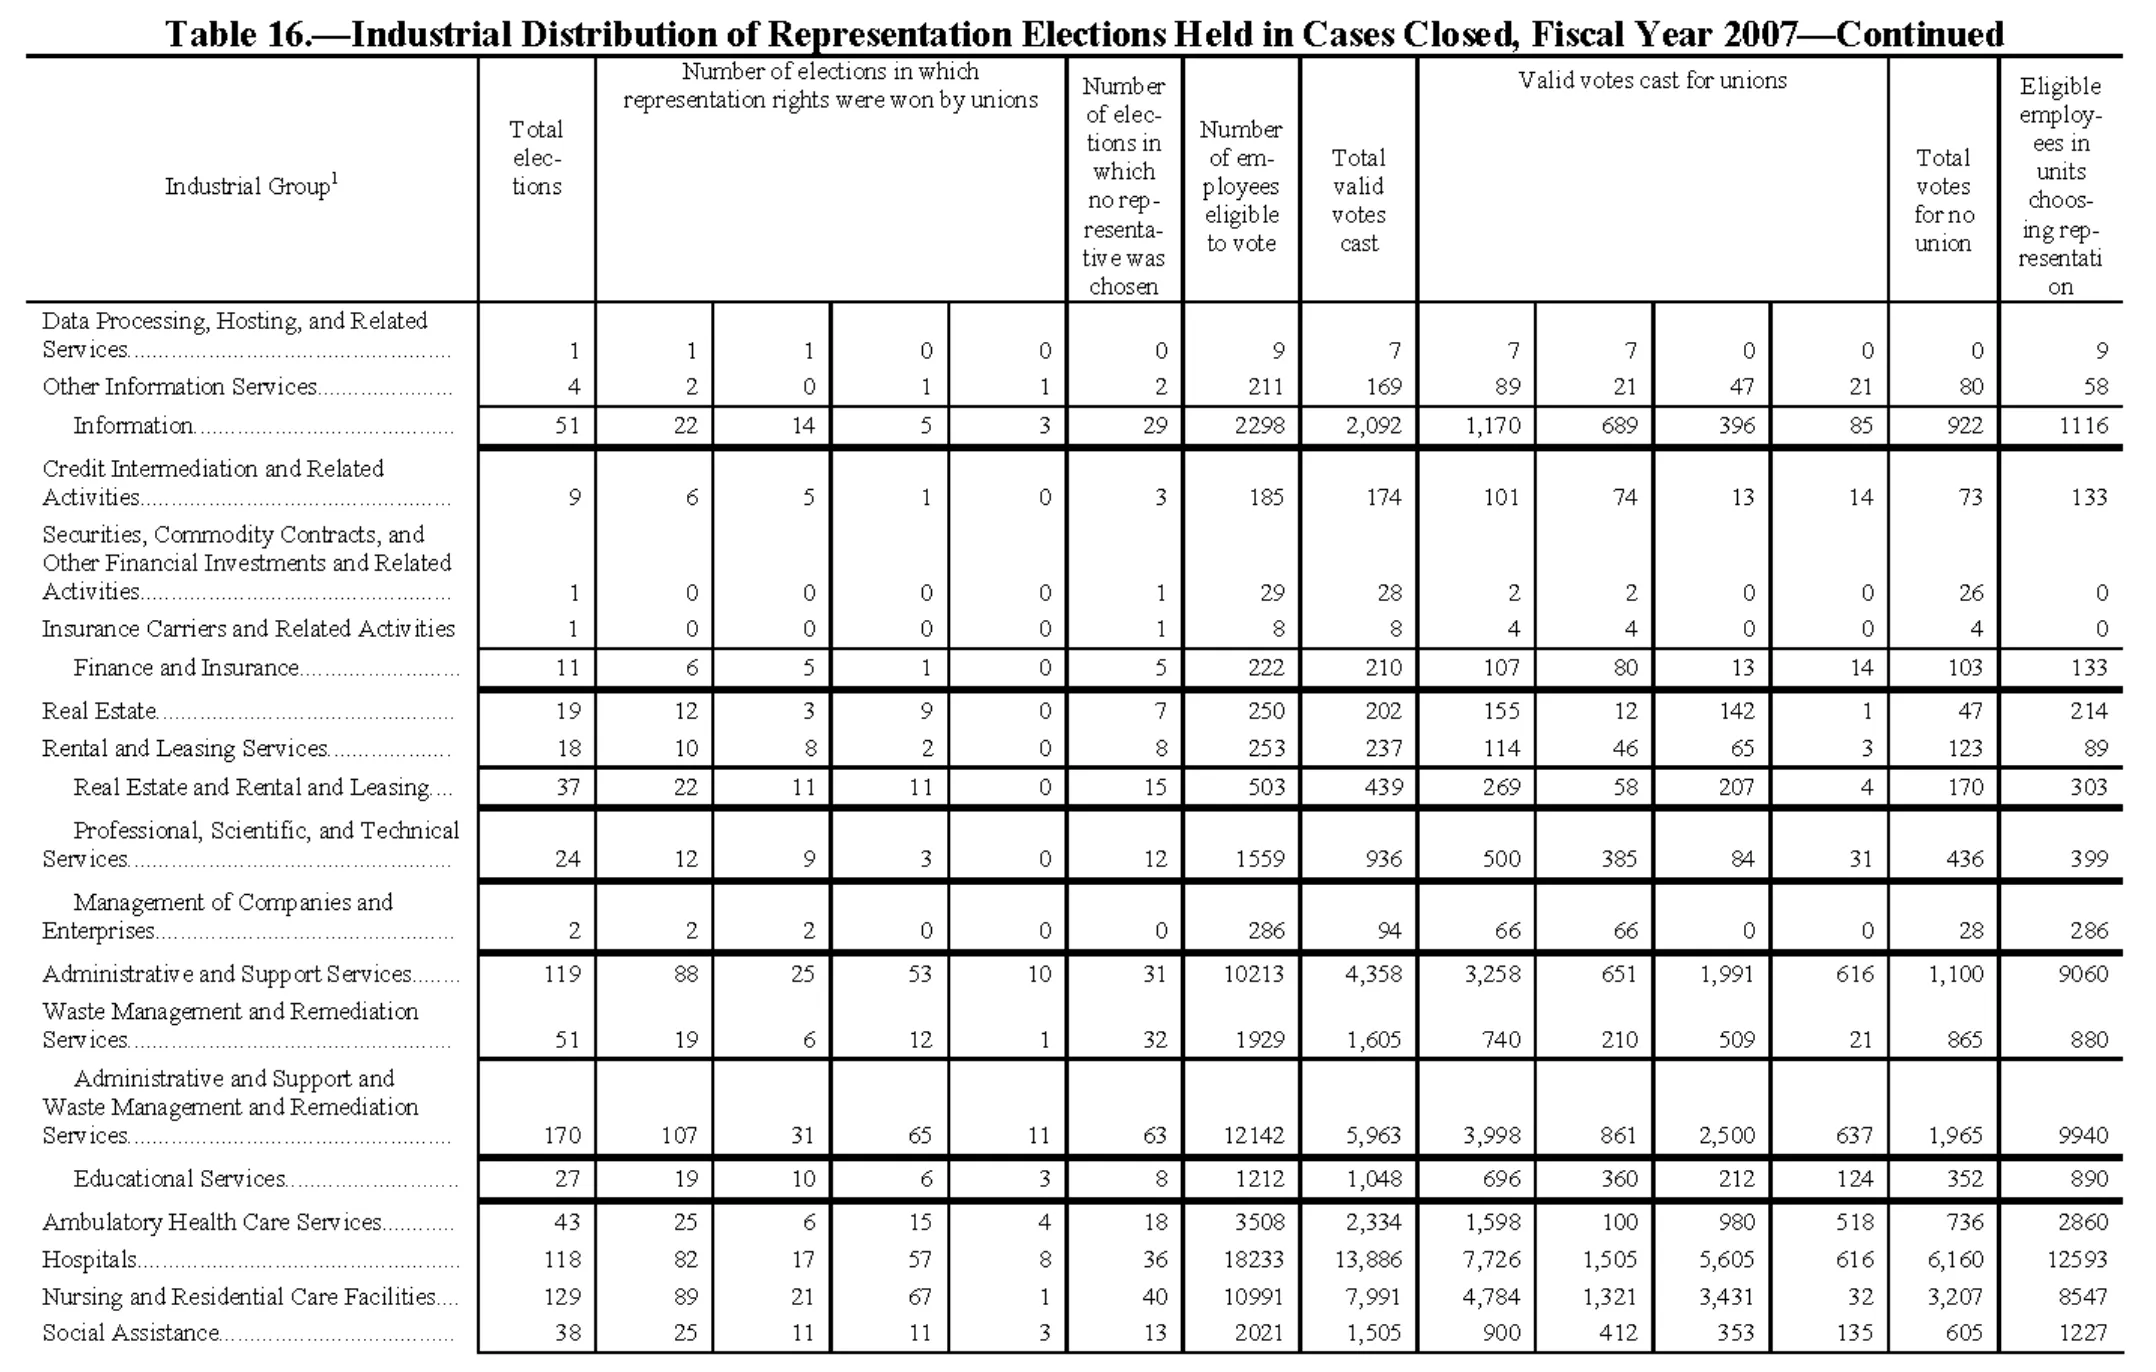
Industrial Distribution of Representation Elections Held in Cases Closed, Fiscal Year 2007
Stitched from pp. 173–177; a later page prints different headings, kept as rows.
| Industrial Group | Total elections | Number of elections in which representation rights were won by unions | Number of elections in which no representative was chosen | Number of employees eligible to vote | Total valid votes cast | Valid votes cast for unions | Total votes for no union | Eligible employees in units choosing representation | ||||||
|---|---|---|---|---|---|---|---|---|---|---|---|---|---|---|
| Industrial Group | Total elections | Total | AFL-CIO unions | Other national unions | Other local unions | Number of elections in which no representative was chosen | Number of employees eligible to vote | Total valid votes cast | Total | AFL-CIO unions | Other national unions | Other local unions | Total votes for no union | Eligible employees in units choosing representation |
| Crop Production | 1 | 0 | 0 | 0 | 0 | 1 | 9 | 9 | 4 | 4 | 0 | 0 | 5 | 0 |
| Forestry and Logging | 1 | 0 | 0 | 0 | 0 | 1 | 30 | 18 | 8 | 0 | 8 | 0 | 10 | 0 |
| Fishing, Hunting and Trapping | 1 | 0 | 0 | 0 | 0 | 1 | 3 | 2 | 0 | 0 | 0 | 0 | 2 | 0 |
| Support Activities for Agriculture and Forestry | 1 | 0 | 0 | 0 | 0 | 1 | 18 | 8 | 4 | 4 | 0 | 0 | 4 | 0 |
| Agriculture, Forestry, Fishing, and Hunting | 4 | 0 | 0 | 0 | 0 | 4 | 60 | 37 | 16 | 8 | 8 | 0 | 21 | 0 |
| Oil and Gas Extraction | 2 | 1 | 1 | 0 | 0 | 1 | 21 | 21 | 12 | 12 | 0 | 0 | 9 | 13 |
| Mining (except Oil and Gas) | 6 | 1 | 1 | 0 | 0 | 5 | 404 | 382 | 138 | 130 | 8 | 0 | 244 | 4 |
| Support Activities for Mining | 1 | 0 | 0 | 0 | 0 | 1 | 15 | 14 | 2 | 0 | 2 | 0 | 12 | 0 |
| Mining, Quarrying, and Oil and Gas Extraction | 9 | 2 | 2 | 0 | 0 | 7 | 440 | 417 | 152 | 142 | 10 | 0 | 265 | 17 |
| Utilities | 45 | 21 | 17 | 4 | 0 | 24 | 2770 | 2,573 | 1,078 | 1,035 | 43 | 0 | 1,495 | 778 |
| Construction of Buildings | 22 | 14 | 5 | 4 | 5 | 8 | 888 | 532 | 364 | 68 | 62 | 234 | 168 | 520 |
| Heavy and Civil Engineering Construction | 16 | 6 | 1 | 3 | 2 | 10 | 104 | 78 | 36 | 7 | 15 | 14 | 42 | 44 |
| Specialty Trade Contractors | 122 | 71 | 47 | 20 | 4 | 51 | 4014 | 2,693 | 1,335 | 1,001 | 274 | 60 | 1,358 | 1634 |
| Construction | 160 | 91 | 53 | 27 | 11 | 69 | 5006 | 3,303 | 1,735 | 1,076 | 351 | 308 | 1,568 | 2198 |
| Food Manufacturing | 53 | 28 | 10 | 18 | 0 | 25 | 7647 | 6,754 | 2,400 | 783 | 1,617 | 0 | 4,354 | 1487 |
| Beverage and Tobacco Product Manufacturing | 20 | 7 | 1 | 6 | 0 | 13 | 2277 | 1,726 | 1,223 | 37 | 1,186 | 0 | 503 | 1579 |
| Textile Mills | 3 | 0 | 0 | 0 | 0 | 3 | 19 | 18 | 0 | 0 | 0 | 0 | 18 | 0 |
| Textile Product Mills | 2 | 0 | 0 | 0 | 0 | 2 | 105 | 99 | 26 | 0 | 26 | 0 | 73 | 0 |
| Apparel Manufacturing | 1 | 1 | 0 | 1 | 0 | 0 | 116 | 110 | 57 | 0 | 57 | 0 | 53 | 116 |
| 31-Manufacturing | 79 | 36 | 11 | 25 | 0 | 43 | 10164 | 8,707 | 3,706 | 820 | 2,886 | 0 | 5,001 | 3182 |
| Wood Product Manufacturing | 14 | 3 | 2 | 1 | 0 | 11 | 1099 | 1,009 | 485 | 286 | 199 | 0 | 524 | 290 |
| Paper Manufacturing | 11 | 3 | 2 | 1 | 0 | 8 | 779 | 710 | 291 | 159 | 132 | 0 | 419 | 134 |
| Printing and Related Support Activities | 9 | 2 | 0 | 2 | 0 | 7 | 289 | 286 | 127 | 5 | 122 | 0 | 159 | 112 |
| Industrial Group | Total elections | Number of elections in which representation rights were won by unions | Number of elections in which representation rights were won by unions | Number of elections in which representation rights were won by unions | Number of elections in which representation rights were won by unions | Number of elections in which no representative was chosen | Number of employees eligible to vote | Total valid votes cast | Valid votes cast for unions | Valid votes cast for unions | Valid votes cast for unions | Valid votes cast for unions | Total votes for no union | Eligible employees in units choosing representation |
| Petroleum and Coal Products Manufacturing | 13 | 8 | 4 | 3 | 1 | 5 | 251 | 236 | 133 | 108 | 22 | 3 | 103 | 162 |
| Chemical Manufacturing | 36 | 14 | 6 | 7 | 1 | 22 | 1710 | 1,529 | 785 | 387 | 355 | 43 | 744 | 804 |
| Plastics and Rubber Products Manufacturing | 19 | 6 | 4 | 2 | 0 | 13 | 1741 | 1,593 | 666 | 335 | 331 | 0 | 927 | 334 |
| Nonmetallic Mineral Product Manufacturing | 37 | 19 | 10 | 7 | 2 | 18 | 1428 | 1,329 | 660 | 407 | 230 | 23 | 669 | 611 |
| 32-Manufacturing | 139 | 55 | 28 | 23 | 4 | 84 | 7297 | 6,692 | 3,147 | 1,687 | 1,391 | 69 | 3,545 | 2447 |
| Primary Metal Manufacturing | 27 | 14 | 11 | 2 | 1 | 13 | 3245 | 2,955 | 1,583 | 858 | 591 | 134 | 1,372 | 1492 |
| Fabricated Metal Product Manufacturing | 18 | 7 | 5 | 2 | 0 | 11 | 1138 | 1,065 | 547 | 188 | 353 | 6 | 518 | 579 |
| Machinery Manufacturing | 20 | 10 | 8 | 1 | 1 | 10 | 1156 | 1,118 | 622 | 195 | 422 | 5 | 496 | 816 |
| Computer and Electronic Product Manufacturing | 8 | 6 | 4 | 2 | 0 | 2 | 322 | 276 | 152 | 148 | 4 | 0 | 124 | 231 |
| Electrical Equipment, Appliance, and Component Manufacturing | 14 | 4 | 4 | 0 | 0 | 10 | 945 | 846 | 354 | 164 | 144 | 46 | 492 | 57 |
| Transportation Equipment Manufacturing | 51 | 22 | 15 | 6 | 1 | 29 | 5846 | 4,887 | 2,696 | 1,559 | 1,133 | 4 | 2,191 | 2735 |
| Furniture and Related Product Manufacturing | 2 | 1 | 1 | 0 | 0 | 1 | 74 | 68 | 20 | 4 | 0 | 16 | 48 | 6 |
| Miscellaneous Manufacturing | 28 | 11 | 5 | 4 | 2 | 17 | 2043 | 1,811 | 1,030 | 168 | 309 | 553 | 781 | 977 |
| 33-Manufacturing | 168 | 75 | 53 | 17 | 5 | 93 | 14769 | 13,026 | 7,004 | 3,284 | 2,956 | 764 | 6,022 | 6893 |
| Merchant Wholesalers, Durable Goods | 22 | 8 | 4 | 4 | 0 | 14 | 845 | 792 | 327 | 238 | 89 | 0 | 465 | 239 |
| Merchant Wholesalers, Nondurable Goods | 43 | 22 | 5 | 17 | 0 | 21 | 2488 | 2,245 | 1,087 | 384 | 703 | 0 | 1,158 | 1075 |
| Wholesale Electronic Markets and Agents and Brokers | 2 | 2 | 1 | 1 | 0 | 0 | 9 | 9 | 7 | 5 | 2 | 0 | 2 | 9 |
| Wholesale Trade | 67 | 32 | 10 | 22 | 0 | 35 | 3342 | 3,046 | 1,421 | 627 | 794 | 0 | 1,625 | 1323 |
| Motor Vehicle and Parts Dealers | 26 | 9 | 8 | 1 | 0 | 17 | 399 | 323 | 141 | 94 | 46 | 1 | 182 | 165 |
| Furniture and Home Furnishings Stores | 3 | 1 | 0 | 1 | 0 | 2 | 354 | 251 | 152 | 0 | 152 | 0 | 99 | 293 |
| Electronics and Appliance Stores | 1 | 1 | 0 | 1 | 0 | 0 | 8 | 8 | 5 | 0 | 5 | 0 | 3 | 8 |
| Industrial Group | Total elections | Number of elections in which representation rights were won by unions | Number of elections in which representation rights were won by unions | Number of elections in which representation rights were won by unions | Number of elections in which representation rights were won by unions | Number of elections in which no representative was chosen | Number of employees eligible to vote | Total valid votes cast | Valid votes cast for unions | Valid votes cast for unions | Valid votes cast for unions | Valid votes cast for unions | Total votes for no union | Eligible employees in units choosing representation |
| Building Material and Garden Equipment and Supplies Dealers | 8 | 3 | 1 | 1 | 1 | 5 | 916 | 838 | 365 | 4 | 336 | 25 | 473 | 37 |
| Food and Beverage Stores | 30 | 17 | 3 | 14 | 0 | 13 | 1064 | 870 | 370 | 15 | 355 | 0 | 500 | 296 |
| Health and Personal Care Stores | 12 | 4 | 1 | 3 | 0 | 8 | 277 | 254 | 117 | 33 | 84 | 0 | 137 | 81 |
| Gasoline Stations | 2 | 1 | 0 | 1 | 0 | 1 | 29 | 25 | 11 | 0 | 11 | 0 | 14 | 7 |
| 44-Retail Trade | 82 | 36 | 13 | 22 | 1 | 46 | 3047 | 2,569 | 1,161 | 146 | 989 | 26 | 1,408 | 887 |
| General Merchandise Stores | 5 | 4 | 0 | 4 | 0 | 1 | 416 | 375 | 292 | 0 | 240 | 52 | 83 | 360 |
| Miscellaneous Store Retailers | 4 | 1 | 1 | 0 | 0 | 3 | 272 | 250 | 67 | 2 | 65 | 0 | 183 | 3 |
| Nonstore Retailers | 3 | 0 | 0 | 0 | 0 | 3 | 115 | 110 | 37 | 0 | 37 | 0 | 73 | 0 |
| 45-Retail Trade | 12 | 5 | 1 | 4 | 0 | 7 | 803 | 735 | 396 | 2 | 342 | 52 | 339 | 363 |
| Air Transportation | 21 | 16 | 10 | 5 | 1 | 5 | 993 | 843 | 493 | 440 | 47 | 6 | 350 | 929 |
| Rail Transportation | 1 | 1 | 0 | 1 | 0 | 0 | 46 | 41 | 24 | 0 | 24 | 0 | 17 | 46 |
| Water Transportation | 5 | 1 | 0 | 0 | 1 | 4 | 73 | 60 | 21 | 9 | 2 | 10 | 39 | 0 |
| Truck Transportation | 73 | 31 | 8 | 23 | 0 | 42 | 2070 | 1,723 | 817 | 169 | 648 | 0 | 906 | 844 |
| Transit and Ground Passenger Transportation | 102 | 67 | 16 | 48 | 3 | 35 | 10187 | 8,195 | 5,563 | 1,412 | 3,937 | 214 | 2,632 | 6953 |
| Pipeline Transportation | 5 | 3 | 3 | 0 | 0 | 2 | 299 | 287 | 102 | 102 | 0 | 0 | 185 | 24 |
| Scenic and Sightseeing Transportation | 2 | 2 | 0 | 1 | 1 | 0 | 182 | 108 | 62 | 0 | 38 | 24 | 46 | 182 |
| Support Activities for Transportation | 43 | 24 | 17 | 6 | 1 | 19 | 1742 | 1,551 | 669 | 466 | 186 | 17 | 882 | 522 |
| 48-Transportation and Warehousing | 252 | 145 | 54 | 84 | 7 | 107 | 15592 | 12,808 | 7,751 | 2,598 | 4,882 | 271 | 5,057 | 9500 |
| Couriers and Messengers | 16 | 7 | 0 | 7 | 0 | 9 | 545 | 512 | 252 | 10 | 205 | 37 | 260 | 294 |
| Warehousing and Storage | 54 | 21 | 2 | 18 | 1 | 33 | 3479 | 3,029 | 1,404 | 104 | 1,272 | 28 | 1,625 | 1473 |
| 49-Transportation and Warehousing | 70 | 28 | 2 | 25 | 1 | 42 | 4024 | 3,541 | 1,656 | 114 | 1,477 | 65 | 1,885 | 1767 |
| Publishing Industries (except Internet) | 10 | 5 | 0 | 4 | 1 | 5 | 762 | 671 | 482 | 99 | 349 | 34 | 189 | 661 |
| Motion Picture and Sound Recording Industries | 3 | 1 | 1 | 0 | 0 | 2 | 41 | 35 | 17 | 17 | 0 | 0 | 18 | 10 |
| Broadcasting (except Internet) | 15 | 4 | 3 | 0 | 1 | 11 | 664 | 594 | 242 | 212 | 0 | 30 | 352 | 147 |
| Telecommunications | 18 | 9 | 9 | 0 | 0 | 9 | 611 | 616 | 333 | 333 | 0 | 0 | 283 | 231 |
| Industrial Group | Total elections | Number of elections in which representation rights were won by unions | Number of elections in which representation rights were won by unions | Number of elections in which representation rights were won by unions | Number of elections in which representation rights were won by unions | Number of elections in which no representative was chosen | Number of employees eligible to vote | Total valid votes cast | Valid votes cast for unions | Valid votes cast for unions | Valid votes cast for unions | Valid votes cast for unions | Total votes for no union | Eligible employees in units choosing representation |
| Data Processing, Hosting, and Related Services | 1 | 1 | 1 | 0 | 0 | 0 | 9 | 7 | 7 | 7 | 0 | 0 | 0 | 9 |
| Other Information Services | 4 | 2 | 0 | 1 | 1 | 2 | 211 | 169 | 89 | 21 | 47 | 21 | 80 | 58 |
| Information | 51 | 22 | 14 | 5 | 3 | 29 | 2298 | 2,092 | 1,170 | 689 | 396 | 85 | 922 | 1116 |
| Credit Intermediation and Related Activities | 9 | 6 | 5 | 1 | 0 | 3 | 185 | 174 | 101 | 74 | 13 | 14 | 73 | 133 |
| Securities, Commodity Contracts, and Other Financial Investments and Related Activities | 1 | 0 | 0 | 0 | 0 | 1 | 29 | 28 | 2 | 2 | 0 | 0 | 26 | 0 |
| Insurance Carriers and Related Activities | 1 | 0 | 0 | 0 | 0 | 1 | 8 | 8 | 4 | 4 | 0 | 0 | 4 | 0 |
| Finance and Insurance | 11 | 6 | 5 | 1 | 0 | 5 | 222 | 210 | 107 | 80 | 13 | 14 | 103 | 133 |
| Real Estate | 19 | 12 | 3 | 9 | 0 | 7 | 250 | 202 | 155 | 12 | 142 | 1 | 47 | 214 |
| Rental and Leasing Services | 18 | 10 | 8 | 2 | 0 | 8 | 253 | 237 | 114 | 46 | 65 | 3 | 123 | 89 |
| Real Estate and Rental and Leasing | 37 | 22 | 11 | 11 | 0 | 15 | 503 | 439 | 269 | 58 | 207 | 4 | 170 | 303 |
| Professional, Scientific, and Technical Services | 24 | 12 | 9 | 3 | 0 | 12 | 1559 | 936 | 500 | 385 | 84 | 31 | 436 | 399 |
| Management of Companies and Enterprises | 2 | 2 | 2 | 0 | 0 | 0 | 286 | 94 | 66 | 66 | 0 | 0 | 28 | 286 |
| Administrative and Support Services | 119 | 88 | 25 | 53 | 10 | 31 | 10213 | 4,358 | 3,258 | 651 | 1,991 | 616 | 1,100 | 9060 |
| Waste Management and Remediation Services | 51 | 19 | 6 | 12 | 1 | 32 | 1929 | 1,605 | 740 | 210 | 509 | 21 | 865 | 880 |
| Administrative and Support and Waste Management and Remediation Services | 170 | 107 | 31 | 65 | 11 | 63 | 12142 | 5,963 | 3,998 | 861 | 2,500 | 637 | 1,965 | 9940 |
| Educational Services | 27 | 19 | 10 | 6 | 3 | 8 | 1212 | 1,048 | 696 | 360 | 212 | 124 | 352 | 890 |
| Ambulatory Health Care Services | 43 | 25 | 6 | 15 | 4 | 18 | 3508 | 2,334 | 1,598 | 100 | 980 | 518 | 736 | 2860 |
| Hospitals | 118 | 82 | 17 | 57 | 8 | 36 | 18233 | 13,886 | 7,726 | 1,505 | 5,605 | 616 | 6,160 | 12593 |
| Nursing and Residential Care Facilities | 129 | 89 | 21 | 67 | 1 | 40 | 10991 | 7,991 | 4,784 | 1,321 | 3,431 | 32 | 3,207 | 8547 |
| Social Assistance | 38 | 25 | 11 | 11 | 3 | 13 | 2021 | 1,505 | 900 | 412 | 353 | 135 | 605 | 1227 |
| Industrial Group | Total elections | Number of elections in which representation rights were won by unions | Number of elections in which representation rights were won by unions | Number of elections in which representation rights were won by unions | Number of elections in which representation rights were won by unions | Number of elections in which no representative was chosen | Number of employees eligible to vote | Total valid votes cast | Valid votes cast for unions | Valid votes cast for unions | Valid votes cast for unions | Valid votes cast for unions | Total votes for no union | Eligible employees in units choosing representation |
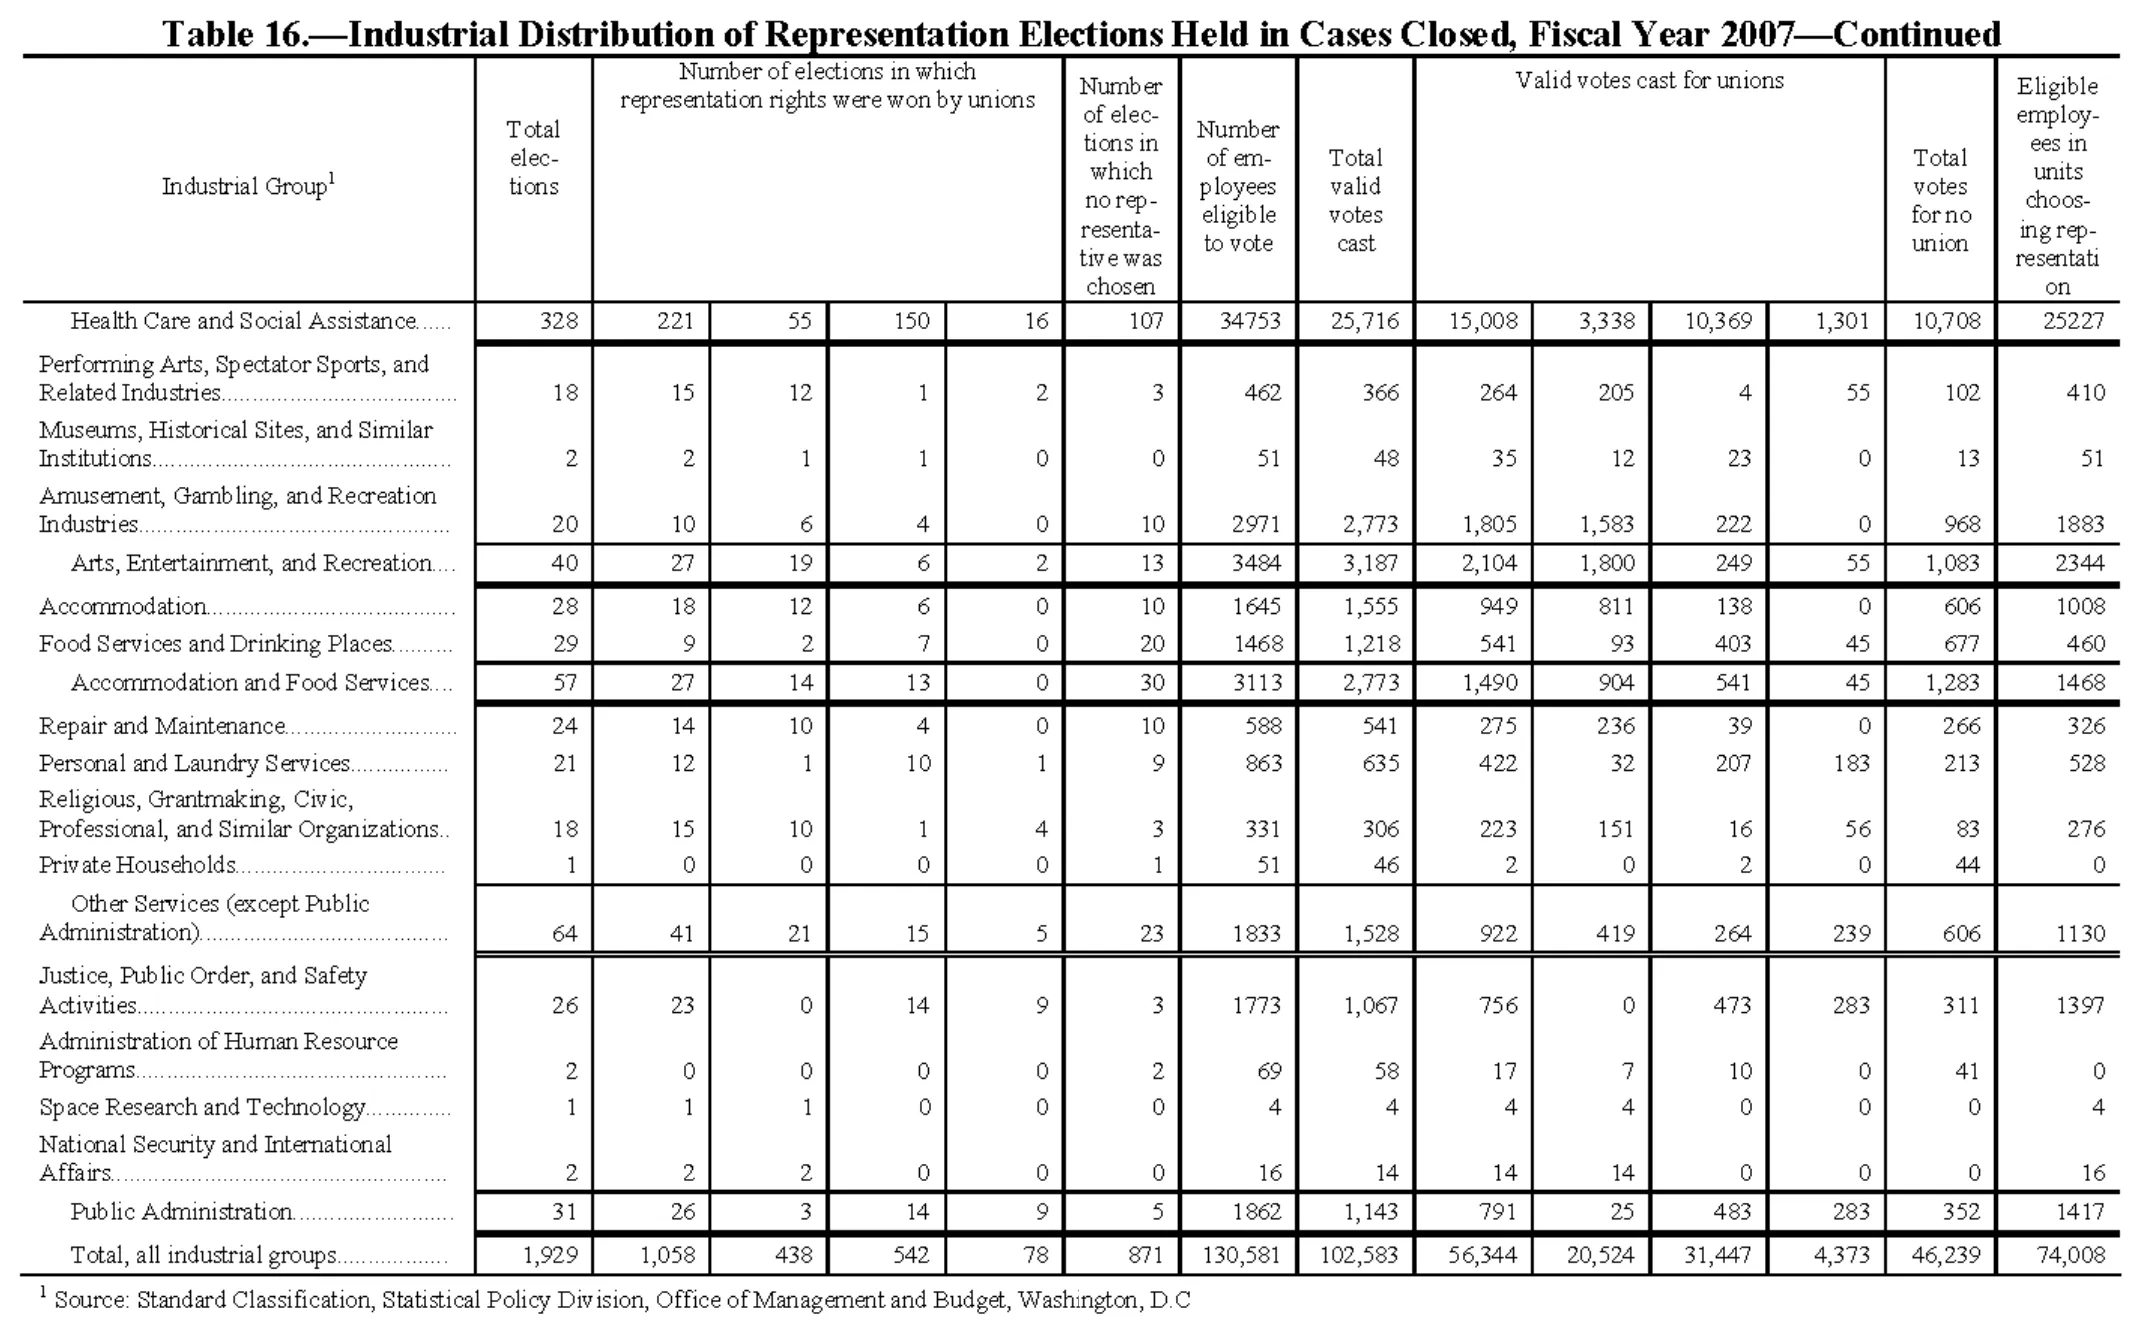
| Health Care and Social Assistance | 328 | 221 | 55 | 150 | 16 | 107 | 34753 | 25,716 | 15,008 | 3,338 | 10,369 | 1,301 | 10,708 | 25227 |
| Performing Arts, Spectator Sports, and Related Industries | 18 | 15 | 12 | 1 | 2 | 3 | 462 | 366 | 264 | 205 | 4 | 55 | 102 | 410 |
| Museums, Historical Sites, and Similar Institutions | 2 | 2 | 1 | 1 | 0 | 0 | 51 | 48 | 35 | 12 | 23 | 0 | 13 | 51 |
| Amusement, Gambling, and Recreation Industries | 20 | 10 | 6 | 4 | 0 | 10 | 2971 | 2,773 | 1,805 | 1,583 | 222 | 0 | 968 | 1883 |
| Arts, Entertainment, and Recreation | 40 | 27 | 19 | 6 | 2 | 13 | 3484 | 3,187 | 2,104 | 1,800 | 249 | 55 | 1,083 | 2344 |
| Accommodation | 28 | 18 | 12 | 6 | 0 | 10 | 1645 | 1,555 | 949 | 811 | 138 | 0 | 606 | 1008 |
| Food Services and Drinking Places | 29 | 9 | 2 | 7 | 0 | 20 | 1468 | 1,218 | 541 | 93 | 403 | 45 | 677 | 460 |
| Accommodation and Food Services | 57 | 27 | 14 | 13 | 0 | 30 | 3113 | 2,773 | 1,490 | 904 | 541 | 45 | 1,283 | 1468 |
| Repair and Maintenance | 24 | 14 | 10 | 4 | 0 | 10 | 588 | 541 | 275 | 236 | 39 | 0 | 266 | 326 |
| Personal and Laundry Services | 21 | 12 | 1 | 10 | 1 | 9 | 863 | 635 | 422 | 32 | 207 | 183 | 213 | 528 |
| Religious, Grantmaking, Civic, Professional, and Similar Organizations | 18 | 15 | 10 | 1 | 4 | 3 | 331 | 306 | 223 | 151 | 16 | 56 | 83 | 276 |
| Private Households | 1 | 0 | 0 | 0 | 0 | 1 | 51 | 46 | 2 | 0 | 2 | 0 | 44 | 0 |
| Other Services (except Public Administration) | 64 | 41 | 21 | 15 | 5 | 23 | 1833 | 1,528 | 922 | 419 | 264 | 239 | 606 | 1130 |
| Justice, Public Order, and Safety Activities | 26 | 23 | 0 | 14 | 9 | 3 | 1773 | 1,067 | 756 | 0 | 473 | 283 | 311 | 1397 |
| Administration of Human Resource Programs | 2 | 0 | 0 | 0 | 0 | 2 | 69 | 58 | 17 | 7 | 10 | 0 | 41 | 0 |
| Space Research and Technology | 1 | 1 | 1 | 0 | 0 | 0 | 4 | 4 | 4 | 4 | 0 | 0 | 0 | 4 |
| National Security and International Affairs | 2 | 2 | 2 | 0 | 0 | 0 | 16 | 14 | 14 | 14 | 0 | 0 | 0 | 16 |
| Public Administration | 31 | 26 | 3 | 14 | 9 | 5 | 1862 | 1,143 | 791 | 25 | 483 | 283 | 352 | 1417 |
| Total, all industrial groups | 1,929 | 1,058 | 438 | 542 | 78 | 871 | 130,581 | 102,583 | 56,344 | 20,524 | 31,447 | 4,373 | 46,239 | 74,008 |
- 1 Source: Standard Classification, Statistical Policy Division, Office of Management and Budget, Washington, D.C
1,262 of 1,272 figures sit in a row or column sum that works out.
Reader’s notes
p. 173. The table has 15 columns: stub, "Total elections", four columns under "Number of elections in which representation rights were won by unions", "Number of elections in which no representative was chosen", "Number of employees eligible to vote", "Total valid votes cast", four columns under "Valid votes cast for unions", "Total votes for no union", and "Eligible employees in units choosing representation". The crop cuts the table off after "Printing and Related Support Activities"; the table continues on the next page (no subtotal row for the 32-/33-Manufacturing groups and no closing rules are visible). The stub heading carries a superscript footnote marker 1 ("Industrial Group^1"), but no footnote text is printed within this crop, so `footnotes` is empty; the note presumably appears at the end of the continued table. Indented rows that are section subtotals as printed: "Agriculture, Forestry, Fishing, and Hunting", "Mining, Quarrying, and Oil and Gas Extraction", "Utilities", "Construction", and "31-Manufacturing" (set off by heavy rules). "31-Manufacturing" is transcribed exactly as printed, including the leading NAICS sector number. Digit-grouping commas are inconsistent in the original: the "Number of employees eligible to vote" and "Eligible employees in units choosing representation" columns print four- and five-digit values without commas (e.g. 2770, 4014, 5006, 7647, 10164, 1634, 2198, 1487, 1579, 3182), while the valid-votes columns use commas (e.g. 2,573, 8,707). Transcribed as printed, not normalized. No arithmetic was corrected; spot checks of the subtotal rows against their component rows were all internally consistent.
p. 174. Structure: 15 printed columns. The spanning heading "Number of elections in which representation rights were won by unions" covers columns 3-6 (col 3 is the group total, cols 4-6 its unlabeled breakdown), and "Valid votes cast for unions" covers columns 10-13 (col 10 the total, cols 11-13 the breakdown). On this page the sub-column headings under both spanning headings are NOT printed - the header boxes over columns 4-6 and 11-13 are blank (the labels appear only on the table's first page, which this crop continues), so only one heading level is given. The stub heading carries a raised 1 ("Industrial Group^1"); the referenced footnote is not printed on this crop, so `footnotes` is empty. Arithmetic checks pass on every row: cols 4+5+6 = col 3, col 3 + col 7 = col 2, cols 11+12+13 = col 10, and col 10 + col 14 = col 9. The "32-Manufacturing" subtotal (139 elections) exceeds the sum of the four rows shown above it (105) because that sector's earlier industry groups are printed on the preceding page, before this crop begins. Formatting as printed: the "Number of employees eligible to vote" column and the final "Eligible employees in units choosing representation" column carry no digit-grouping commas (e.g. 1710, 14769, 2447, 6893), while "Total valid votes cast", "Valid votes cast for unions" and "Total votes for no union" do (e.g. 1,529, 13,026). This inconsistency is in the original and is transcribed as printed. The crop is cut off at the bottom: the table continues past the last transcribed row ("Electronics and Appliance Stores") onto the next page. The caption and "-Continued" line were omitted per instructions. Two header labels were de-hyphenated when joined: "no rep-resenta-tive" -> "no representative" and "rep-resentati on" -> "representation".
p. 175. 15 columns. The two group headings each span four ruled columns ("Number of elections in which representation rights were won by unions" over columns 2-5; "Valid votes cast for unions" over columns 9-12). On this continuation page the sub-column headings under those two groups are NOT printed (the space below the group heading is blank down to the body rule), so only one heading level exists here and the group heading is repeated across each of its four columns. Column positions were confirmed arithmetically: in both groups the first sub-column is the group total and the next three sum to it (e.g. 4+336+25=365), and total valid votes cast = union total + total votes for no union in every row; the 44-, 45-, 48- and 49- summary lines also reconcile with their component rows. The footnote marker 1 on "Industrial Group" refers to a footnote not printed on this crop; no footnotes appear below the table because the table continues past the bottom of the page (the crop ends mid-section after "Telecommunications", before that section's summary line). Possible printing anomaly, transcribed as printed: in the "Telecommunications" row the number of employees eligible to vote (611) is smaller than total valid votes cast (616). The 616 is internally consistent (333 + 283 = 616), so the 611 is the doubtful figure; both are reproduced exactly as printed. Heavy horizontal rules separate the industry sections (after the 44-, 45-, 48- and 49- summary lines); these section rules carry no text and are not transcribed as rows.
p. 176. 15 columns. The two spanning headings ("Number of elections in which representation rights were won by unions" and "Valid votes cast for unions") each cover four ruled columns, but the sub-column captions are blank on this page — the heading box shows only the spanning line above empty space, so no second heading level is transcribed. Arithmetic within each row is consistent with that structure: the first column of each span is a total equal to the sum of the three columns to its right (e.g. "Other Information Services": 2 = 0+1+1 and 89 = 21+47+21), total elections = elections won + elections with no representative, and total valid votes cast = union votes + votes for no union. All 20 rows satisfy these identities, and the three summary rows (Information; Finance and Insurance; Real Estate and Rental and Leasing; Administrative and Support and Waste Management and Remediation Services) agree with their component rows where those components appear on this page. The stub heading carries footnote marker 1 ("Industrial Group^1"), but no footnote text is printed on this crop; it appears on another page of the table. The "Number of employees eligible to vote" and "Eligible employees in units choosing representation" columns are printed without digit-grouping commas (e.g. 2298, 10213, 12142, 18233, 12593), while the valid-votes columns use commas; this is as printed, not a transcription slip. This is a continuation page: the table starts before this crop (the first rows shown are the tail of the Information sector) and continues past the bottom (the Health Care and Social Assistance group total is not on this page). Summary/total rows are printed indented in the stub; the indentation is not reproduced in the labels.
p. 177. Grid is 15 columns: stub + 14 numeric columns. Header structure: the two wide spanning headings ("Number of elections in which representation rights were won by unions" and "Valid votes cast for unions") each cover four columns, but the sub-column headings below them are blank on this page — the heading band under each span is empty white space. Those sub-headings (presumably a total column plus union-type breakdowns) are printed only on the first page of this table, which this crop continues. Per instruction I did not reconstruct them, so only one printed heading level is returned, with each spanning heading repeated across its four columns. Column assignment was cross-checked arithmetically and is consistent on every row: in both four-column blocks the first column equals the sum of the following three (e.g. Health Care 221 = 55+150+16 and 15,008 = 3,338+10,369+1,301; Total row 1,058 = 438+542+78 and 56,344 = 20,524+31,447+4,373). "Total elections" likewise equals the won-by-unions total plus the "no representative chosen" column on every row (e.g. 328 = 221+107; 1,929 = 1,058+871), and the last column sums correctly within each industry group (e.g. 1008+460 = 1468; 1397+0+4+16 = 1417). Typesetting inconsistency, transcribed as printed: the "Number of employees eligible to vote" column and the final "Eligible employees in units choosing representation" column omit digit-grouping commas on four- and five-digit values (34753, 2971, 3484, 1645, 1468, 3113, 1833, 1773, 1862; 25227, 1883, 2344, 1008, 1130, 1397, 1417), while the same magnitudes carry commas in the neighbouring columns. The Total row uses commas in both (130,581 and 74,008). The three indented rows "Arts, Entertainment, and Recreation", "Accommodation and Food Services", "Other Services (except Public Administration)" and "Public Administration" are group subtotals (set off by heavy rules); they are transcribed as ordinary rows since the grid has no level field. The last heading's final word is broken across lines as "rep- resentati on" and is joined to "representation". The footnote text ends "Washington, D.C" with no period after the final C, as printed. No cells were illegible.
Source image
Source data: U.S. NLRB Annual Reports (public domain). Reconstruction by NLRB Stats Archive. Read by claude-opus-5 (effort max, prompt extract_v1) from the 300-dpi scan; stitched by page. Updated October 2026.