NLRB Stats Archive › Annual Reports › FY2007 › Standard Federal Administrative Regional Distribution of Cases Received, Fiscal Year 2007
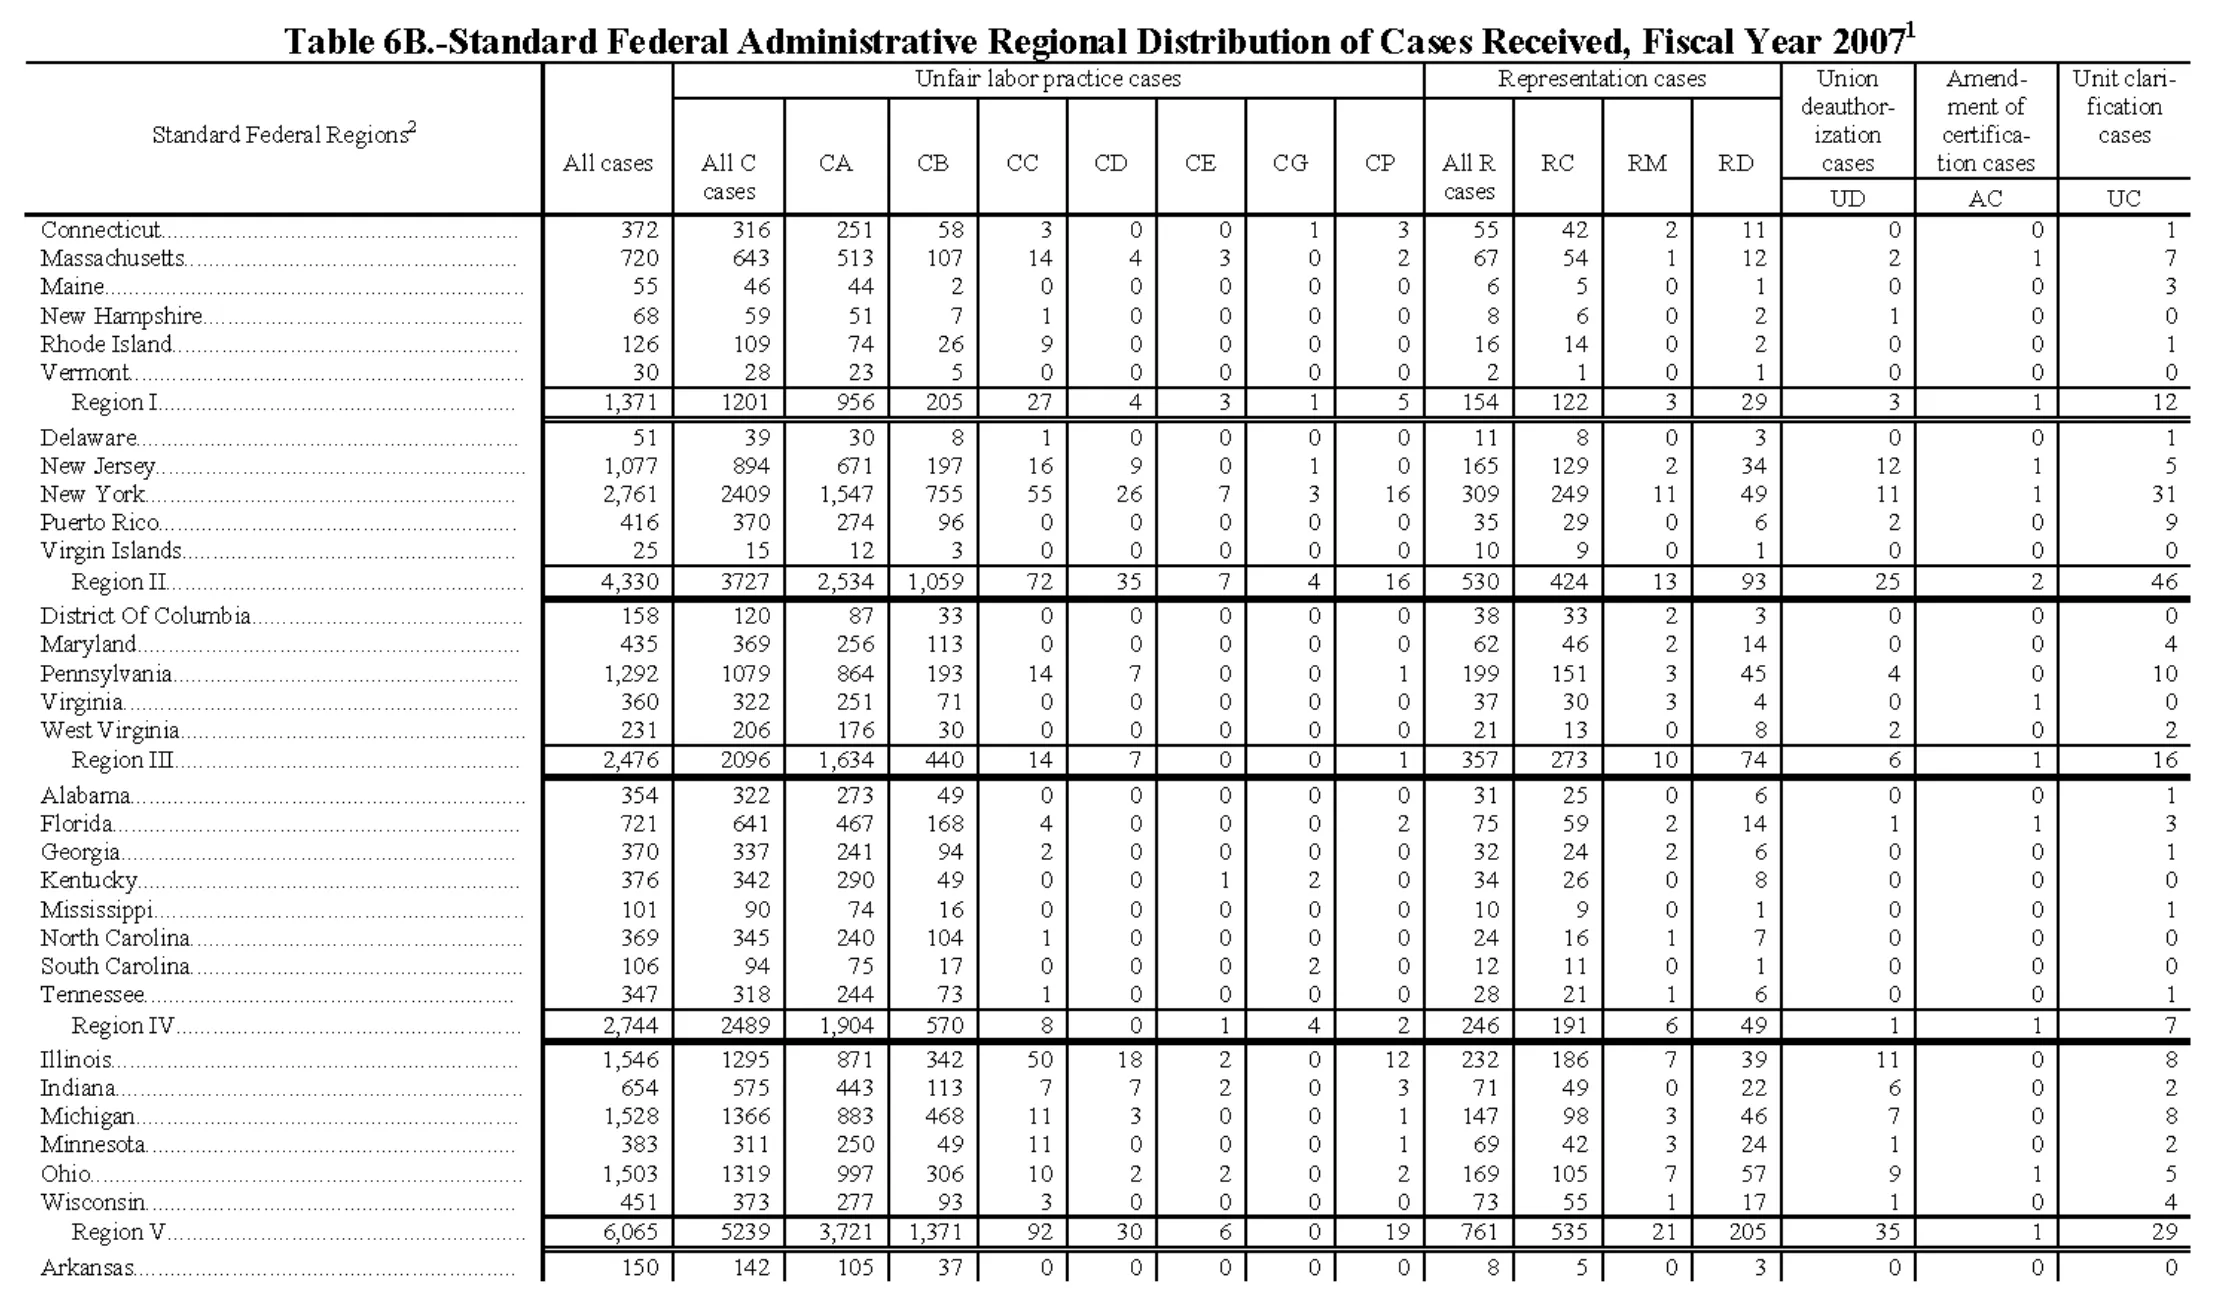
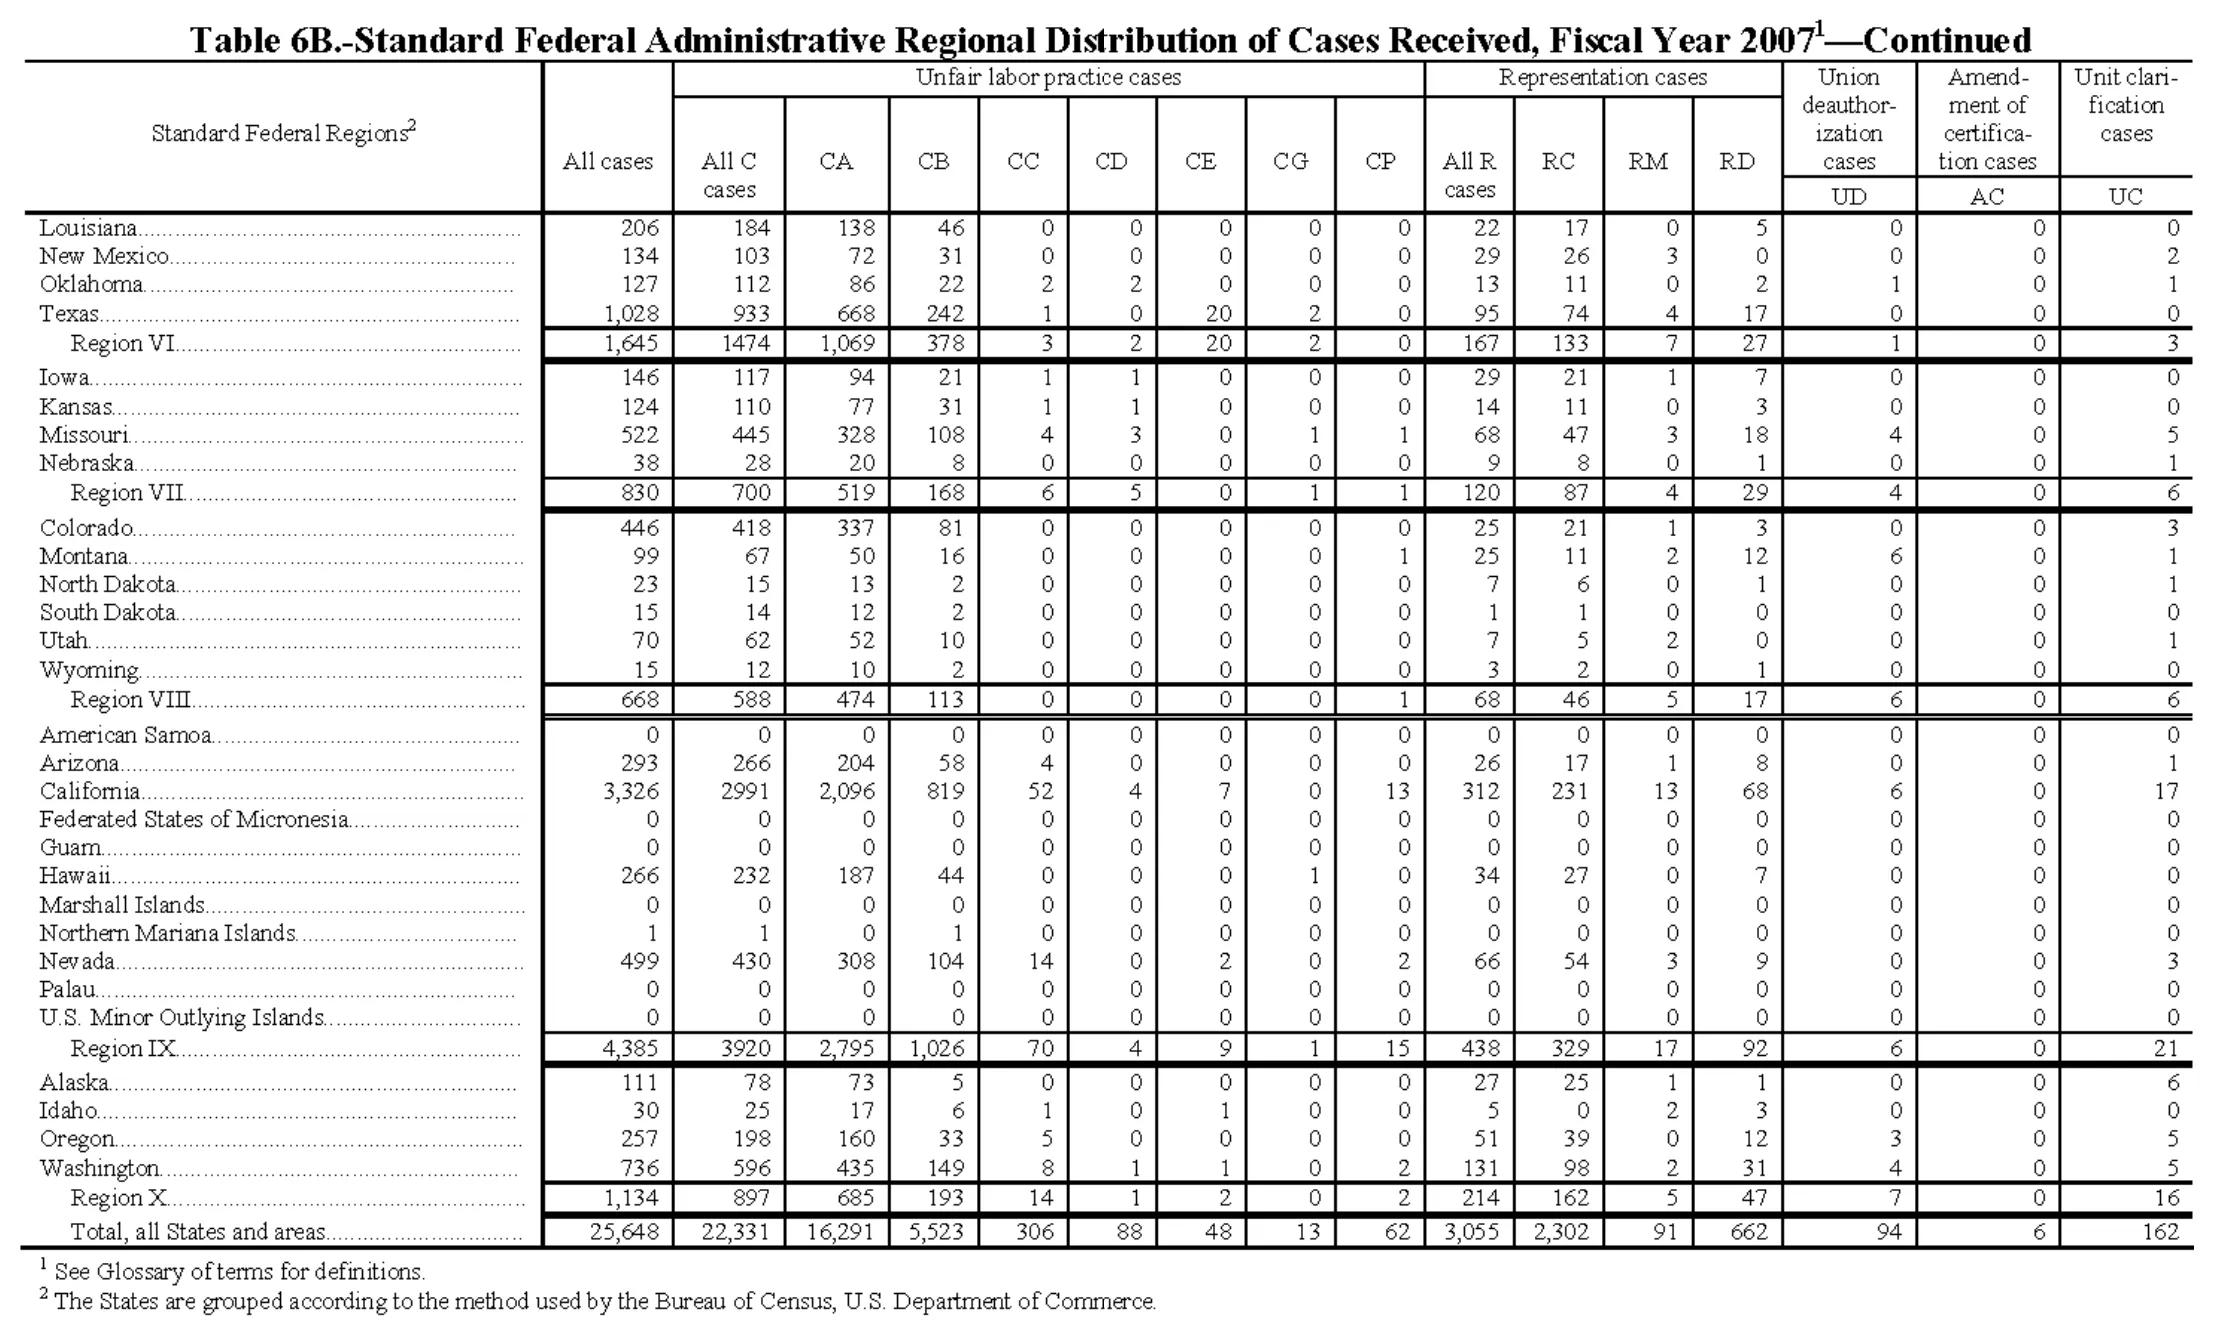
Standard Federal Administrative Regional Distribution of Cases Received, Fiscal Year 2007
Stitched from pp. 142–143.
| Standard Federal Regions | All cases | Unfair labor practice cases | Representation cases | Union deauthorization cases | Amendment of certification cases | Unit clarification cases | ||||||||||
|---|---|---|---|---|---|---|---|---|---|---|---|---|---|---|---|---|
| Standard Federal Regions | All cases | All C cases | CA | CB | CC | CD | CE | CG | CP | All R cases | RC | RM | RD | Union deauthorization cases | Amendment of certification cases | Unit clarification cases |
| Standard Federal Regions | All cases | All C cases | CA | CB | CC | CD | CE | CG | CP | All R cases | RC | RM | RD | UD | AC | UC |
| Connecticut | 372 | 316 | 251 | 58 | 3 | 0 | 0 | 1 | 3 | 55 | 42 | 2 | 11 | 0 | 0 | 1 |
| Massachusetts | 720 | 643 | 513 | 107 | 14 | 4 | 3 | 0 | 2 | 67 | 54 | 1 | 12 | 2 | 1 | 7 |
| Maine | 55 | 46 | 44 | 2 | 0 | 0 | 0 | 0 | 0 | 6 | 5 | 0 | 1 | 0 | 0 | 3 |
| New Hampshire | 68 | 59 | 51 | 7 | 1 | 0 | 0 | 0 | 0 | 8 | 6 | 0 | 2 | 1 | 0 | 0 |
| Rhode Island | 126 | 109 | 74 | 26 | 9 | 0 | 0 | 0 | 0 | 16 | 14 | 0 | 2 | 0 | 0 | 1 |
| Vermont | 30 | 28 | 23 | 5 | 0 | 0 | 0 | 0 | 0 | 2 | 1 | 0 | 1 | 0 | 0 | 0 |
| Region I | 1,371 | 1201 | 956 | 205 | 27 | 4 | 3 | 1 | 5 | 154 | 122 | 3 | 29 | 3 | 1 | 12 |
| Delaware | 51 | 39 | 30 | 8 | 1 | 0 | 0 | 0 | 0 | 11 | 8 | 0 | 3 | 0 | 0 | 1 |
| New Jersey | 1,077 | 894 | 671 | 197 | 16 | 9 | 0 | 1 | 0 | 165 | 129 | 2 | 34 | 12 | 1 | 5 |
| New York | 2,761 | 2409 | 1,547 | 755 | 55 | 26 | 7 | 3 | 16 | 309 | 249 | 11 | 49 | 11 | 1 | 31 |
| Puerto Rico | 416 | 370 | 274 | 96 | 0 | 0 | 0 | 0 | 0 | 35 | 29 | 0 | 6 | 2 | 0 | 9 |
| Virgin Islands | 25 | 15 | 12 | 3 | 0 | 0 | 0 | 0 | 0 | 10 | 9 | 0 | 1 | 0 | 0 | 0 |
| Region II | 4,330 | 3727 | 2,534 | 1,059 | 72 | 35 | 7 | 4 | 16 | 530 | 424 | 13 | 93 | 25 | 2 | 46 |
| District Of Columbia | 158 | 120 | 87 | 33 | 0 | 0 | 0 | 0 | 0 | 38 | 33 | 2 | 3 | 0 | 0 | 0 |
| Maryland | 435 | 369 | 256 | 113 | 0 | 0 | 0 | 0 | 0 | 62 | 46 | 2 | 14 | 0 | 0 | 4 |
| Pennsylvania | 1,292 | 1079 | 864 | 193 | 14 | 7 | 0 | 0 | 1 | 199 | 151 | 3 | 45 | 4 | 0 | 10 |
| Virginia | 360 | 322 | 251 | 71 | 0 | 0 | 0 | 0 | 0 | 37 | 30 | 3 | 4 | 0 | 1 | 0 |
| West Virginia | 231 | 206 | 176 | 30 | 0 | 0 | 0 | 0 | 0 | 21 | 13 | 0 | 8 | 2 | 0 | 2 |
| Region III | 2,476 | 2096 | 1,634 | 440 | 14 | 7 | 0 | 0 | 1 | 357 | 273 | 10 | 74 | 6 | 1 | 16 |
| Alabama | 354 | 322 | 273 | 49 | 0 | 0 | 0 | 0 | 0 | 31 | 25 | 0 | 6 | 0 | 0 | 1 |
| Florida | 721 | 641 | 467 | 168 | 4 | 0 | 0 | 0 | 2 | 75 | 59 | 2 | 14 | 1 | 1 | 3 |
| Georgia | 370 | 337 | 241 | 94 | 2 | 0 | 0 | 0 | 0 | 32 | 24 | 2 | 6 | 0 | 0 | 1 |
| Kentucky | 376 | 342 | 290 | 49 | 0 | 0 | 1 | 2 | 0 | 34 | 26 | 0 | 8 | 0 | 0 | 0 |
| Mississippi | 101 | 90 | 74 | 16 | 0 | 0 | 0 | 0 | 0 | 10 | 9 | 0 | 1 | 0 | 0 | 1 |
| North Carolina | 369 | 345 | 240 | 104 | 1 | 0 | 0 | 0 | 0 | 24 | 16 | 1 | 7 | 0 | 0 | 0 |
| South Carolina | 106 | 94 | 75 | 17 | 0 | 0 | 0 | 2 | 0 | 12 | 11 | 0 | 1 | 0 | 0 | 0 |
| Tennessee | 347 | 318 | 244 | 73 | 1 | 0 | 0 | 0 | 0 | 28 | 21 | 1 | 6 | 0 | 0 | 1 |
| Region IV | 2,744 | 2489 | 1,904 | 570 | 8 | 0 | 1 | 4 | 2 | 246 | 191 | 6 | 49 | 1 | 1 | 7 |
| Illinois | 1,546 | 1295 | 871 | 342 | 50 | 18 | 2 | 0 | 12 | 232 | 186 | 7 | 39 | 11 | 0 | 8 |
| Indiana | 654 | 575 | 443 | 113 | 7 | 7 | 2 | 0 | 3 | 71 | 49 | 0 | 22 | 6 | 0 | 2 |
| Michigan | 1,528 | 1366 | 883 | 468 | 11 | 3 | 0 | 0 | 1 | 147 | 98 | 3 | 46 | 7 | 0 | 8 |
| Minnesota | 383 | 311 | 250 | 49 | 11 | 0 | 0 | 0 | 1 | 69 | 42 | 3 | 24 | 1 | 0 | 2 |
| Ohio | 1,503 | 1319 | 997 | 306 | 10 | 2 | 2 | 0 | 2 | 169 | 105 | 7 | 57 | 9 | 1 | 5 |
| Wisconsin | 451 | 373 | 277 | 93 | 3 | 0 | 0 | 0 | 0 | 73 | 55 | 1 | 17 | 1 | 0 | 4 |
| Region V | 6,065 | 5239 | 3,721 | 1,371 | 92 | 30 | 6 | 0 | 19 | 761 | 535 | 21 | 205 | 35 | 1 | 29 |
| Arkansas | 150 | 142 | 105 | 37 | 0 | 0 | 0 | 0 | 0 | 8 | 5 | 0 | 3 | 0 | 0 | 0 |
| Louisiana | 206 | 184 | 138 | 46 | 0 | 0 | 0 | 0 | 0 | 22 | 17 | 0 | 5 | 0 | 0 | 0 |
| New Mexico | 134 | 103 | 72 | 31 | 0 | 0 | 0 | 0 | 0 | 29 | 26 | 3 | 0 | 0 | 0 | 2 |
| Oklahoma | 127 | 112 | 86 | 22 | 2 | 2 | 0 | 0 | 0 | 13 | 11 | 0 | 2 | 1 | 0 | 1 |
| Texas | 1,028 | 933 | 668 | 242 | 1 | 0 | 20 | 2 | 0 | 95 | 74 | 4 | 17 | 0 | 0 | 0 |
| Region VI | 1,645 | 1474 | 1,069 | 378 | 3 | 2 | 20 | 2 | 0 | 167 | 133 | 7 | 27 | 1 | 0 | 3 |
| Iowa | 146 | 117 | 94 | 21 | 1 | 1 | 0 | 0 | 0 | 29 | 21 | 1 | 7 | 0 | 0 | 0 |
| Kansas | 124 | 110 | 77 | 31 | 1 | 1 | 0 | 0 | 0 | 14 | 11 | 0 | 3 | 0 | 0 | 0 |
| Missouri | 522 | 445 | 328 | 108 | 4 | 3 | 0 | 1 | 1 | 68 | 47 | 3 | 18 | 4 | 0 | 5 |
| Nebraska | 38 | 28 | 20 | 8 | 0 | 0 | 0 | 0 | 0 | 9 | 8 | 0 | 1 | 0 | 0 | 1 |
| Region VII | 830 | 700 | 519 | 168 | 6 | 5 | 0 | 1 | 1 | 120 | 87 | 4 | 29 | 4 | 0 | 6 |
| Colorado | 446 | 418 | 337 | 81 | 0 | 0 | 0 | 0 | 0 | 25 | 21 | 1 | 3 | 0 | 0 | 3 |
| Montana | 99 | 67 | 50 | 16 | 0 | 0 | 0 | 0 | 1 | 25 | 11 | 2 | 12 | 6 | 0 | 1 |
| North Dakota | 23 | 15 | 13 | 2 | 0 | 0 | 0 | 0 | 0 | 7 | 6 | 0 | 1 | 0 | 0 | 1 |
| South Dakota | 15 | 14 | 12 | 2 | 0 | 0 | 0 | 0 | 0 | 1 | 1 | 0 | 0 | 0 | 0 | 0 |
| Utah | 70 | 62 | 52 | 10 | 0 | 0 | 0 | 0 | 0 | 7 | 5 | 2 | 0 | 0 | 0 | 1 |
| Wyoming | 15 | 12 | 10 | 2 | 0 | 0 | 0 | 0 | 0 | 3 | 2 | 0 | 1 | 0 | 0 | 0 |
| Region VIII | 668 | 588 | 474 | 113 | 0 | 0 | 0 | 0 | 1 | 68 | 46 | 5 | 17 | 6 | 0 | 6 |
| American Samoa | 0 | 0 | 0 | 0 | 0 | 0 | 0 | 0 | 0 | 0 | 0 | 0 | 0 | 0 | 0 | 0 |
| Arizona | 293 | 266 | 204 | 58 | 4 | 0 | 0 | 0 | 0 | 26 | 17 | 1 | 8 | 0 | 0 | 1 |
| California | 3,326 | 2991 | 2,096 | 819 | 52 | 4 | 7 | 0 | 13 | 312 | 231 | 13 | 68 | 6 | 0 | 17 |
| Federated States of Micronesia | 0 | 0 | 0 | 0 | 0 | 0 | 0 | 0 | 0 | 0 | 0 | 0 | 0 | 0 | 0 | 0 |
| Guam | 0 | 0 | 0 | 0 | 0 | 0 | 0 | 0 | 0 | 0 | 0 | 0 | 0 | 0 | 0 | 0 |
| Hawaii | 266 | 232 | 187 | 44 | 0 | 0 | 0 | 1 | 0 | 34 | 27 | 0 | 7 | 0 | 0 | 0 |
| Marshall Islands | 0 | 0 | 0 | 0 | 0 | 0 | 0 | 0 | 0 | 0 | 0 | 0 | 0 | 0 | 0 | 0 |
| Northern Mariana Islands | 1 | 1 | 0 | 1 | 0 | 0 | 0 | 0 | 0 | 0 | 0 | 0 | 0 | 0 | 0 | 0 |
| Nevada | 499 | 430 | 308 | 104 | 14 | 0 | 2 | 0 | 2 | 66 | 54 | 3 | 9 | 0 | 0 | 3 |
| Palau | 0 | 0 | 0 | 0 | 0 | 0 | 0 | 0 | 0 | 0 | 0 | 0 | 0 | 0 | 0 | 0 |
| U.S. Minor Outlying Islands | 0 | 0 | 0 | 0 | 0 | 0 | 0 | 0 | 0 | 0 | 0 | 0 | 0 | 0 | 0 | 0 |
| Region IX | 4,385 | 3920 | 2,795 | 1,026 | 70 | 4 | 9 | 1 | 15 | 438 | 329 | 17 | 92 | 6 | 0 | 21 |
| Alaska | 111 | 78 | 73 | 5 | 0 | 0 | 0 | 0 | 0 | 27 | 25 | 1 | 1 | 0 | 0 | 6 |
| Idaho | 30 | 25 | 17 | 6 | 1 | 0 | 1 | 0 | 0 | 5 | 0 | 2 | 3 | 0 | 0 | 0 |
| Oregon | 257 | 198 | 160 | 33 | 5 | 0 | 0 | 0 | 0 | 51 | 39 | 0 | 12 | 3 | 0 | 5 |
| Washington | 736 | 596 | 435 | 149 | 8 | 1 | 1 | 0 | 2 | 131 | 98 | 2 | 31 | 4 | 0 | 5 |
| Region X | 1,134 | 897 | 685 | 193 | 14 | 1 | 2 | 0 | 2 | 214 | 162 | 5 | 47 | 7 | 0 | 16 |
| Total, all States and areas | 25,648 | 22,331 | 16,291 | 5,523 | 306 | 88 | 48 | 13 | 62 | 3,055 | 2,302 | 91 | 662 | 94 | 6 | 162 |
- 1 See Glossary of terms for definitions.
- 2 The States are grouped according to the method used by the Bureau of Census, U.S. Department of Commerce.
699 of 699 figures sit in a row or column sum that works out.
Reader’s notes
p. 142. The crop ends immediately after the "Arkansas" row (the first row of the Region VI block); the table continues beyond the bottom of the image, and no Region VI subtotal or any later region is visible. No footnote text is printed within the crop, although footnote marker 1 appears on the caption and marker 2 on the stub heading "Standard Federal Regions"; the footnote texts must be elsewhere on the page or on a following page. Column structure: 17 columns — stub, "All cases", then eight columns under "Unfair labor practice cases" (All C cases, CA, CB, CC, CD, CE, CG, CP), four under "Representation cases" (All R cases, RC, RM, RD), then the three tall single-column heads whose codes UD, AC and UC are printed on a third header level. Typesetting inconsistency (transcribed exactly as printed, not normalized): several four-digit values in the "All C cases" column are printed without a digit-grouping comma — 1201 (Region I), 2409 (New York), 3727 (Region II), 1079 (Pennsylvania), 2096 (Region III), 2489 (Region IV), 1295 (Illinois), 1366 (Michigan), 1319 (Ohio), 5239 (Region V) — while four-digit values elsewhere in the table (e.g. 1,371; 2,534; 1,059; 1,547; 1,634; 1,904; 3,721; 1,371) do carry commas. Every row and every region subtotal was checked arithmetically (C subcategories sum to All C cases, R subcategories to All R cases, and All C + All R + UD + AC + UC to All cases; state rows sum to their region row). All of them balance, which supports the column assignment of each figure. No cell was illegible.
p. 143. This is a "—Continued" page, so the table body begins mid-section: the Region VI block starts with Louisiana, and the state(s) alphabetically before it in that region (Arkansas) appear on the preceding page. Consequently the printed "Region VI" subtotal exceeds the sum of the four Region VI state rows shown here (e.g. All cases 1,645 vs. 206+134+127+1,028 = 1,495); the residual (150 all cases; 142 All C, 105 CA, 37 CB, 8 All R, 5 RC, 3 RD) is internally consistent with one missing state row on the prior page, so this is a crop effect and not a misprint. Column headings are printed on this page and are transcribed; "All cases" is a tall heading with no spanner above it, so it is repeated in all three heading levels, as is the stub heading. Typesetting detail, transcribed as printed: three subtotal figures in the "All C cases" column are set without a thousands comma — "1474" (Region VI), "2991" (California) and "3920" (Region IX) — while neighbouring four-digit figures in the same table do carry commas (e.g. 1,069; 2,096; 1,026). All other region subtotals and the grand total cross-foot exactly, both across columns (All C + All R + UD + AC + UC = All cases; CA...CP = All C; RC + RM + RD = All R) and down the state rows, which confirms the column assignment of every value, including those three. The AC (Amendment of certification) column reads 0 for every state and region shown on this page while the grand total is 6; the six cases fall in regions listed on the earlier page(s). No cell was illegible or doubtful.
Source image
Source data: U.S. NLRB Annual Reports (public domain). Reconstruction by NLRB Stats Archive. Read by claude-opus-5 (effort max, prompt extract_v1) from the 300-dpi scan; stitched by page. Updated October 2026.