NLRB Stats Archive › Annual Reports › FY2006 › Proceedings Decided by Circuit Courts of Appeals on Petitions for Enforcement and/or Review of Board Orders, Fiscal Year 2006, Compared With 5-Year Cumulative Totals, 2002 Through 2006
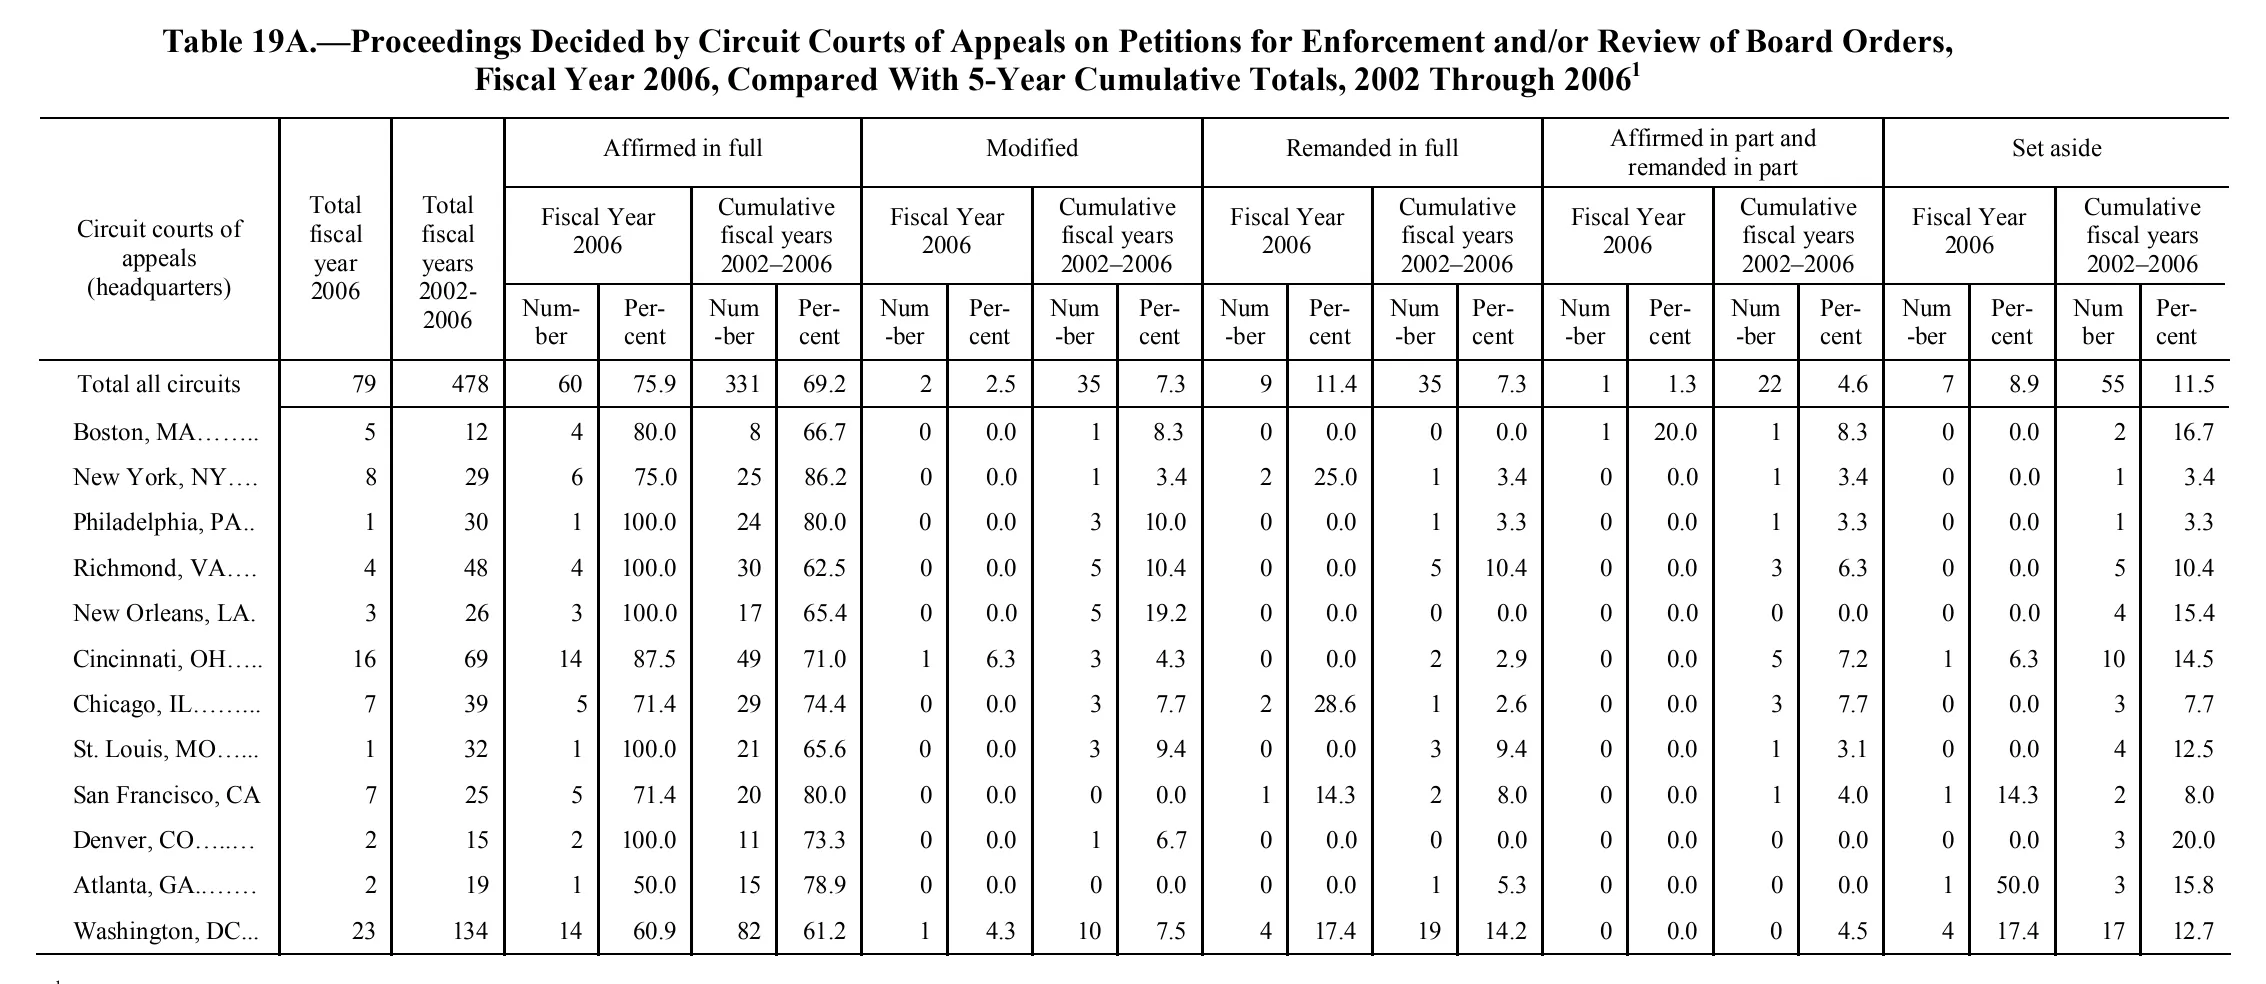
Proceedings Decided by Circuit Courts of Appeals on Petitions for Enforcement and/or Review of Board Orders, Fiscal Year 2006, Compared With 5-Year Cumulative Totals, 2002 Through 2006
| Circuit courts of appeals (headquarters) | Total fiscal year 2006 | Total fiscal years 2002-2006 | Affirmed in full | Modified | Remanded in full | Affirmed in part and remanded in part | Set aside | |||||||||||||||
|---|---|---|---|---|---|---|---|---|---|---|---|---|---|---|---|---|---|---|---|---|---|---|
| Circuit courts of appeals (headquarters) | Total fiscal year 2006 | Total fiscal years 2002-2006 | Fiscal Year 2006 | Cumulative fiscal years 2002–2006 | Fiscal Year 2006 | Cumulative fiscal years 2002–2006 | Fiscal Year 2006 | Cumulative fiscal years 2002–2006 | Fiscal Year 2006 | Cumulative fiscal years 2002–2006 | Fiscal Year 2006 | Cumulative fiscal years 2002–2006 | ||||||||||
| Circuit courts of appeals (headquarters) | Total fiscal year 2006 | Total fiscal years 2002-2006 | Number | Percent | Number | Percent | Number | Percent | Number | Percent | Number | Percent | Number | Percent | Number | Percent | Number | Percent | Number | Percent | Number | Percent |
| Total all circuits | 79 | 478 | 60 | 75.9 | 331 | 69.2 | 2 | 2.5 | 35 | 7.3 | 9 | 11.4 | 35 | 7.3 | 1 | 1.3 | 22 | 4.6 | 7 | 8.9 | 55 | 11.5 |
| Boston, MA | 5 | 12 | 4 | 80.0 | 8 | 66.7 | 0 | 0.0 | 1 | 8.3 | 0 | 0.0 | 0 | 0.0 | 1 | 20.0 | 1 | 8.3 | 0 | 0.0 | 2 | 16.7 |
| New York, NY | 8 | 29 | 6 | 75.0 | 25 | 86.2 | 0 | 0.0 | 1 | 3.4 | 2 | 25.0 | 1 | 3.4 | 0 | 0.0 | 1 | 3.4 | 0 | 0.0 | 1 | 3.4 |
| Philadelphia, PA | 1 | 30 | 1 | 100.0 | 24 | 80.0 | 0 | 0.0 | 3 | 10.0 | 0 | 0.0 | 1 | 3.3 | 0 | 0.0 | 1 | 3.3 | 0 | 0.0 | 1 | 3.3 |
| Richmond, VA | 4 | 48 | 4 | 100.0 | 30 | 62.5 | 0 | 0.0 | 5 | 10.4 | 0 | 0.0 | 5 | 10.4 | 0 | 0.0 | 3 | 6.3 | 0 | 0.0 | 5 | 10.4 |
| New Orleans, LA | 3 | 26 | 3 | 100.0 | 17 | 65.4 | 0 | 0.0 | 5 | 19.2 | 0 | 0.0 | 0 | 0.0 | 0 | 0.0 | 0 | 0.0 | 0 | 0.0 | 4 | 15.4 |
| Cincinnati, OH | 16 | 69 | 14 | 87.5 | 49 | 71.0 | 1 | 6.3 | 3 | 4.3 | 0 | 0.0 | 2 | 2.9 | 0 | 0.0 | 5 | 7.2 | 1 | 6.3 | 10 | 14.5 |
| Chicago, IL | 7 | 39 | 5 | 71.4 | 29 | 74.4 | 0 | 0.0 | 3 | 7.7 | 2 | 28.6 | 1 | 2.6 | 0 | 0.0 | 3 | 7.7 | 0 | 0.0 | 3 | 7.7 |
| St. Louis, MO | 1 | 32 | 1 | 100.0 | 21 | 65.6 | 0 | 0.0 | 3 | 9.4 | 0 | 0.0 | 3 | 9.4 | 0 | 0.0 | 1 | 3.1 | 0 | 0.0 | 4 | 12.5 |
| San Francisco, CA | 7 | 25 | 5 | 71.4 | 20 | 80.0 | 0 | 0.0 | 0 | 0.0 | 1 | 14.3 | 2 | 8.0 | 0 | 0.0 | 1 | 4.0 | 1 | 14.3 | 2 | 8.0 |
| Denver, CO | 2 | 15 | 2 | 100.0 | 11 | 73.3 | 0 | 0.0 | 1 | 6.7 | 0 | 0.0 | 0 | 0.0 | 0 | 0.0 | 0 | 0.0 | 0 | 0.0 | 3 | 20.0 |
| Atlanta, GA | 2 | 19 | 1 | 50.0 | 15 | 78.9 | 0 | 0.0 | 0 | 0.0 | 0 | 0.0 | 1 | 5.3 | 0 | 0.0 | 0 | 0.0 | 1 | 50.0 | 3 | 15.8 |
| Washington, DC | 23 | 134 | 14 | 60.9 | 82 | 61.2 | 1 | 4.3 | 10 | 7.5 | 4 | 17.4 | 19 | 14.2 | 0 | 0.0 | 0 | 4.5 | 4 | 17.4 | 17 | 12.7 |
101 of 110 figures sit in a row or column sum that works out. 1 cell breaks a sum: 'Total all circuits', column 18: prints 22, rows 'Boston, MA' to 'Washington, DC' add to 16.
Reader’s notes
p. 180. 23 columns: stub, two "Total" columns, then five outcome groups (Affirmed in full; Modified; Remanded in full; Affirmed in part and remanded in part; Set aside), each with Fiscal Year 2006 Number/Percent and Cumulative fiscal years 2002–2006 Number/Percent. Doubtful cell: row "Washington, DC", column "Affirmed in part and remanded in part / Cumulative fiscal years 2002–2006 / Number". The glyph reads to me as 0, and that is what is transcribed, but it is almost certainly a 6 degraded by the scan: the printed percent beside it is 4.5 (6/134 = 4.5%, while 0 would be 0.0%), and the other circuits in that column sum to 16 against a printed "Total all circuits" of 22, leaving 6 for DC. Treat the cell as uncertain. Every other column reconciles exactly against its "Total all circuits" line (Total FY2006 = 79; Total FY2002-2006 = 478; Affirmed in full 60 / 331; Modified 2 / 35; Remanded in full 9 / 35; Affirmed in part FY2006 = 1; Set aside 7 / 55), so the rest of the digit placement is well supported. The caption carries footnote marker 1, but the footnote text itself falls below the crop — only the top edge of the marker is visible under the bottom rule — so `footnotes` is empty. Leader dots were dropped from row labels; the trailing period printed after "New Orleans, LA" and "Washington, DC" was read as a leader dot, not part of the label.
Source image
Source data: U.S. NLRB Annual Reports (public domain). Reconstruction by NLRB Stats Archive. Read by claude-opus-5 (effort max, prompt extract_v1) from the 300-dpi scan; stitched by page. Updated October 2026.