NLRB Stats Archive › Annual Reports › FY2005 › Distribution of Unfair Labor Practice Situations Received, by Number of Employees in Establishments, Fiscal Year 2005
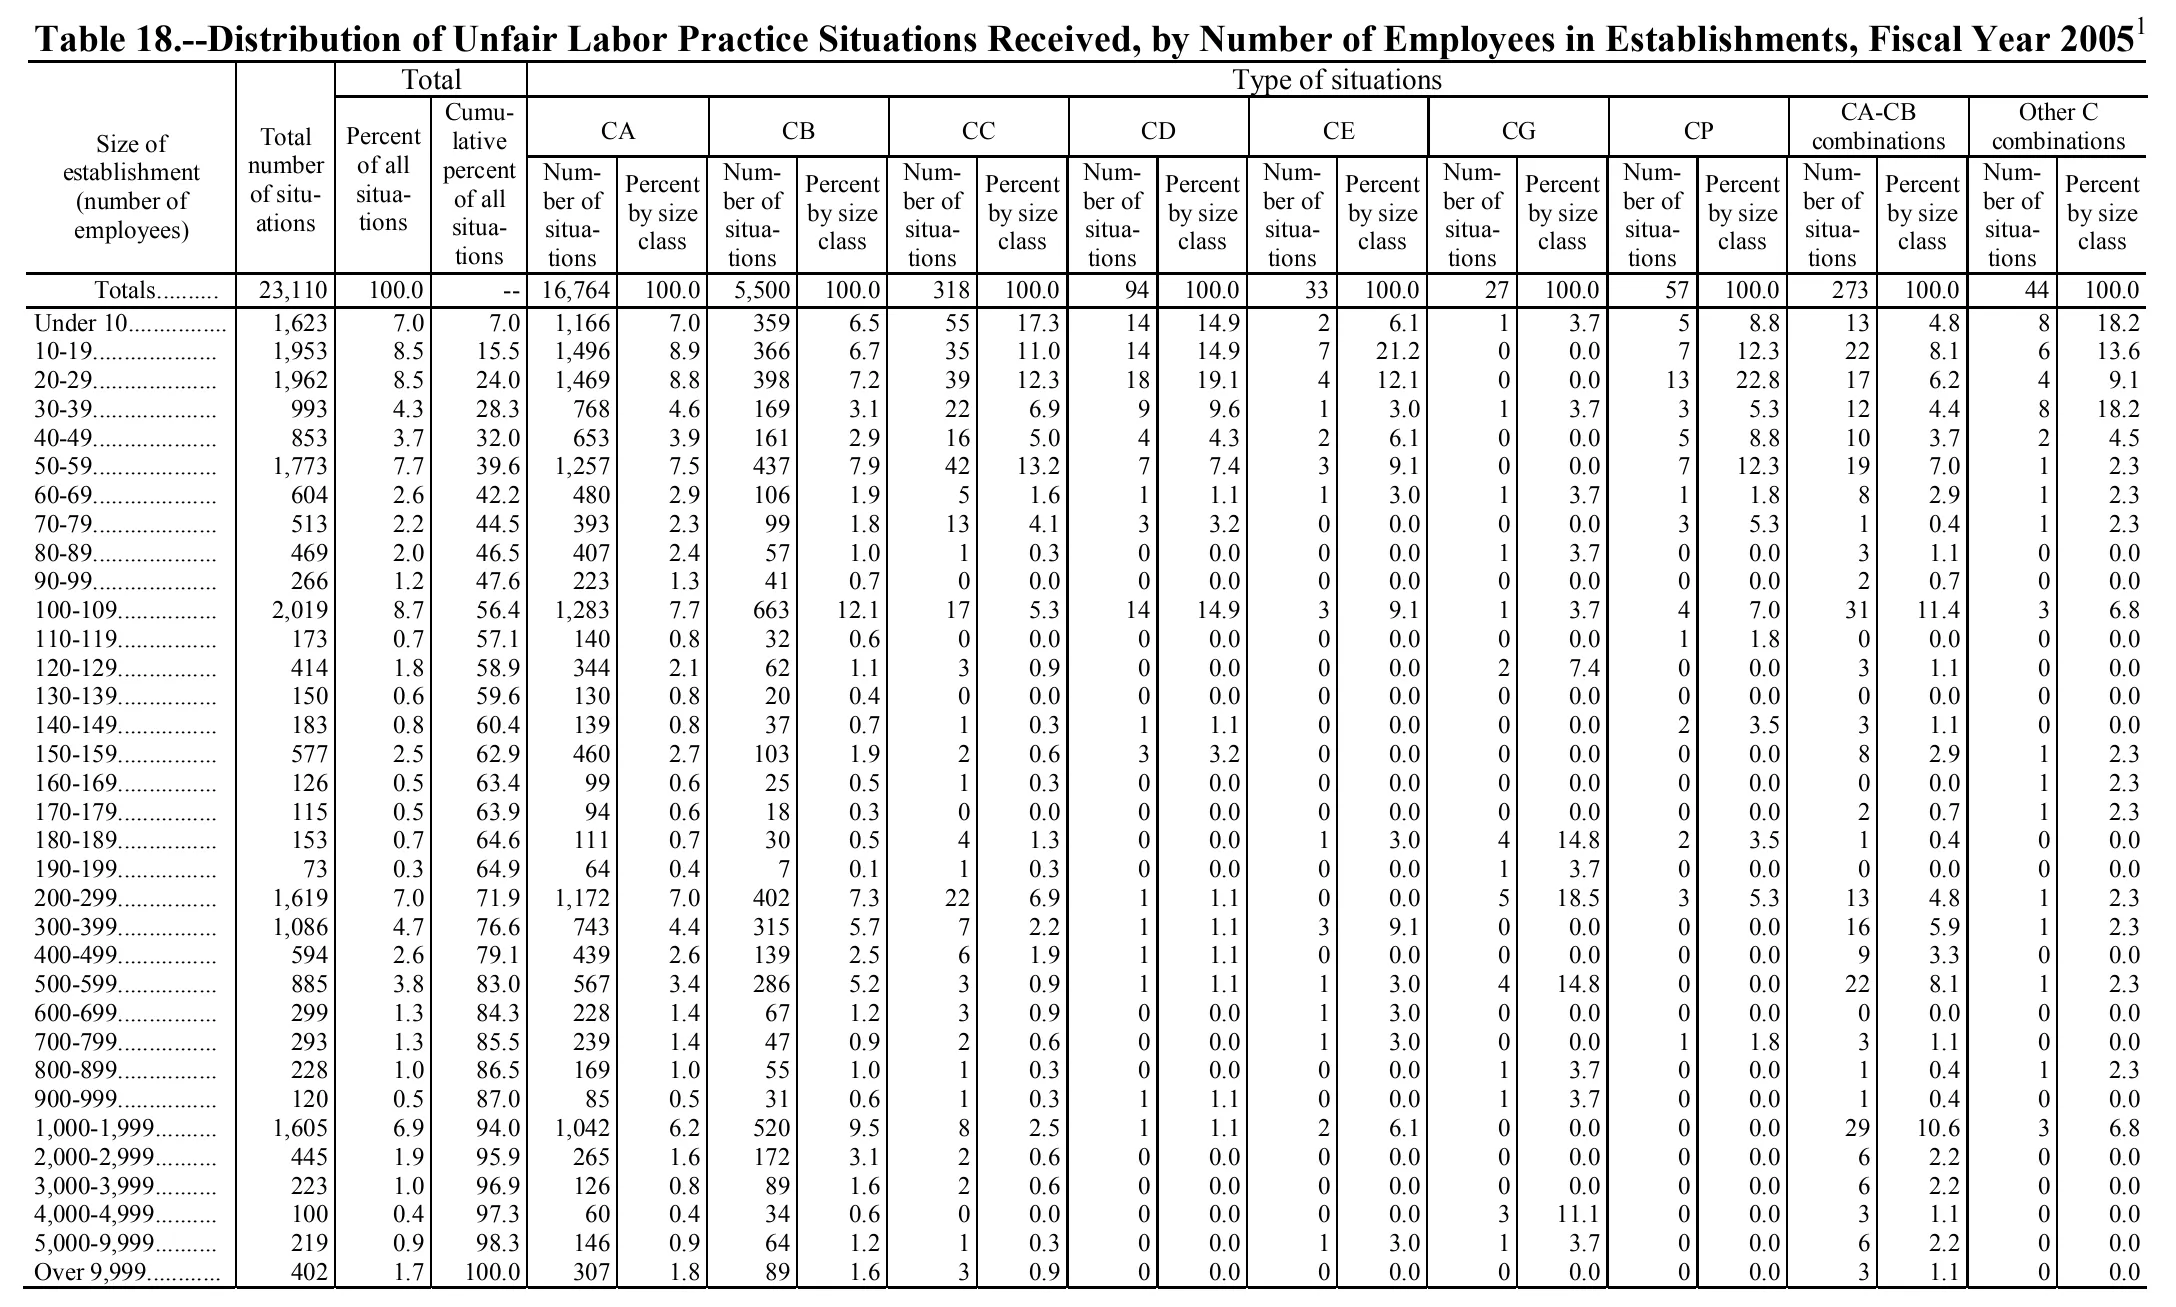
Distribution of Unfair Labor Practice Situations Received, by Number of Employees in Establishments, Fiscal Year 2005
| Size of establishment (number of employees) | Total number of situations | Total | Type of situations | ||||||||||||||||||
|---|---|---|---|---|---|---|---|---|---|---|---|---|---|---|---|---|---|---|---|---|---|
| Size of establishment (number of employees) | Total number of situations | Percent of all situations | Cumulative percent of all situations | CA | CB | CC | CD | CE | CG | CP | CA-CB combinations | Other C combinations | |||||||||
| Size of establishment (number of employees) | Total number of situations | Percent of all situations | Cumulative percent of all situations | Number of situations | Percent by size class | Number of situations | Percent by size class | Number of situations | Percent by size class | Number of situations | Percent by size class | Number of situations | Percent by size class | Number of situations | Percent by size class | Number of situations | Percent by size class | Number of situations | Percent by size class | Number of situations | Percent by size class |
| Totals | 23,110 | 100.0 | 16,764 | 100.0 | 5,500 | 100.0 | 318 | 100.0 | 94 | 100.0 | 33 | 100.0 | 27 | 100.0 | 57 | 100.0 | 273 | 100.0 | 44 | 100.0 | |
| Under 10 | 1,623 | 7.0 | 7.0 | 1,166 | 7.0 | 359 | 6.5 | 55 | 17.3 | 14 | 14.9 | 2 | 6.1 | 1 | 3.7 | 5 | 8.8 | 13 | 4.8 | 8 | 18.2 |
| 10-19 | 1,953 | 8.5 | 15.5 | 1,496 | 8.9 | 366 | 6.7 | 35 | 11.0 | 14 | 14.9 | 7 | 21.2 | 0 | 0.0 | 7 | 12.3 | 22 | 8.1 | 6 | 13.6 |
| 20-29 | 1,962 | 8.5 | 24.0 | 1,469 | 8.8 | 398 | 7.2 | 39 | 12.3 | 18 | 19.1 | 4 | 12.1 | 0 | 0.0 | 13 | 22.8 | 17 | 6.2 | 4 | 9.1 |
| 30-39 | 993 | 4.3 | 28.3 | 768 | 4.6 | 169 | 3.1 | 22 | 6.9 | 9 | 9.6 | 1 | 3.0 | 1 | 3.7 | 3 | 5.3 | 12 | 4.4 | 8 | 18.2 |
| 40-49 | 853 | 3.7 | 32.0 | 653 | 3.9 | 161 | 2.9 | 16 | 5.0 | 4 | 4.3 | 2 | 6.1 | 0 | 0.0 | 5 | 8.8 | 10 | 3.7 | 2 | 4.5 |
| 50-59 | 1,773 | 7.7 | 39.6 | 1,257 | 7.5 | 437 | 7.9 | 42 | 13.2 | 7 | 7.4 | 3 | 9.1 | 0 | 0.0 | 7 | 12.3 | 19 | 7.0 | 1 | 2.3 |
| 60-69 | 604 | 2.6 | 42.2 | 480 | 2.9 | 106 | 1.9 | 5 | 1.6 | 1 | 1.1 | 1 | 3.0 | 1 | 3.7 | 1 | 1.8 | 8 | 2.9 | 1 | 2.3 |
| 70-79 | 513 | 2.2 | 44.5 | 393 | 2.3 | 99 | 1.8 | 13 | 4.1 | 3 | 3.2 | 0 | 0.0 | 0 | 0.0 | 3 | 5.3 | 1 | 0.4 | 1 | 2.3 |
| 80-89 | 469 | 2.0 | 46.5 | 407 | 2.4 | 57 | 1.0 | 1 | 0.3 | 0 | 0.0 | 0 | 0.0 | 1 | 3.7 | 0 | 0.0 | 3 | 1.1 | 0 | 0.0 |
| 90-99 | 266 | 1.2 | 47.6 | 223 | 1.3 | 41 | 0.7 | 0 | 0.0 | 0 | 0.0 | 0 | 0.0 | 0 | 0.0 | 0 | 0.0 | 2 | 0.7 | 0 | 0.0 |
| 100-109 | 2,019 | 8.7 | 56.4 | 1,283 | 7.7 | 663 | 12.1 | 17 | 5.3 | 14 | 14.9 | 3 | 9.1 | 1 | 3.7 | 4 | 7.0 | 31 | 11.4 | 3 | 6.8 |
| 110-119 | 173 | 0.7 | 57.1 | 140 | 0.8 | 32 | 0.6 | 0 | 0.0 | 0 | 0.0 | 0 | 0.0 | 0 | 0.0 | 1 | 1.8 | 0 | 0.0 | 0 | 0.0 |
| 120-129 | 414 | 1.8 | 58.9 | 344 | 2.1 | 62 | 1.1 | 3 | 0.9 | 0 | 0.0 | 0 | 0.0 | 2 | 7.4 | 0 | 0.0 | 3 | 1.1 | 0 | 0.0 |
| 130-139 | 150 | 0.6 | 59.6 | 130 | 0.8 | 20 | 0.4 | 0 | 0.0 | 0 | 0.0 | 0 | 0.0 | 0 | 0.0 | 0 | 0.0 | 0 | 0.0 | 0 | 0.0 |
| 140-149 | 183 | 0.8 | 60.4 | 139 | 0.8 | 37 | 0.7 | 1 | 0.3 | 1 | 1.1 | 0 | 0.0 | 0 | 0.0 | 2 | 3.5 | 3 | 1.1 | 0 | 0.0 |
| 150-159 | 577 | 2.5 | 62.9 | 460 | 2.7 | 103 | 1.9 | 2 | 0.6 | 3 | 3.2 | 0 | 0.0 | 0 | 0.0 | 0 | 0.0 | 8 | 2.9 | 1 | 2.3 |
| 160-169 | 126 | 0.5 | 63.4 | 99 | 0.6 | 25 | 0.5 | 1 | 0.3 | 0 | 0.0 | 0 | 0.0 | 0 | 0.0 | 0 | 0.0 | 0 | 0.0 | 1 | 2.3 |
| 170-179 | 115 | 0.5 | 63.9 | 94 | 0.6 | 18 | 0.3 | 0 | 0.0 | 0 | 0.0 | 0 | 0.0 | 0 | 0.0 | 0 | 0.0 | 2 | 0.7 | 1 | 2.3 |
| 180-189 | 153 | 0.7 | 64.6 | 111 | 0.7 | 30 | 0.5 | 4 | 1.3 | 0 | 0.0 | 1 | 3.0 | 4 | 14.8 | 2 | 3.5 | 1 | 0.4 | 0 | 0.0 |
| 190-199 | 73 | 0.3 | 64.9 | 64 | 0.4 | 7 | 0.1 | 1 | 0.3 | 0 | 0.0 | 0 | 0.0 | 1 | 3.7 | 0 | 0.0 | 0 | 0.0 | 0 | 0.0 |
| 200-299 | 1,619 | 7.0 | 71.9 | 1,172 | 7.0 | 402 | 7.3 | 22 | 6.9 | 1 | 1.1 | 0 | 0.0 | 5 | 18.5 | 3 | 5.3 | 13 | 4.8 | 1 | 2.3 |
| 300-399 | 1,086 | 4.7 | 76.6 | 743 | 4.4 | 315 | 5.7 | 7 | 2.2 | 1 | 1.1 | 3 | 9.1 | 0 | 0.0 | 0 | 0.0 | 16 | 5.9 | 1 | 2.3 |
| 400-499 | 594 | 2.6 | 79.1 | 439 | 2.6 | 139 | 2.5 | 6 | 1.9 | 1 | 1.1 | 0 | 0.0 | 0 | 0.0 | 0 | 0.0 | 9 | 3.3 | 0 | 0.0 |
| 500-599 | 885 | 3.8 | 83.0 | 567 | 3.4 | 286 | 5.2 | 3 | 0.9 | 1 | 1.1 | 1 | 3.0 | 4 | 14.8 | 0 | 0.0 | 22 | 8.1 | 1 | 2.3 |
| 600-699 | 299 | 1.3 | 84.3 | 228 | 1.4 | 67 | 1.2 | 3 | 0.9 | 0 | 0.0 | 1 | 3.0 | 0 | 0.0 | 0 | 0.0 | 0 | 0.0 | 0 | 0.0 |
| 700-799 | 293 | 1.3 | 85.5 | 239 | 1.4 | 47 | 0.9 | 2 | 0.6 | 0 | 0.0 | 1 | 3.0 | 0 | 0.0 | 1 | 1.8 | 3 | 1.1 | 0 | 0.0 |
| 800-899 | 228 | 1.0 | 86.5 | 169 | 1.0 | 55 | 1.0 | 1 | 0.3 | 0 | 0.0 | 0 | 0.0 | 1 | 3.7 | 0 | 0.0 | 1 | 0.4 | 1 | 2.3 |
| 900-999 | 120 | 0.5 | 87.0 | 85 | 0.5 | 31 | 0.6 | 1 | 0.3 | 1 | 1.1 | 0 | 0.0 | 1 | 3.7 | 0 | 0.0 | 1 | 0.4 | 0 | 0.0 |
| 1,000-1,999 | 1,605 | 6.9 | 94.0 | 1,042 | 6.2 | 520 | 9.5 | 8 | 2.5 | 1 | 1.1 | 2 | 6.1 | 0 | 0.0 | 0 | 0.0 | 29 | 10.6 | 3 | 6.8 |
| 2,000-2,999 | 445 | 1.9 | 95.9 | 265 | 1.6 | 172 | 3.1 | 2 | 0.6 | 0 | 0.0 | 0 | 0.0 | 0 | 0.0 | 0 | 0.0 | 6 | 2.2 | 0 | 0.0 |
| 3,000-3,999 | 223 | 1.0 | 96.9 | 126 | 0.8 | 89 | 1.6 | 2 | 0.6 | 0 | 0.0 | 0 | 0.0 | 0 | 0.0 | 0 | 0.0 | 6 | 2.2 | 0 | 0.0 |
| 4,000-4,999 | 100 | 0.4 | 97.3 | 60 | 0.4 | 34 | 0.6 | 0 | 0.0 | 0 | 0.0 | 0 | 0.0 | 3 | 11.1 | 0 | 0.0 | 3 | 1.1 | 0 | 0.0 |
| 5,000-9,999 | 219 | 0.9 | 98.3 | 146 | 0.9 | 64 | 1.2 | 1 | 0.3 | 0 | 0.0 | 1 | 3.0 | 1 | 3.7 | 0 | 0.0 | 6 | 2.2 | 0 | 0.0 |
| Over 9,999 | 402 | 1.7 | 100.0 | 307 | 1.8 | 89 | 1.6 | 3 | 0.9 | 0 | 0.0 | 0 | 0.0 | 0 | 0.0 | 0 | 0.0 | 3 | 1.1 | 0 | 0.0 |
247 of 247 figures sit in a row or column sum that works out.
Reader’s notes
p. 165. 22 columns: stub, 3 "Total" columns, then 9 two-column type-of-situation blocks (CA, CB, CC, CD, CE, CG, CP, CA-CB combinations, Other C combinations). Spanner placement in the top heading level: the word "Total" is centred over the "Percent of all situations" and "Cumulative percent of all situations" columns only, with the vertical rule to its left running all the way up to the table's top rule, so I have treated "Total number of situations" as a tall heading occupying all three heading levels and "Total" as spanning just the two percent columns. If the rule under "Total" in fact starts at the stub boundary, "Total" would instead span all three of those columns; this is the one genuinely ambiguous feature of the header at this resolution. Totals row, "Cumulative percent of all situations" column: the cell prints a short double-dash rule ("--"), transcribed as an empty cell per the dash-rule convention. The caption carries a raised footnote marker 1 ("Fiscal Year 2005^1"), but the crop ends at the last body row ("Over 9,999") and no footnote text is visible, so `footnotes` is empty. The footnote text appears to be cut off below the crop. Arithmetic check (not applied to the transcription, reported only): every one of the 34 size-class rows has its nine type-of-situations counts summing exactly to the printed "Total number of situations", and each of the ten count columns sums exactly to its printed Totals figure (16,764 + 5,500 + 318 + 94 + 33 + 27 + 57 + 273 + 44 = 23,110). No misprints detected. Percentages differ from recomputed values only by ordinary rounding (e.g. the cumulative column's successive differences occasionally differ by 0.1 from the printed "Percent of all situations").
Source image
Source data: U.S. NLRB Annual Reports (public domain). Reconstruction by NLRB Stats Archive. Read by claude-opus-5 (effort max, prompt extract_v1) from the 300-dpi scan; stitched by page. Updated October 2026.