NLRB Stats Archive › Annual Reports › FY2005 › Size of Units in Representation Elections in Cases Closed, Fiscal Year 2005
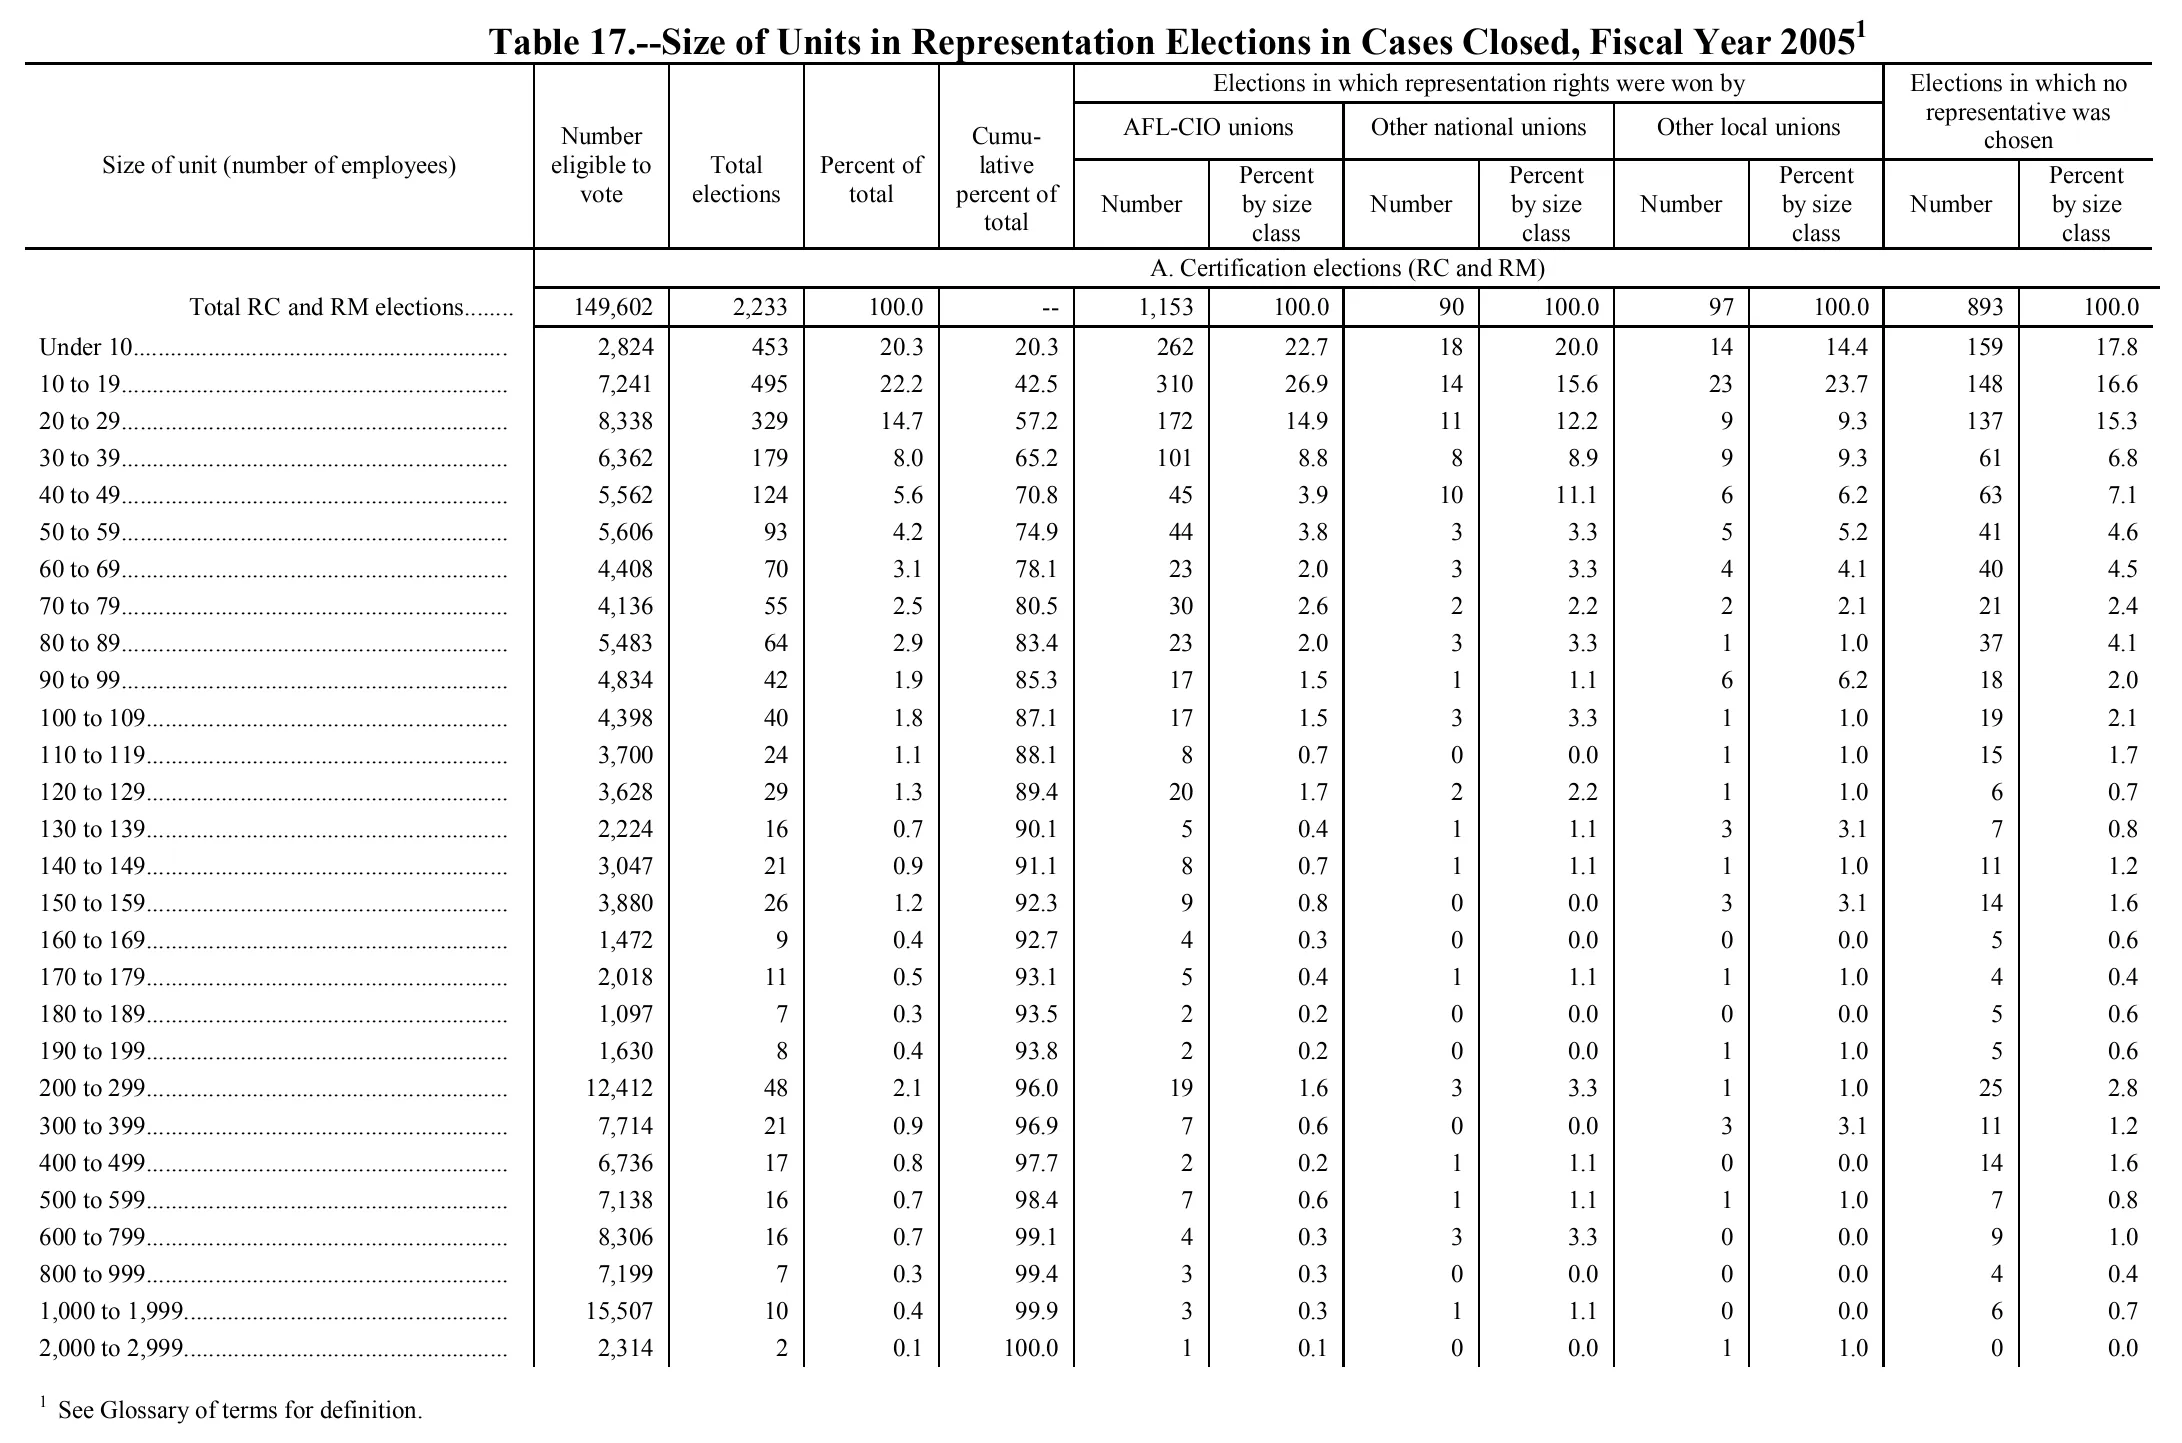
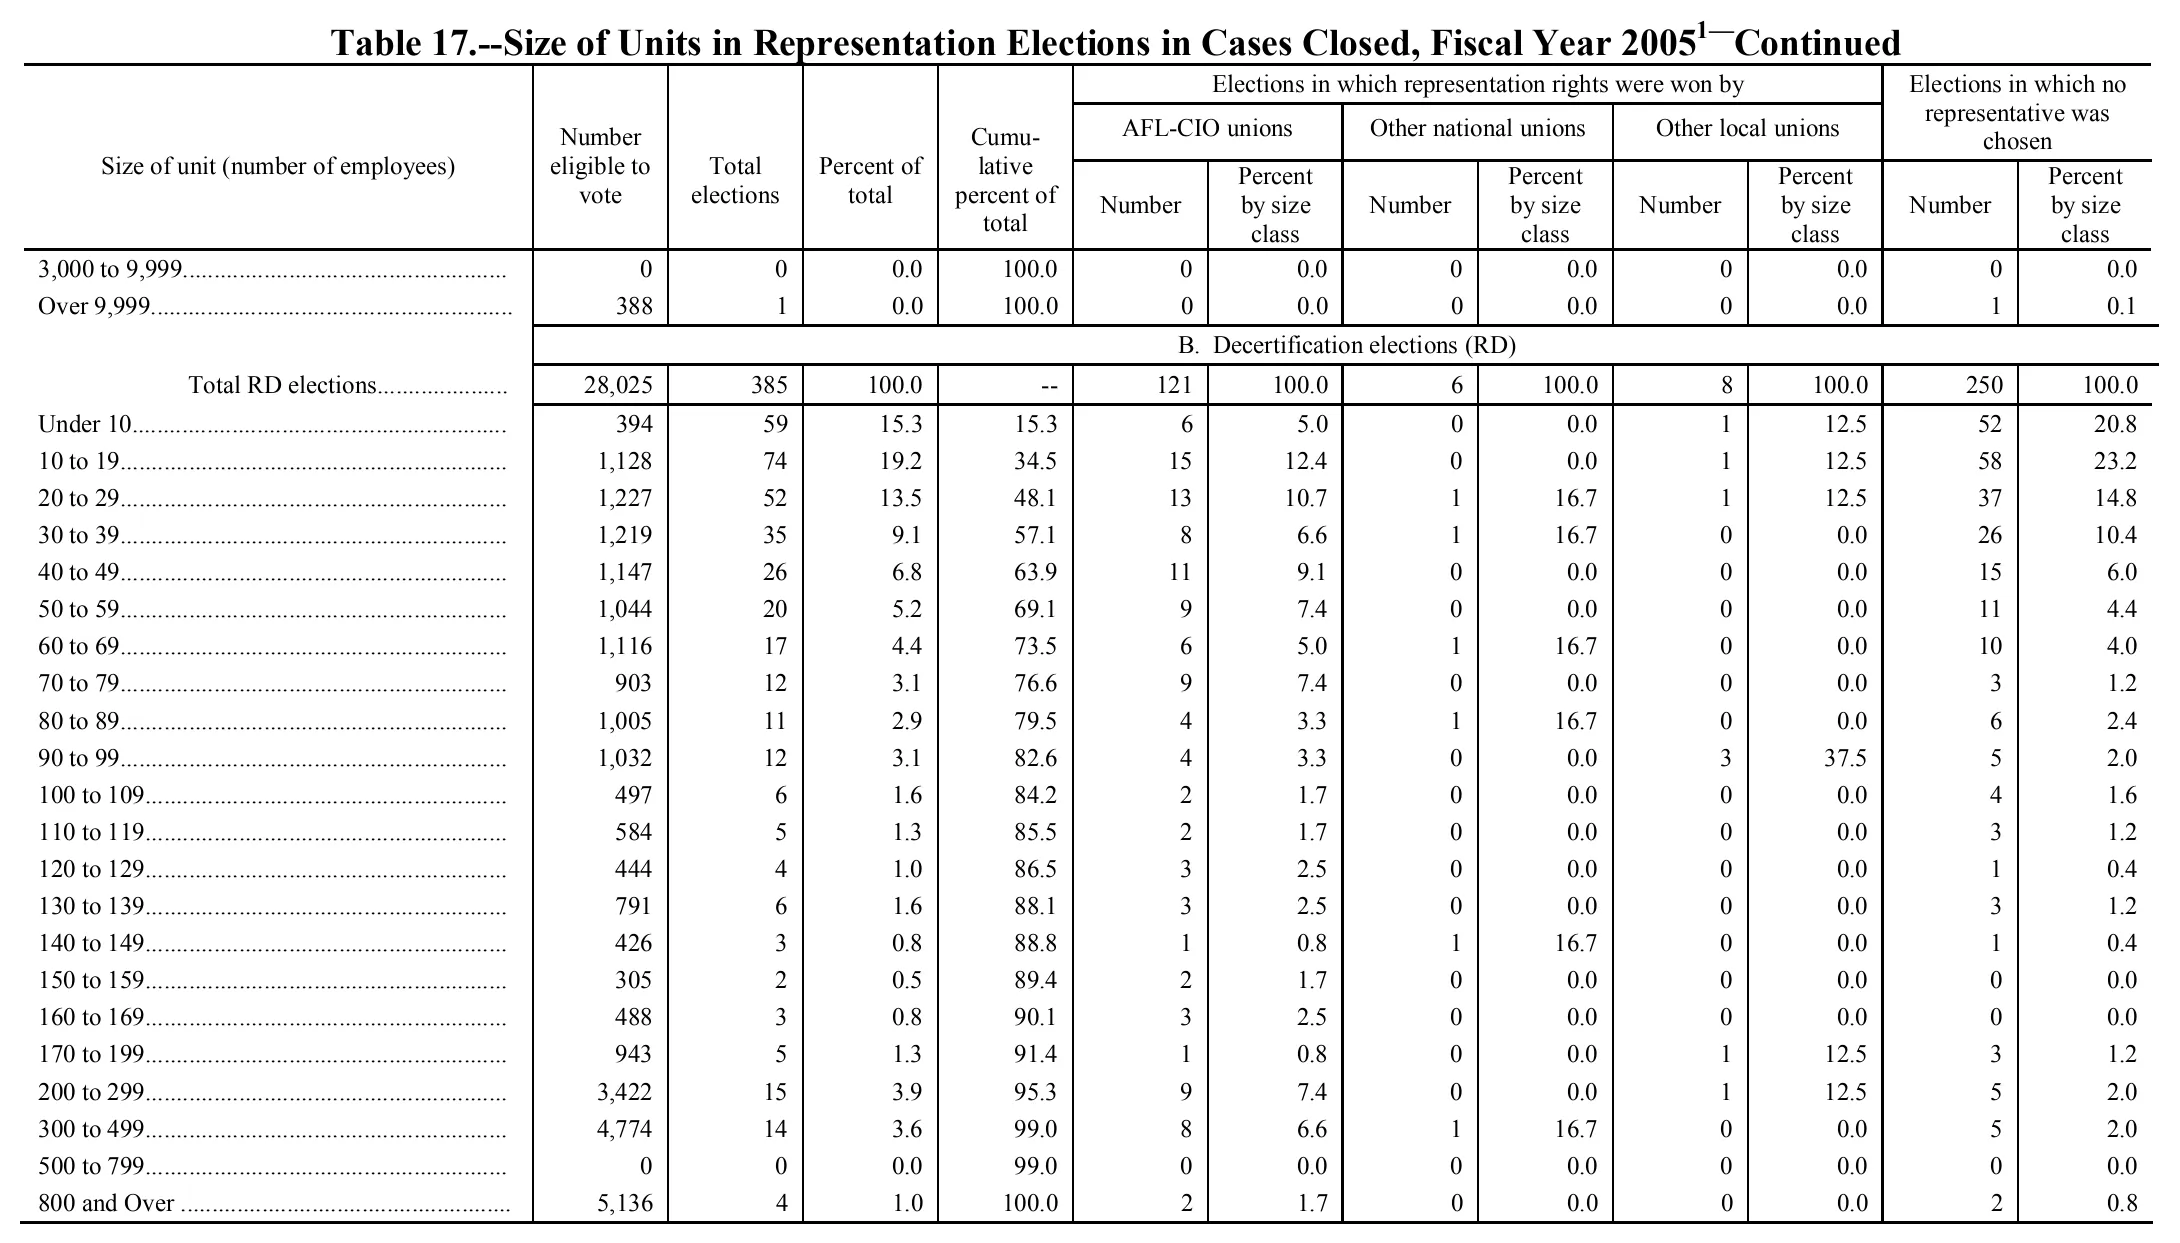
Size of Units in Representation Elections in Cases Closed, Fiscal Year 2005
Stitched from pp. 163–164.
| Size of unit (number of employees) | Number eligible to vote | Total elections | Percent of total | Cumulative percent of total | Elections in which representation rights were won by | Elections in which no representative was chosen | ||||||
|---|---|---|---|---|---|---|---|---|---|---|---|---|
| Size of unit (number of employees) | Number eligible to vote | Total elections | Percent of total | Cumulative percent of total | AFL-CIO unions | Other national unions | Other local unions | Elections in which no representative was chosen | ||||
| Size of unit (number of employees) | Number eligible to vote | Total elections | Percent of total | Cumulative percent of total | Number | Percent by size class | Number | Percent by size class | Number | Percent by size class | Number | Percent by size class |
| A. Certification elections (RC and RM) | ||||||||||||
| Total RC and RM elections | 149,602 | 2,233 | 100.0 | 1,153 | 100.0 | 90 | 100.0 | 97 | 100.0 | 893 | 100.0 | |
| Under 10 | 2,824 | 453 | 20.3 | 20.3 | 262 | 22.7 | 18 | 20.0 | 14 | 14.4 | 159 | 17.8 |
| 10 to 19 | 7,241 | 495 | 22.2 | 42.5 | 310 | 26.9 | 14 | 15.6 | 23 | 23.7 | 148 | 16.6 |
| 20 to 29 | 8,338 | 329 | 14.7 | 57.2 | 172 | 14.9 | 11 | 12.2 | 9 | 9.3 | 137 | 15.3 |
| 30 to 39 | 6,362 | 179 | 8.0 | 65.2 | 101 | 8.8 | 8 | 8.9 | 9 | 9.3 | 61 | 6.8 |
| 40 to 49 | 5,562 | 124 | 5.6 | 70.8 | 45 | 3.9 | 10 | 11.1 | 6 | 6.2 | 63 | 7.1 |
| 50 to 59 | 5,606 | 93 | 4.2 | 74.9 | 44 | 3.8 | 3 | 3.3 | 5 | 5.2 | 41 | 4.6 |
| 60 to 69 | 4,408 | 70 | 3.1 | 78.1 | 23 | 2.0 | 3 | 3.3 | 4 | 4.1 | 40 | 4.5 |
| 70 to 79 | 4,136 | 55 | 2.5 | 80.5 | 30 | 2.6 | 2 | 2.2 | 2 | 2.1 | 21 | 2.4 |
| 80 to 89 | 5,483 | 64 | 2.9 | 83.4 | 23 | 2.0 | 3 | 3.3 | 1 | 1.0 | 37 | 4.1 |
| 90 to 99 | 4,834 | 42 | 1.9 | 85.3 | 17 | 1.5 | 1 | 1.1 | 6 | 6.2 | 18 | 2.0 |
| 100 to 109 | 4,398 | 40 | 1.8 | 87.1 | 17 | 1.5 | 3 | 3.3 | 1 | 1.0 | 19 | 2.1 |
| 110 to 119 | 3,700 | 24 | 1.1 | 88.1 | 8 | 0.7 | 0 | 0.0 | 1 | 1.0 | 15 | 1.7 |
| 120 to 129 | 3,628 | 29 | 1.3 | 89.4 | 20 | 1.7 | 2 | 2.2 | 1 | 1.0 | 6 | 0.7 |
| 130 to 139 | 2,224 | 16 | 0.7 | 90.1 | 5 | 0.4 | 1 | 1.1 | 3 | 3.1 | 7 | 0.8 |
| 140 to 149 | 3,047 | 21 | 0.9 | 91.1 | 8 | 0.7 | 1 | 1.1 | 1 | 1.0 | 11 | 1.2 |
| 150 to 159 | 3,880 | 26 | 1.2 | 92.3 | 9 | 0.8 | 0 | 0.0 | 3 | 3.1 | 14 | 1.6 |
| 160 to 169 | 1,472 | 9 | 0.4 | 92.7 | 4 | 0.3 | 0 | 0.0 | 0 | 0.0 | 5 | 0.6 |
| 170 to 179 | 2,018 | 11 | 0.5 | 93.1 | 5 | 0.4 | 1 | 1.1 | 1 | 1.0 | 4 | 0.4 |
| 180 to 189 | 1,097 | 7 | 0.3 | 93.5 | 2 | 0.2 | 0 | 0.0 | 0 | 0.0 | 5 | 0.6 |
| 190 to 199 | 1,630 | 8 | 0.4 | 93.8 | 2 | 0.2 | 0 | 0.0 | 1 | 1.0 | 5 | 0.6 |
| 200 to 299 | 12,412 | 48 | 2.1 | 96.0 | 19 | 1.6 | 3 | 3.3 | 1 | 1.0 | 25 | 2.8 |
| 300 to 399 | 7,714 | 21 | 0.9 | 96.9 | 7 | 0.6 | 0 | 0.0 | 3 | 3.1 | 11 | 1.2 |
| 400 to 499 | 6,736 | 17 | 0.8 | 97.7 | 2 | 0.2 | 1 | 1.1 | 0 | 0.0 | 14 | 1.6 |
| 500 to 599 | 7,138 | 16 | 0.7 | 98.4 | 7 | 0.6 | 1 | 1.1 | 1 | 1.0 | 7 | 0.8 |
| 600 to 799 | 8,306 | 16 | 0.7 | 99.1 | 4 | 0.3 | 3 | 3.3 | 0 | 0.0 | 9 | 1.0 |
| 800 to 999 | 7,199 | 7 | 0.3 | 99.4 | 3 | 0.3 | 0 | 0.0 | 0 | 0.0 | 4 | 0.4 |
| 1,000 to 1,999 | 15,507 | 10 | 0.4 | 99.9 | 3 | 0.3 | 1 | 1.1 | 0 | 0.0 | 6 | 0.7 |
| 2,000 to 2,999 | 2,314 | 2 | 0.1 | 100.0 | 1 | 0.1 | 0 | 0.0 | 1 | 1.0 | 0 | 0.0 |
| 3,000 to 9,999 | 0 | 0 | 0.0 | 100.0 | 0 | 0.0 | 0 | 0.0 | 0 | 0.0 | 0 | 0.0 |
| Over 9,999 | 388 | 1 | 0.0 | 100.0 | 0 | 0.0 | 0 | 0.0 | 0 | 0.0 | 1 | 0.1 |
| B. Decertification elections (RD) | ||||||||||||
| Total RD elections | 28,025 | 385 | 100.0 | 121 | 100.0 | 6 | 100.0 | 8 | 100.0 | 250 | 100.0 | |
| Under 10 | 394 | 59 | 15.3 | 15.3 | 6 | 5.0 | 0 | 0.0 | 1 | 12.5 | 52 | 20.8 |
| 10 to 19 | 1,128 | 74 | 19.2 | 34.5 | 15 | 12.4 | 0 | 0.0 | 1 | 12.5 | 58 | 23.2 |
| 20 to 29 | 1,227 | 52 | 13.5 | 48.1 | 13 | 10.7 | 1 | 16.7 | 1 | 12.5 | 37 | 14.8 |
| 30 to 39 | 1,219 | 35 | 9.1 | 57.1 | 8 | 6.6 | 1 | 16.7 | 0 | 0.0 | 26 | 10.4 |
| 40 to 49 | 1,147 | 26 | 6.8 | 63.9 | 11 | 9.1 | 0 | 0.0 | 0 | 0.0 | 15 | 6.0 |
| 50 to 59 | 1,044 | 20 | 5.2 | 69.1 | 9 | 7.4 | 0 | 0.0 | 0 | 0.0 | 11 | 4.4 |
| 60 to 69 | 1,116 | 17 | 4.4 | 73.5 | 6 | 5.0 | 1 | 16.7 | 0 | 0.0 | 10 | 4.0 |
| 70 to 79 | 903 | 12 | 3.1 | 76.6 | 9 | 7.4 | 0 | 0.0 | 0 | 0.0 | 3 | 1.2 |
| 80 to 89 | 1,005 | 11 | 2.9 | 79.5 | 4 | 3.3 | 1 | 16.7 | 0 | 0.0 | 6 | 2.4 |
| 90 to 99 | 1,032 | 12 | 3.1 | 82.6 | 4 | 3.3 | 0 | 0.0 | 3 | 37.5 | 5 | 2.0 |
| 100 to 109 | 497 | 6 | 1.6 | 84.2 | 2 | 1.7 | 0 | 0.0 | 0 | 0.0 | 4 | 1.6 |
| 110 to 119 | 584 | 5 | 1.3 | 85.5 | 2 | 1.7 | 0 | 0.0 | 0 | 0.0 | 3 | 1.2 |
| 120 to 129 | 444 | 4 | 1.0 | 86.5 | 3 | 2.5 | 0 | 0.0 | 0 | 0.0 | 1 | 0.4 |
| 130 to 139 | 791 | 6 | 1.6 | 88.1 | 3 | 2.5 | 0 | 0.0 | 0 | 0.0 | 3 | 1.2 |
| 140 to 149 | 426 | 3 | 0.8 | 88.8 | 1 | 0.8 | 1 | 16.7 | 0 | 0.0 | 1 | 0.4 |
| 150 to 159 | 305 | 2 | 0.5 | 89.4 | 2 | 1.7 | 0 | 0.0 | 0 | 0.0 | 0 | 0.0 |
| 160 to 169 | 488 | 3 | 0.8 | 90.1 | 3 | 2.5 | 0 | 0.0 | 0 | 0.0 | 0 | 0.0 |
| 170 to 199 | 943 | 5 | 1.3 | 91.4 | 1 | 0.8 | 0 | 0.0 | 1 | 12.5 | 3 | 1.2 |
| 200 to 299 | 3,422 | 15 | 3.9 | 95.3 | 9 | 7.4 | 0 | 0.0 | 1 | 12.5 | 5 | 2.0 |
| 300 to 499 | 4,774 | 14 | 3.6 | 99.0 | 8 | 6.6 | 1 | 16.7 | 0 | 0.0 | 5 | 2.0 |
| 500 to 799 | 0 | 0 | 0.0 | 99.0 | 0 | 0.0 | 0 | 0.0 | 0 | 0.0 | 0 | 0.0 |
| 800 and Over | 5,136 | 4 | 1.0 | 100.0 | 2 | 1.7 | 0 | 0.0 | 0 | 0.0 | 2 | 0.8 |
- 1 See Glossary of terms for definition.
262 of 262 figures sit in a row or column sum that works out.
Reader’s notes
p. 163. 13 columns. The stub heading and the four columns "Number eligible to vote", "Total elections", "Percent of total" and "Cumulative percent of total" are tall single headings spanning all three heading levels; "Elections in which no representative was chosen" spans the top two levels over its two columns. "A. Certification elections (RC and RM)" is printed as a centred section line spanning the data columns (no values); it is given here as a row label with empty value cells. The crop ends after "2,000 to 2,999" with the table's bottom rule and footnote, so panel B (if any) is on a later page and is not cut off mid-row here. Cumulative percent of total, row "Total RC and RM elections": the cell prints a short dash placeholder "--" (not applicable); transcribed as "" per the dash-rule convention. Arithmetic cross-checks (nothing altered; all values as printed): - Every body row is internally consistent: AFL-CIO + other national + other local + no-representative = total elections, in all 28 size-class rows, and the printed totals row likewise (1,153 + 90 + 97 + 893 = 2,233). - Column sums of the body rows vs the printed totals row: AFL-CIO Number 1,153 (matches), Other national Number 90 (matches), Other local Number 97 (matches), but "Total elections" sums to 2,232 against a printed 2,233, and "Elections in which no representative was chosen — Number" sums to 892 against a printed 893. These two shortfalls are consistent with each other (one no-representative election unaccounted for in the body), and look like a discrepancy in the source table rather than a misreading. - "Number eligible to vote" sums to 149,214 against a printed 149,602, a shortfall of 388. - Doubtful cells, "Number eligible to vote" column: several values imply an average unit size outside the printed size class, so one digit in each may be misprinted or misread, though two independent readings of the image gave the same digits. The clearest cases are "110 to 119" (3,700 over 24 elections = 154 per election), "90 to 99" (4,834 over 42 = 115), "2,000 to 2,999" (2,314 over 2 = 1,157), "600 to 799" (8,306 over 16 = 519), "500 to 599" (7,138 over 16 = 446), "800 to 999" (7,199 over 7 = 1,028) and "180 to 189" (1,097 over 7 = 157). Milder cases: "50 to 59" (60.3), "100 to 109" (110.0), "150 to 159" (149.2), "170 to 179" (183.5), "190 to 199" (203.8), "400 to 499" (396.2). All other columns reconcile exactly, so the uncertainty is confined to this one column.
p. 164. 13 columns, confirmed from the column rules and the three heading levels. The crop is a continuation page: the first two body rows ("3,000 to 9,999", "Over 9,999") finish the preceding section (panel A), after which the full-width band "B. Decertification elections (RD)" opens a new section; that band is printed centred across the data columns with an empty stub, and I placed its text in the stub cell with the remaining cells blank. In the "Total RD elections" row the "Cumulative percent of total" cell prints a short dash rule ("--"), transcribed as an empty cell per the dash-rule rule. The row sequence jumps from "160 to 169" to "170 to 199" as printed (no 170-179 / 180-189 / 190-199 lines). Two apparent oddities are transcribed exactly as printed and not corrected: "500 to 799" shows 0 eligible voters and 0 elections while its cumulative percent repeats the previous row's 99.0; and the "3,000 to 9,999" row shows 0 eligible with a cumulative percent of 100.0. The RD column totals do check against the printed detail (elections 385, AFL-CIO 121, other national 6, other local 8, no representative 250), which supports the column assignment. No footnotes are printed under the table on this crop; the superscript 1 on the caption's year is part of the excluded caption. No cells were illegible.
Source image
Source data: U.S. NLRB Annual Reports (public domain). Reconstruction by NLRB Stats Archive. Read by claude-opus-5 (effort max, prompt extract_v1) from the 300-dpi scan; stitched by page. Updated October 2026.