NLRB Stats Archive › Annual Reports › FY2004 › Proceedings Decided by Circuit Courts of Appeals on Petitions for Enforcement and/or Review of Board Orders, Fiscal Year 2004, Compared With 5-Year Cumulative Totals, 1999 Through 2003
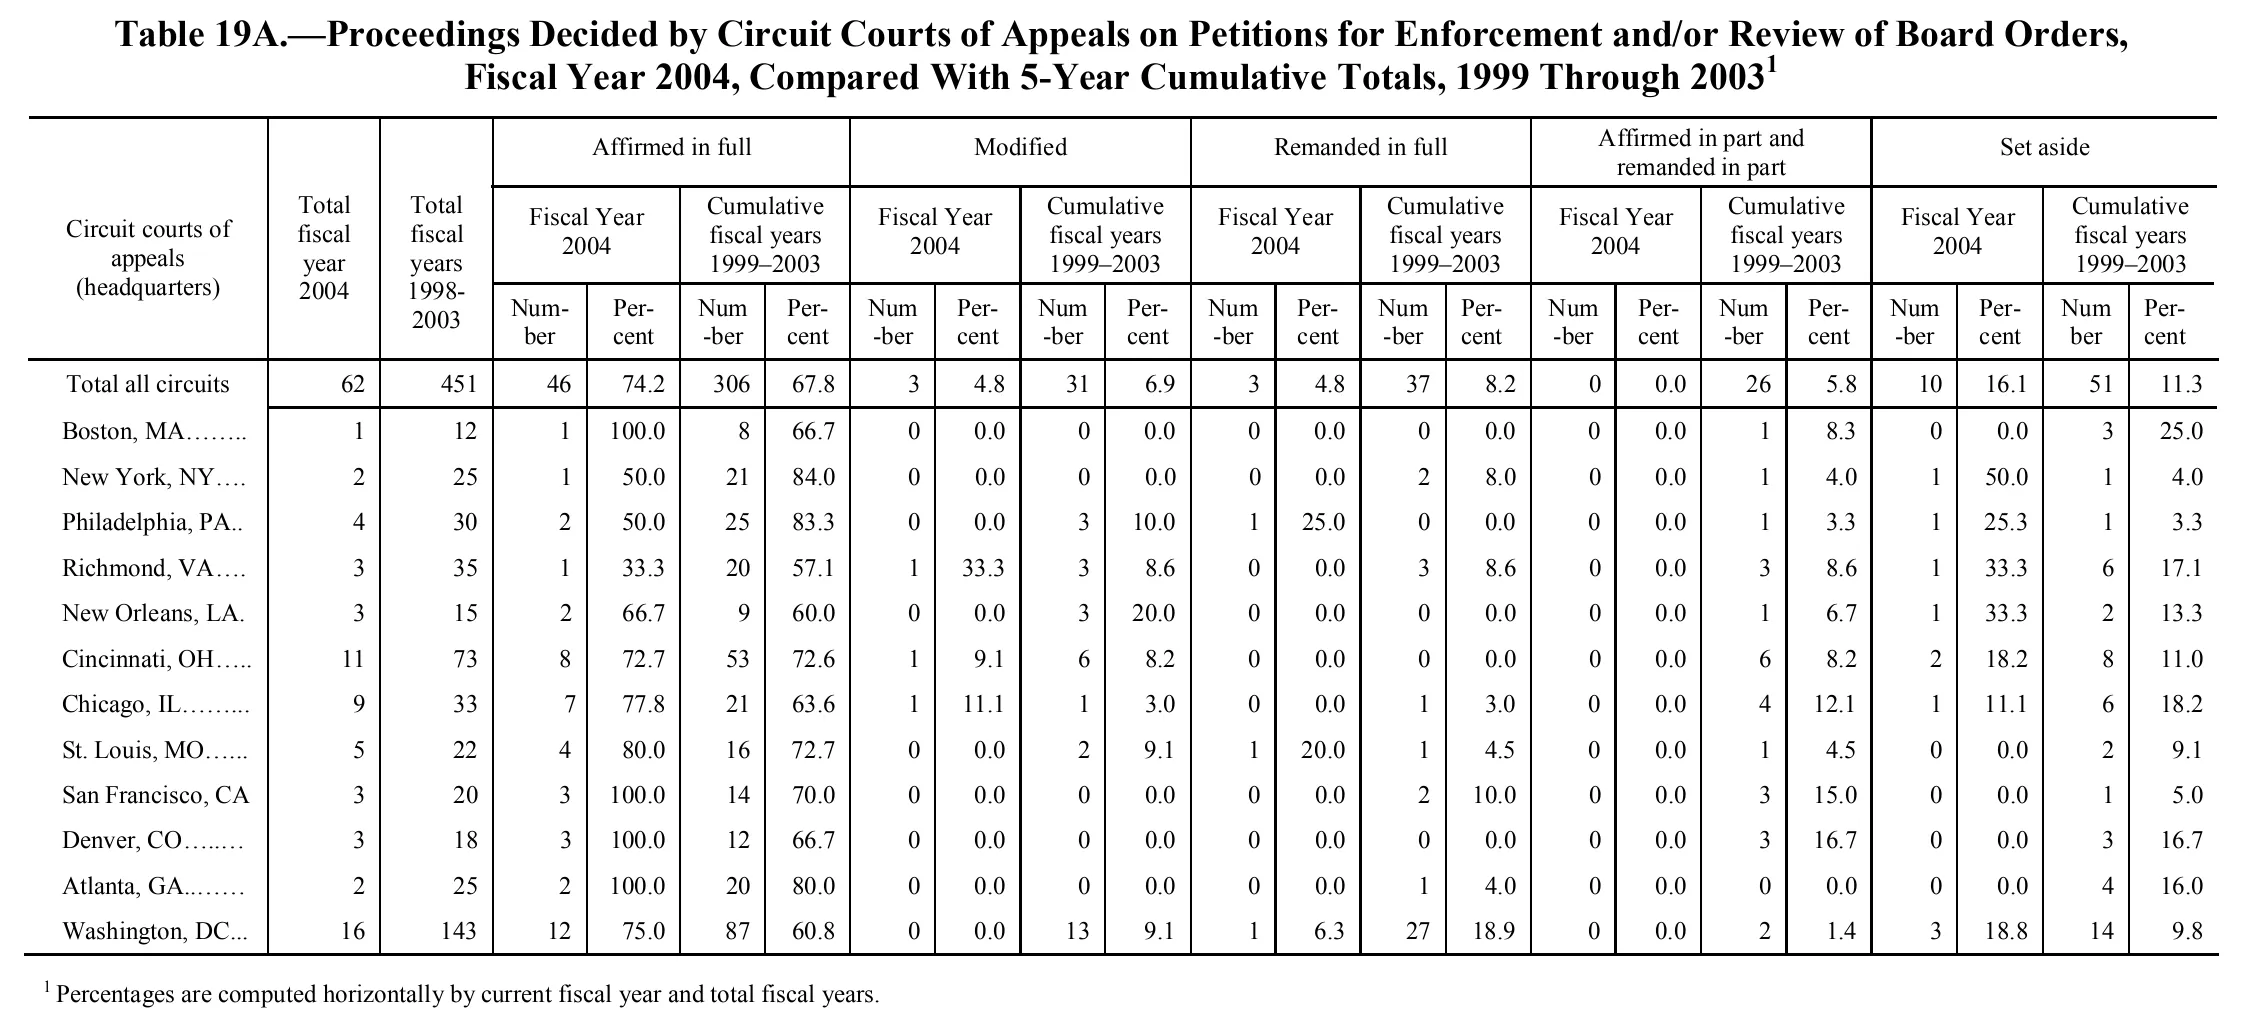
Proceedings Decided by Circuit Courts of Appeals on Petitions for Enforcement and/or Review of Board Orders, Fiscal Year 2004, Compared With 5-Year Cumulative Totals, 1999 Through 2003
| Circuit courts of appeals (headquarters) | Total fiscal year 2004 | Total fiscal years 1998-2003 | Affirmed in full | Modified | Remanded in full | Affirmed in part and remanded in part | Set aside | |||||||||||||||
|---|---|---|---|---|---|---|---|---|---|---|---|---|---|---|---|---|---|---|---|---|---|---|
| Circuit courts of appeals (headquarters) | Total fiscal year 2004 | Total fiscal years 1998-2003 | Fiscal Year 2004 | Cumulative fiscal years 1999–2003 | Fiscal Year 2004 | Cumulative fiscal years 1999–2003 | Fiscal Year 2004 | Cumulative fiscal years 1999–2003 | Fiscal Year 2004 | Cumulative fiscal years 1999–2003 | Fiscal Year 2004 | Cumulative fiscal years 1999–2003 | ||||||||||
| Circuit courts of appeals (headquarters) | Total fiscal year 2004 | Total fiscal years 1998-2003 | Number | Percent | Number | Percent | Number | Percent | Number | Percent | Number | Percent | Number | Percent | Number | Percent | Number | Percent | Number | Percent | Number | Percent |
| Total all circuits | 62 | 451 | 46 | 74.2 | 306 | 67.8 | 3 | 4.8 | 31 | 6.9 | 3 | 4.8 | 37 | 8.2 | 0 | 0.0 | 26 | 5.8 | 10 | 16.1 | 51 | 11.3 |
| Boston, MA | 1 | 12 | 1 | 100.0 | 8 | 66.7 | 0 | 0.0 | 0 | 0.0 | 0 | 0.0 | 0 | 0.0 | 0 | 0.0 | 1 | 8.3 | 0 | 0.0 | 3 | 25.0 |
| New York, NY | 2 | 25 | 1 | 50.0 | 21 | 84.0 | 0 | 0.0 | 0 | 0.0 | 0 | 0.0 | 2 | 8.0 | 0 | 0.0 | 1 | 4.0 | 1 | 50.0 | 1 | 4.0 |
| Philadelphia, PA | 4 | 30 | 2 | 50.0 | 25 | 83.3 | 0 | 0.0 | 3 | 10.0 | 1 | 25.0 | 0 | 0.0 | 0 | 0.0 | 1 | 3.3 | 1 | 25.3 | 1 | 3.3 |
| Richmond, VA | 3 | 35 | 1 | 33.3 | 20 | 57.1 | 1 | 33.3 | 3 | 8.6 | 0 | 0.0 | 3 | 8.6 | 0 | 0.0 | 3 | 8.6 | 1 | 33.3 | 6 | 17.1 |
| New Orleans, LA | 3 | 15 | 2 | 66.7 | 9 | 60.0 | 0 | 0.0 | 3 | 20.0 | 0 | 0.0 | 0 | 0.0 | 0 | 0.0 | 1 | 6.7 | 1 | 33.3 | 2 | 13.3 |
| Cincinnati, OH | 11 | 73 | 8 | 72.7 | 53 | 72.6 | 1 | 9.1 | 6 | 8.2 | 0 | 0.0 | 0 | 0.0 | 0 | 0.0 | 6 | 8.2 | 2 | 18.2 | 8 | 11.0 |
| Chicago, IL | 9 | 33 | 7 | 77.8 | 21 | 63.6 | 1 | 11.1 | 1 | 3.0 | 0 | 0.0 | 1 | 3.0 | 0 | 0.0 | 4 | 12.1 | 1 | 11.1 | 6 | 18.2 |
| St. Louis, MO | 5 | 22 | 4 | 80.0 | 16 | 72.7 | 0 | 0.0 | 2 | 9.1 | 1 | 20.0 | 1 | 4.5 | 0 | 0.0 | 1 | 4.5 | 0 | 0.0 | 2 | 9.1 |
| San Francisco, CA | 3 | 20 | 3 | 100.0 | 14 | 70.0 | 0 | 0.0 | 0 | 0.0 | 0 | 0.0 | 2 | 10.0 | 0 | 0.0 | 3 | 15.0 | 0 | 0.0 | 1 | 5.0 |
| Denver, CO | 3 | 18 | 3 | 100.0 | 12 | 66.7 | 0 | 0.0 | 0 | 0.0 | 0 | 0.0 | 0 | 0.0 | 0 | 0.0 | 3 | 16.7 | 0 | 0.0 | 3 | 16.7 |
| Atlanta, GA | 2 | 25 | 2 | 100.0 | 20 | 80.0 | 0 | 0.0 | 0 | 0.0 | 0 | 0.0 | 1 | 4.0 | 0 | 0.0 | 0 | 0.0 | 0 | 0.0 | 4 | 16.0 |
| Washington, DC | 16 | 143 | 12 | 75.0 | 87 | 60.8 | 0 | 0.0 | 13 | 9.1 | 1 | 6.3 | 27 | 18.9 | 0 | 0.0 | 2 | 1.4 | 3 | 18.8 | 14 | 9.8 |
- 1 Percentages are computed horizontally by current fiscal year and total fiscal years.
109 of 109 figures sit in a row or column sum that works out.
Reader’s notes
p. 258. 23 columns: stub, two "Total" columns, then five Number/Percent pairs for fiscal year 2004 and cumulative fiscal years 1999–2003 under each of the five outcome headings. Two apparent misprints in the source, transcribed as printed: (1) The third column heading reads "Total fiscal years 1998-2003" (printed "1998-" / "2003" on two lines), although the caption and every other cumulative column say 1999 through 2003. Likely a misprint for 1999-2003. (2) Philadelphia, PA, "Set aside / Fiscal Year 2004 / Percent" reads 25.3; with 1 of 4 proceedings the horizontally computed figure should be 25.0. This is the one doubtful digit in the grid — the final character is small and could be a 0 rather than a 3. The stub heading and the two "Total" column headings occupy the full height of the header block and are repeated in all three heading levels. Hyphenated line breaks in the column headings ("Num-ber", "Per-cent") have been rejoined. Leader dots after the circuit row labels were dropped; the trailing period shown after "New Orleans, LA" is a leader dot, not part of the label. Consistency checks: all twelve circuit rows sum correctly to the "Total all circuits" row in every one of the 22 numeric-count and percent columns' count fields (62, 451, 46, 306, 3, 31, 3, 37, 0, 26, 10, 51), and each circuit's five fiscal-year-2004 outcome counts sum to its fiscal year 2004 total.
Source image
Source data: U.S. NLRB Annual Reports (public domain). Reconstruction by NLRB Stats Archive. Read by claude-opus-5 (effort max, prompt extract_v1) from the 300-dpi scan; stitched by page. Updated October 2026.