NLRB Stats Archive › Annual Reports › FY2004 › Distribution of Unfair Labor Practice Situations Received, by Number of Employees in Establishments, Fiscal Year 2004
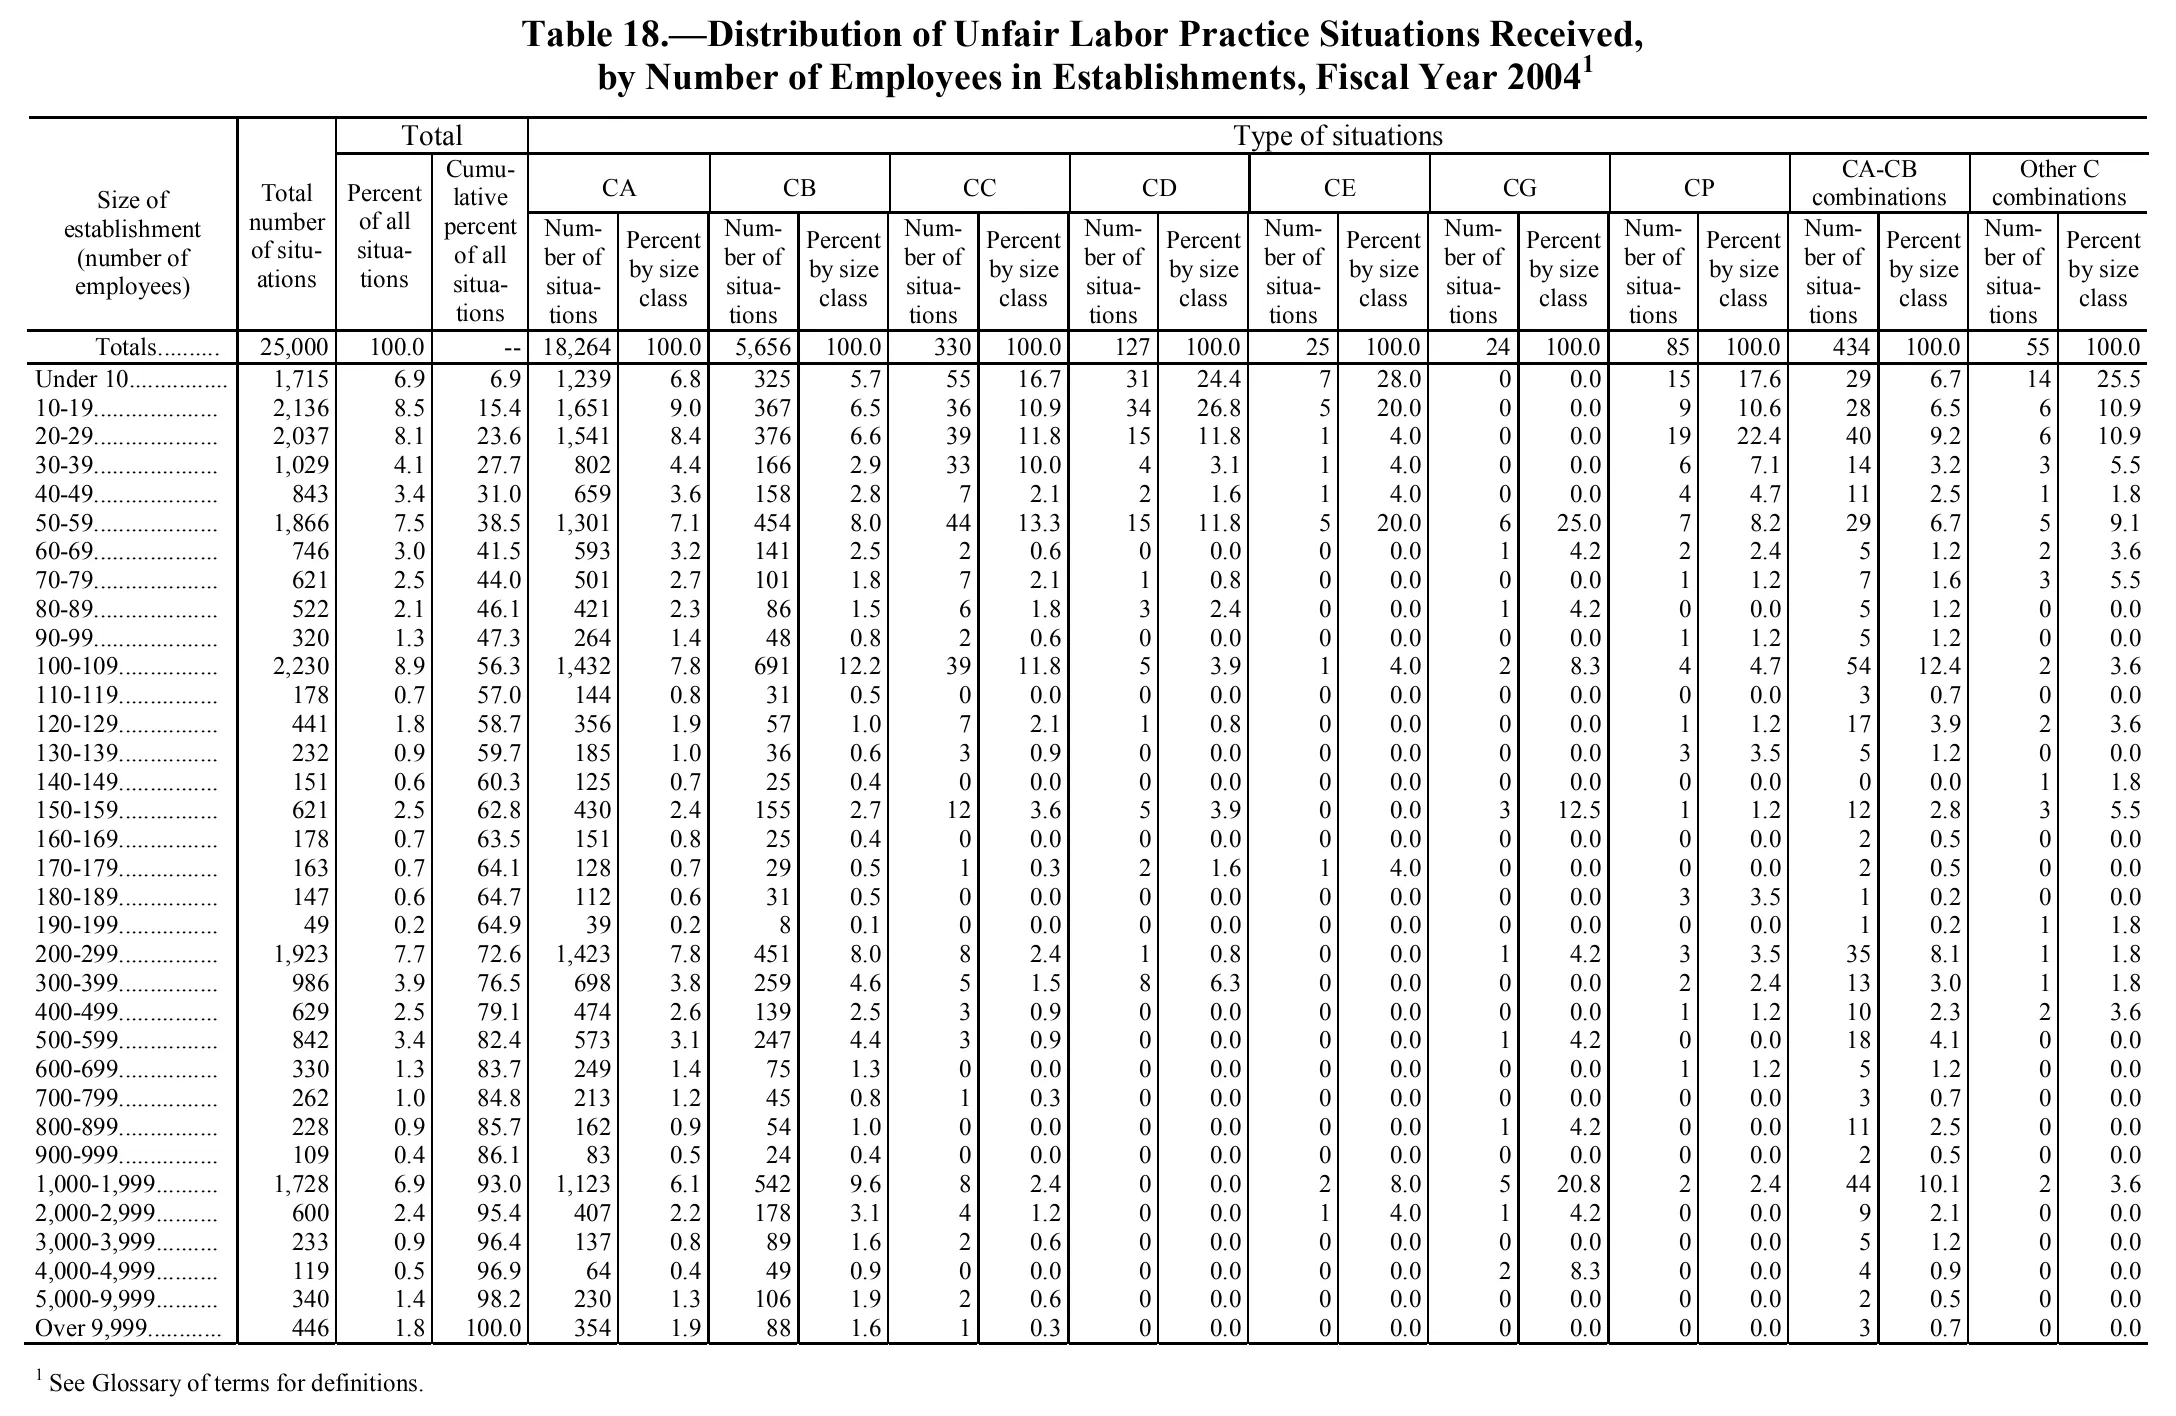
Distribution of Unfair Labor Practice Situations Received, by Number of Employees in Establishments, Fiscal Year 2004
| Size of establishment (number of employees) | Total number of situations | Total | Type of situations | ||||||||||||||||||
|---|---|---|---|---|---|---|---|---|---|---|---|---|---|---|---|---|---|---|---|---|---|
| Size of establishment (number of employees) | Total number of situations | Percent of all situations | Cumulative percent of all situations | CA | CB | CC | CD | CE | CG | CP | CA-CB combinations | Other C combinations | |||||||||
| Size of establishment (number of employees) | Total number of situations | Percent of all situations | Cumulative percent of all situations | Number of situations | Percent by size class | Number of situations | Percent by size class | Number of situations | Percent by size class | Number of situations | Percent by size class | Number of situations | Percent by size class | Number of situations | Percent by size class | Number of situations | Percent by size class | Number of situations | Percent by size class | Number of situations | Percent by size class |
| Totals | 25,000 | 100.0 | 18,264 | 100.0 | 5,656 | 100.0 | 330 | 100.0 | 127 | 100.0 | 25 | 100.0 | 24 | 100.0 | 85 | 100.0 | 434 | 100.0 | 55 | 100.0 | |
| Under 10 | 1,715 | 6.9 | 6.9 | 1,239 | 6.8 | 325 | 5.7 | 55 | 16.7 | 31 | 24.4 | 7 | 28.0 | 0 | 0.0 | 15 | 17.6 | 29 | 6.7 | 14 | 25.5 |
| 10-19 | 2,136 | 8.5 | 15.4 | 1,651 | 9.0 | 367 | 6.5 | 36 | 10.9 | 34 | 26.8 | 5 | 20.0 | 0 | 0.0 | 9 | 10.6 | 28 | 6.5 | 6 | 10.9 |
| 20-29 | 2,037 | 8.1 | 23.6 | 1,541 | 8.4 | 376 | 6.6 | 39 | 11.8 | 15 | 11.8 | 1 | 4.0 | 0 | 0.0 | 19 | 22.4 | 40 | 9.2 | 6 | 10.9 |
| 30-39 | 1,029 | 4.1 | 27.7 | 802 | 4.4 | 166 | 2.9 | 33 | 10.0 | 4 | 3.1 | 1 | 4.0 | 0 | 0.0 | 6 | 7.1 | 14 | 3.2 | 3 | 5.5 |
| 40-49 | 843 | 3.4 | 31.0 | 659 | 3.6 | 158 | 2.8 | 7 | 2.1 | 2 | 1.6 | 1 | 4.0 | 0 | 0.0 | 4 | 4.7 | 11 | 2.5 | 1 | 1.8 |
| 50-59 | 1,866 | 7.5 | 38.5 | 1,301 | 7.1 | 454 | 8.0 | 44 | 13.3 | 15 | 11.8 | 5 | 20.0 | 6 | 25.0 | 7 | 8.2 | 29 | 6.7 | 5 | 9.1 |
| 60-69 | 746 | 3.0 | 41.5 | 593 | 3.2 | 141 | 2.5 | 2 | 0.6 | 0 | 0.0 | 0 | 0.0 | 1 | 4.2 | 2 | 2.4 | 5 | 1.2 | 2 | 3.6 |
| 70-79 | 621 | 2.5 | 44.0 | 501 | 2.7 | 101 | 1.8 | 7 | 2.1 | 1 | 0.8 | 0 | 0.0 | 0 | 0.0 | 1 | 1.2 | 7 | 1.6 | 3 | 5.5 |
| 80-89 | 522 | 2.1 | 46.1 | 421 | 2.3 | 86 | 1.5 | 6 | 1.8 | 3 | 2.4 | 0 | 0.0 | 1 | 4.2 | 0 | 0.0 | 5 | 1.2 | 0 | 0.0 |
| 90-99 | 320 | 1.3 | 47.3 | 264 | 1.4 | 48 | 0.8 | 2 | 0.6 | 0 | 0.0 | 0 | 0.0 | 0 | 0.0 | 1 | 1.2 | 5 | 1.2 | 0 | 0.0 |
| 100-109 | 2,230 | 8.9 | 56.3 | 1,432 | 7.8 | 691 | 12.2 | 39 | 11.8 | 5 | 3.9 | 1 | 4.0 | 2 | 8.3 | 4 | 4.7 | 54 | 12.4 | 2 | 3.6 |
| 110-119 | 178 | 0.7 | 57.0 | 144 | 0.8 | 31 | 0.5 | 0 | 0.0 | 0 | 0.0 | 0 | 0.0 | 0 | 0.0 | 0 | 0.0 | 3 | 0.7 | 0 | 0.0 |
| 120-129 | 441 | 1.8 | 58.7 | 356 | 1.9 | 57 | 1.0 | 7 | 2.1 | 1 | 0.8 | 0 | 0.0 | 0 | 0.0 | 1 | 1.2 | 17 | 3.9 | 2 | 3.6 |
| 130-139 | 232 | 0.9 | 59.7 | 185 | 1.0 | 36 | 0.6 | 3 | 0.9 | 0 | 0.0 | 0 | 0.0 | 0 | 0.0 | 3 | 3.5 | 5 | 1.2 | 0 | 0.0 |
| 140-149 | 151 | 0.6 | 60.3 | 125 | 0.7 | 25 | 0.4 | 0 | 0.0 | 0 | 0.0 | 0 | 0.0 | 0 | 0.0 | 0 | 0.0 | 0 | 0.0 | 1 | 1.8 |
| 150-159 | 621 | 2.5 | 62.8 | 430 | 2.4 | 155 | 2.7 | 12 | 3.6 | 5 | 3.9 | 0 | 0.0 | 3 | 12.5 | 1 | 1.2 | 12 | 2.8 | 3 | 5.5 |
| 160-169 | 178 | 0.7 | 63.5 | 151 | 0.8 | 25 | 0.4 | 0 | 0.0 | 0 | 0.0 | 0 | 0.0 | 0 | 0.0 | 0 | 0.0 | 2 | 0.5 | 0 | 0.0 |
| 170-179 | 163 | 0.7 | 64.1 | 128 | 0.7 | 29 | 0.5 | 1 | 0.3 | 2 | 1.6 | 1 | 4.0 | 0 | 0.0 | 0 | 0.0 | 2 | 0.5 | 0 | 0.0 |
| 180-189 | 147 | 0.6 | 64.7 | 112 | 0.6 | 31 | 0.5 | 0 | 0.0 | 0 | 0.0 | 0 | 0.0 | 0 | 0.0 | 3 | 3.5 | 1 | 0.2 | 0 | 0.0 |
| 190-199 | 49 | 0.2 | 64.9 | 39 | 0.2 | 8 | 0.1 | 0 | 0.0 | 0 | 0.0 | 0 | 0.0 | 0 | 0.0 | 0 | 0.0 | 1 | 0.2 | 1 | 1.8 |
| 200-299 | 1,923 | 7.7 | 72.6 | 1,423 | 7.8 | 451 | 8.0 | 8 | 2.4 | 1 | 0.8 | 0 | 0.0 | 1 | 4.2 | 3 | 3.5 | 35 | 8.1 | 1 | 1.8 |
| 300-399 | 986 | 3.9 | 76.5 | 698 | 3.8 | 259 | 4.6 | 5 | 1.5 | 8 | 6.3 | 0 | 0.0 | 0 | 0.0 | 2 | 2.4 | 13 | 3.0 | 1 | 1.8 |
| 400-499 | 629 | 2.5 | 79.1 | 474 | 2.6 | 139 | 2.5 | 3 | 0.9 | 0 | 0.0 | 0 | 0.0 | 0 | 0.0 | 1 | 1.2 | 10 | 2.3 | 2 | 3.6 |
| 500-599 | 842 | 3.4 | 82.4 | 573 | 3.1 | 247 | 4.4 | 3 | 0.9 | 0 | 0.0 | 0 | 0.0 | 1 | 4.2 | 0 | 0.0 | 18 | 4.1 | 0 | 0.0 |
| 600-699 | 330 | 1.3 | 83.7 | 249 | 1.4 | 75 | 1.3 | 0 | 0.0 | 0 | 0.0 | 0 | 0.0 | 0 | 0.0 | 1 | 1.2 | 5 | 1.2 | 0 | 0.0 |
| 700-799 | 262 | 1.0 | 84.8 | 213 | 1.2 | 45 | 0.8 | 1 | 0.3 | 0 | 0.0 | 0 | 0.0 | 0 | 0.0 | 0 | 0.0 | 3 | 0.7 | 0 | 0.0 |
| 800-899 | 228 | 0.9 | 85.7 | 162 | 0.9 | 54 | 1.0 | 0 | 0.0 | 0 | 0.0 | 0 | 0.0 | 1 | 4.2 | 0 | 0.0 | 11 | 2.5 | 0 | 0.0 |
| 900-999 | 109 | 0.4 | 86.1 | 83 | 0.5 | 24 | 0.4 | 0 | 0.0 | 0 | 0.0 | 0 | 0.0 | 0 | 0.0 | 0 | 0.0 | 2 | 0.5 | 0 | 0.0 |
| 1,000-1,999 | 1,728 | 6.9 | 93.0 | 1,123 | 6.1 | 542 | 9.6 | 8 | 2.4 | 0 | 0.0 | 2 | 8.0 | 5 | 20.8 | 2 | 2.4 | 44 | 10.1 | 2 | 3.6 |
| 2,000-2,999 | 600 | 2.4 | 95.4 | 407 | 2.2 | 178 | 3.1 | 4 | 1.2 | 0 | 0.0 | 1 | 4.0 | 1 | 4.2 | 0 | 0.0 | 9 | 2.1 | 0 | 0.0 |
| 3,000-3,999 | 233 | 0.9 | 96.4 | 137 | 0.8 | 89 | 1.6 | 2 | 0.6 | 0 | 0.0 | 0 | 0.0 | 0 | 0.0 | 0 | 0.0 | 5 | 1.2 | 0 | 0.0 |
| 4,000-4,999 | 119 | 0.5 | 96.9 | 64 | 0.4 | 49 | 0.9 | 0 | 0.0 | 0 | 0.0 | 0 | 0.0 | 2 | 8.3 | 0 | 0.0 | 4 | 0.9 | 0 | 0.0 |
| 5,000-9,999 | 340 | 1.4 | 98.2 | 230 | 1.3 | 106 | 1.9 | 2 | 0.6 | 0 | 0.0 | 0 | 0.0 | 0 | 0.0 | 0 | 0.0 | 2 | 0.5 | 0 | 0.0 |
| Over 9,999 | 446 | 1.8 | 100.0 | 354 | 1.9 | 88 | 1.6 | 1 | 0.3 | 0 | 0.0 | 0 | 0.0 | 0 | 0.0 | 0 | 0.0 | 3 | 0.7 | 0 | 0.0 |
- 1 See Glossary of terms for definitions.
241 of 241 figures sit in a row or column sum that works out.
Reader’s notes
p. 256. Grid is 22 columns: stub, "Total number of situations", the two "Total" percent columns, then a Number/Percent pair for each of CA, CB, CC, CD, CE, CG, CP, CA-CB combinations and Other C combinations. In the "Totals" row the "Cumulative percent of all situations" cell holds a short dash rule ("--"), i.e. not applicable; per the dash-rule convention it is transcribed as an empty cell. Arithmetic observations (transcribed exactly as printed, not corrected): the "Totals" row gives 25,000 total situations, but the type-of-situation totals sum to 18,264 + 5,656 + 330 + 127 + 25 + 24 + 85 + 434 + 55 = 25,000, which is consistent; the column of "Total number of situations" down the size classes sums to about 25,043, slightly above the printed 25,000, and several type columns likewise differ by a unit or two from their printed totals (e.g. the CA column sums near 18,300). These look like printed/rounding artifacts in the source. The totals row figure 25,000 is itself suspiciously round for a count of situations, but it is what is printed. All printed zeros are transcribed as "0" / "0.0". No footnote markers appear in the body; the only marker (superscript 1) is on the caption, which is excluded.
Source image
Source data: U.S. NLRB Annual Reports (public domain). Reconstruction by NLRB Stats Archive. Read by claude-opus-5 (effort max, prompt extract_v1) from the 300-dpi scan; stitched by page. Updated October 2026.