NLRB Stats Archive › Annual Reports › FY2003 › Results of Rerun Elections Held in Representation Cases Closed, Fiscal Year 2003
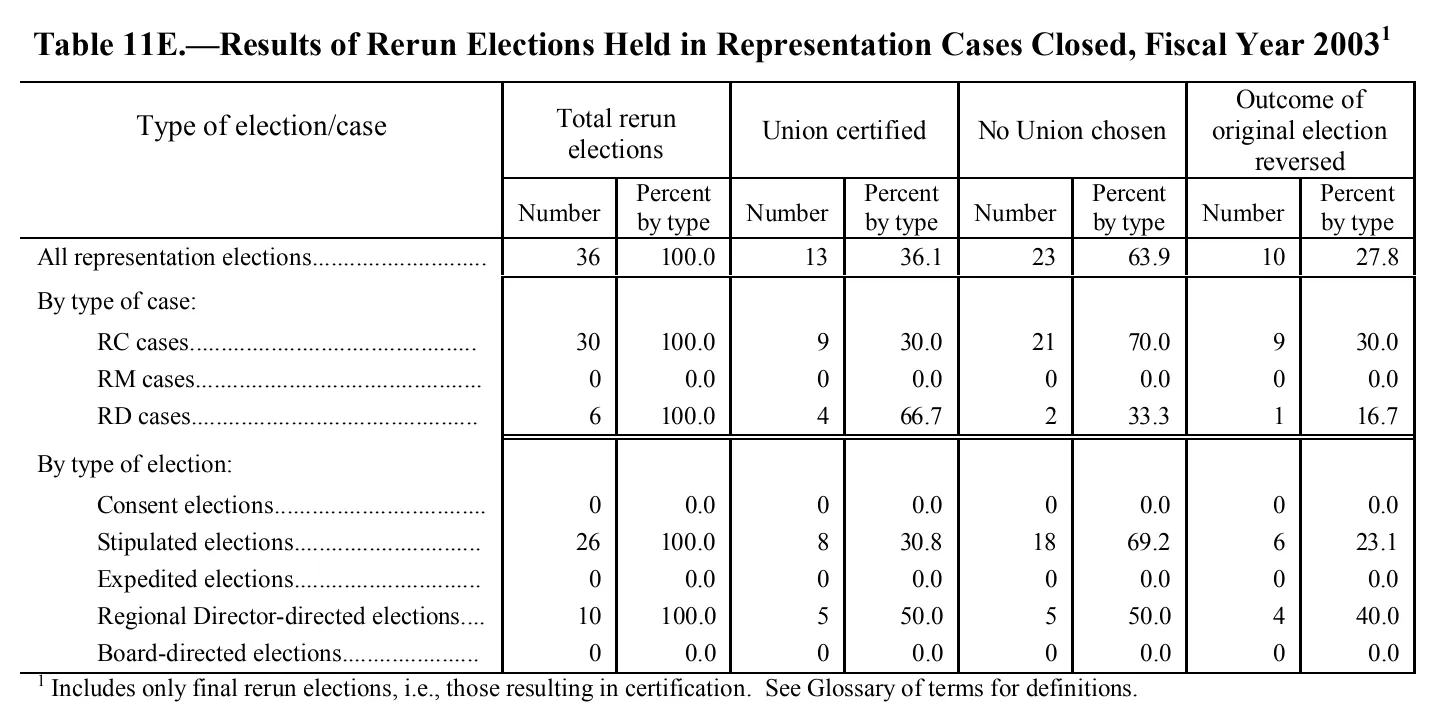
Results of Rerun Elections Held in Representation Cases Closed, Fiscal Year 2003
| Type of election/case | Total rerun elections | Union certified | No Union chosen | Outcome of original election reversed | ||||
|---|---|---|---|---|---|---|---|---|
| Type of election/case | Number | Percent by type | Number | Percent by type | Number | Percent by type | Number | Percent by type |
| All representation elections | 36 | 100.0 | 13 | 36.1 | 23 | 63.9 | 10 | 27.8 |
| By type of case: | ||||||||
| RC cases | 30 | 100.0 | 9 | 30.0 | 21 | 70.0 | 9 | 30.0 |
| RM cases | 0 | 0.0 | 0 | 0.0 | 0 | 0.0 | 0 | 0.0 |
| RD cases | 6 | 100.0 | 4 | 66.7 | 2 | 33.3 | 1 | 16.7 |
| By type of election: | ||||||||
| Consent elections | 0 | 0.0 | 0 | 0.0 | 0 | 0.0 | 0 | 0.0 |
| Stipulated elections | 26 | 100.0 | 8 | 30.8 | 18 | 69.2 | 6 | 23.1 |
| Expedited elections | 0 | 0.0 | 0 | 0.0 | 0 | 0.0 | 0 | 0.0 |
| Regional Director-directed elections | 10 | 100.0 | 5 | 50.0 | 5 | 50.0 | 4 | 40.0 |
| Board-directed elections | 0 | 0.0 | 0 | 0.0 | 0 | 0.0 | 0 | 0.0 |
- 1 Includes only final rerun elections, i.e., those resulting in certification. See Glossary of terms for definitions.
18 of 20 figures sit in a row or column sum that works out.
Reader’s notes
p. 167. Nine columns: the stub plus four two-column panels (Number / Percent by type) under the spanning headings. The image is clean and fully legible; no cells were doubtful. The footnote marker 1 appears only on the caption (Fiscal Year 2003^1), which is excluded per instructions. Arithmetic checks (not corrected, only noted as consistent): RC+RM+RD = 30+0+6 = 36, and the by-type-of-election rows 0+26+0+10+0 = 36, both matching the "All representation elections" total of 36.
Source image
Source data: U.S. NLRB Annual Reports (public domain). Reconstruction by NLRB Stats Archive. Read by claude-opus-5 (effort max, prompt extract_v1) from the 300-dpi scan; stitched by page. Updated October 2026.