NLRB Stats Archive › Annual Reports › FY2002 › Proceedings Decided by Circuit Courts of Appeals on Petitions for Enforcement and/or Review of Board Orders, Fiscal Year 2002, Compared With 5-Year Cumulative Totals, 1997 Through 2001
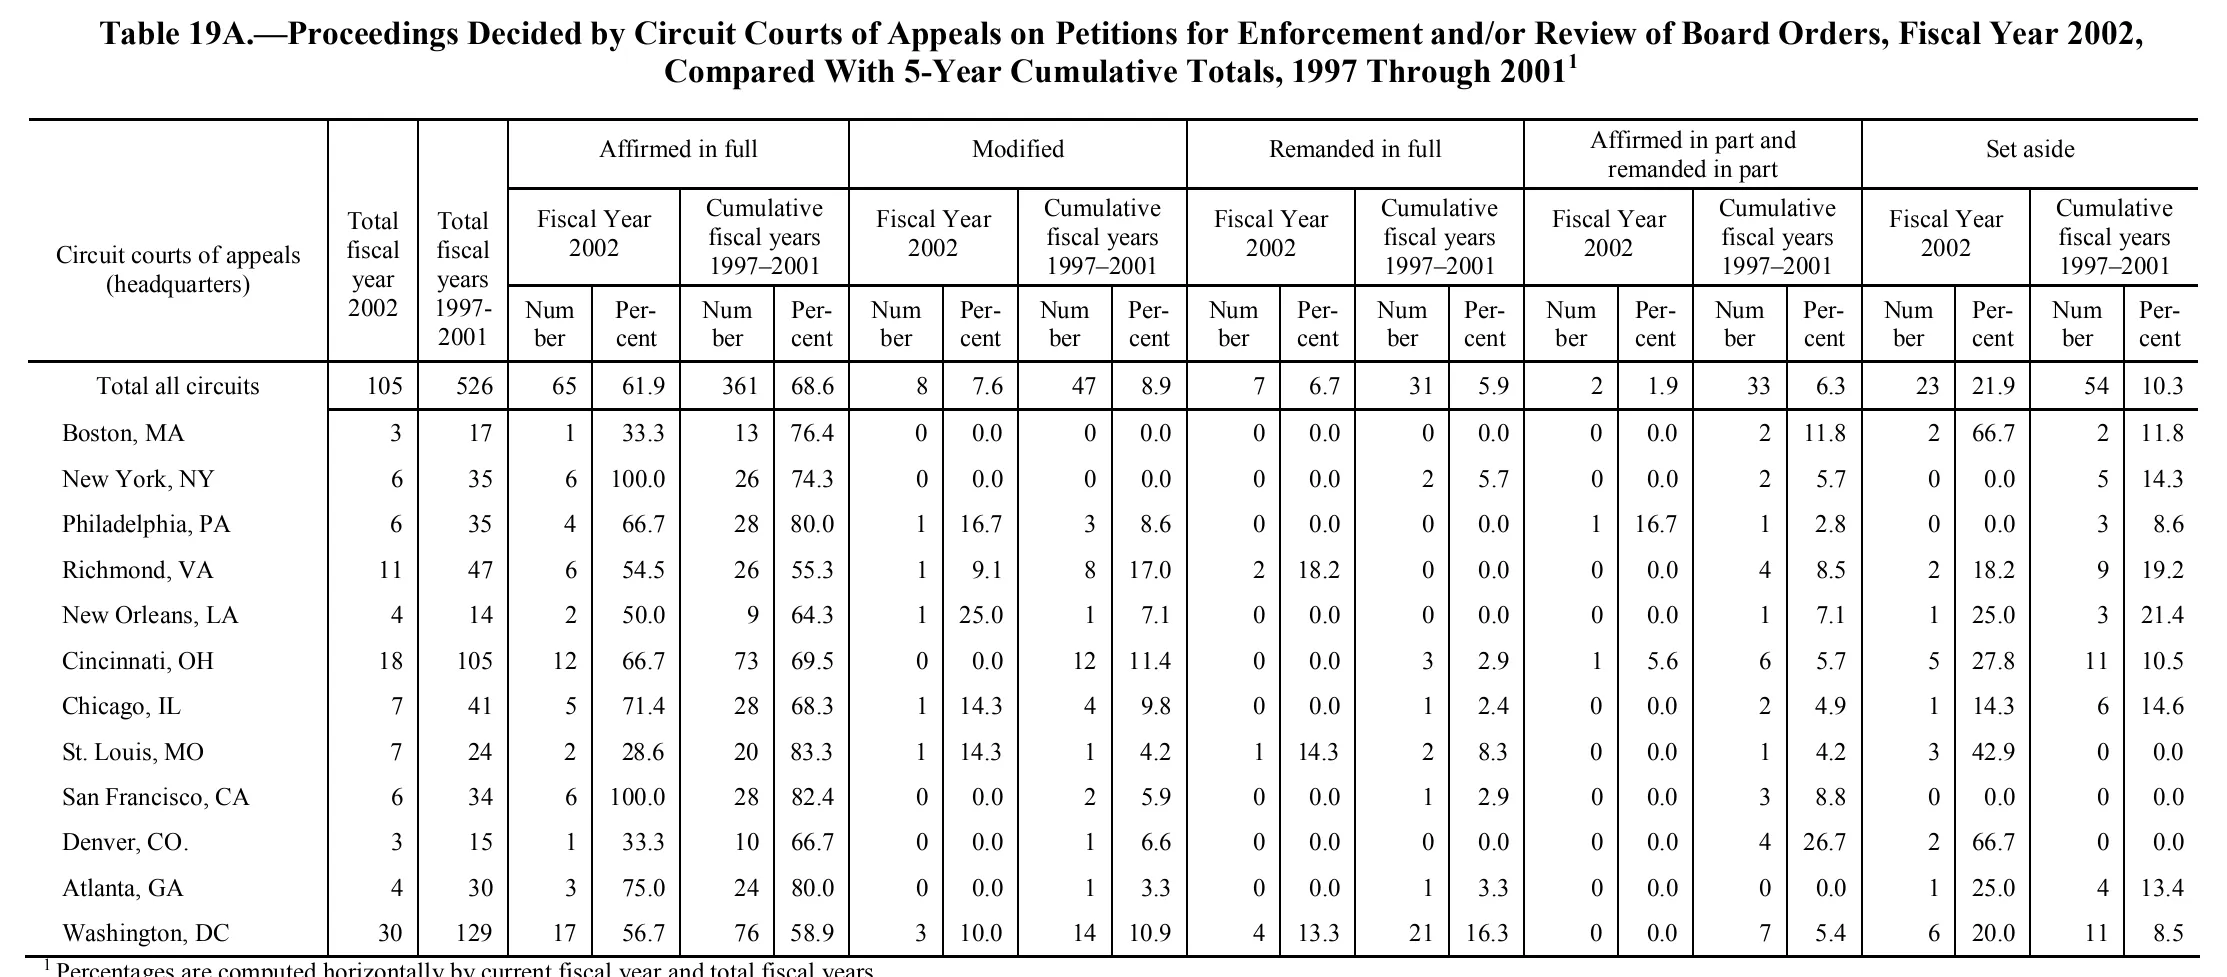
Proceedings Decided by Circuit Courts of Appeals on Petitions for Enforcement and/or Review of Board Orders, Fiscal Year 2002, Compared With 5-Year Cumulative Totals, 1997 Through 2001
| Circuit courts of appeals (headquarters) | Total fiscal year 2002 | Total fiscal years 1997-2001 | Affirmed in full | Modified | Remanded in full | Affirmed in part and remanded in part | Set aside | |||||||||||||||
|---|---|---|---|---|---|---|---|---|---|---|---|---|---|---|---|---|---|---|---|---|---|---|
| Circuit courts of appeals (headquarters) | Total fiscal year 2002 | Total fiscal years 1997-2001 | Fiscal Year 2002 | Cumulative fiscal years 1997–2001 | Fiscal Year 2002 | Cumulative fiscal years 1997–2001 | Fiscal Year 2002 | Cumulative fiscal years 1997–2001 | Fiscal Year 2002 | Cumulative fiscal years 1997–2001 | Fiscal Year 2002 | Cumulative fiscal years 1997–2001 | ||||||||||
| Circuit courts of appeals (headquarters) | Total fiscal year 2002 | Total fiscal years 1997-2001 | Number | Percent | Number | Percent | Number | Percent | Number | Percent | Number | Percent | Number | Percent | Number | Percent | Number | Percent | Number | Percent | Number | Percent |
| Total all circuits | 105 | 526 | 65 | 61.9 | 361 | 68.6 | 8 | 7.6 | 47 | 8.9 | 7 | 6.7 | 31 | 5.9 | 2 | 1.9 | 33 | 6.3 | 23 | 21.9 | 54 | 10.3 |
| Boston, MA | 3 | 17 | 1 | 33.3 | 13 | 76.4 | 0 | 0.0 | 0 | 0.0 | 0 | 0.0 | 0 | 0.0 | 0 | 0.0 | 2 | 11.8 | 2 | 66.7 | 2 | 11.8 |
| New York, NY | 6 | 35 | 6 | 100.0 | 26 | 74.3 | 0 | 0.0 | 0 | 0.0 | 0 | 0.0 | 2 | 5.7 | 0 | 0.0 | 2 | 5.7 | 0 | 0.0 | 5 | 14.3 |
| Philadelphia, PA | 6 | 35 | 4 | 66.7 | 28 | 80.0 | 1 | 16.7 | 3 | 8.6 | 0 | 0.0 | 0 | 0.0 | 1 | 16.7 | 1 | 2.8 | 0 | 0.0 | 3 | 8.6 |
| Richmond, VA | 11 | 47 | 6 | 54.5 | 26 | 55.3 | 1 | 9.1 | 8 | 17.0 | 2 | 18.2 | 0 | 0.0 | 0 | 0.0 | 4 | 8.5 | 2 | 18.2 | 9 | 19.2 |
| New Orleans, LA | 4 | 14 | 2 | 50.0 | 9 | 64.3 | 1 | 25.0 | 1 | 7.1 | 0 | 0.0 | 0 | 0.0 | 0 | 0.0 | 1 | 7.1 | 1 | 25.0 | 3 | 21.4 |
| Cincinnati, OH | 18 | 105 | 12 | 66.7 | 73 | 69.5 | 0 | 0.0 | 12 | 11.4 | 0 | 0.0 | 3 | 2.9 | 1 | 5.6 | 6 | 5.7 | 5 | 27.8 | 11 | 10.5 |
| Chicago, IL | 7 | 41 | 5 | 71.4 | 28 | 68.3 | 1 | 14.3 | 4 | 9.8 | 0 | 0.0 | 1 | 2.4 | 0 | 0.0 | 2 | 4.9 | 1 | 14.3 | 6 | 14.6 |
| St. Louis, MO | 7 | 24 | 2 | 28.6 | 20 | 83.3 | 1 | 14.3 | 1 | 4.2 | 1 | 14.3 | 2 | 8.3 | 0 | 0.0 | 1 | 4.2 | 3 | 42.9 | 0 | 0.0 |
| San Francisco, CA | 6 | 34 | 6 | 100.0 | 28 | 82.4 | 0 | 0.0 | 2 | 5.9 | 0 | 0.0 | 1 | 2.9 | 0 | 0.0 | 3 | 8.8 | 0 | 0.0 | 0 | 0.0 |
| Denver, CO. | 3 | 15 | 1 | 33.3 | 10 | 66.7 | 0 | 0.0 | 1 | 6.6 | 0 | 0.0 | 0 | 0.0 | 0 | 0.0 | 4 | 26.7 | 2 | 66.7 | 0 | 0.0 |
| Atlanta, GA | 4 | 30 | 3 | 75.0 | 24 | 80.0 | 0 | 0.0 | 1 | 3.3 | 0 | 0.0 | 1 | 3.3 | 0 | 0.0 | 0 | 0.0 | 1 | 25.0 | 4 | 13.4 |
| Washington, DC | 30 | 129 | 17 | 56.7 | 76 | 58.9 | 3 | 10.0 | 14 | 10.9 | 4 | 13.3 | 21 | 16.3 | 0 | 0.0 | 7 | 5.4 | 6 | 20.0 | 11 | 8.5 |
- 1 Percentages are computed horizontally by current fiscal year and total fiscal years.
117 of 117 figures sit in a row or column sum that works out.
Reader’s notes
p. 148. 23 columns: stub, two \"Total\" columns, then five disposition blocks (Affirmed in full; Modified; Remanded in full; Affirmed in part and remanded in part; Set aside), each with Number/Percent for Fiscal Year 2002 and for Cumulative fiscal years 1997–2001.\n\nThe two \"Total\" column headings and the stub heading are tall single headings spanning all three heading levels, so they are repeated in each level. In the \"Total fiscal years 1997-2001\" heading the year range is broken across printed lines (\"1997-\" / \"2001\") with a short hyphen; the in-body block headings print it as \"1997–2001\" with an en dash, and I kept that distinction.\n\nAll row and column arithmetic checks out: the five FY2002 \"Number\" cells sum to the FY2002 total in every row, the five cumulative \"Number\" cells sum to the 1997–2001 total in every row, and the twelve circuit rows sum to the printed \"Total all circuits\" figures (105 and 526).\n\nTwo printed percentages are off by one in the last digit from the figures they are computed on, transcribed as printed: Denver, CO. — Modified, Cumulative fiscal years 1997–2001, Percent reads 6.6 (1/15 = 6.7); Atlanta, GA — Set aside, Cumulative fiscal years 1997–2001, Percent reads 13.4 (4/30 = 13.3).\n\nThe footnote line at the bottom of the crop is clipped by about the lower half of its letterforms but is legible with certainty.
Source image
Source data: U.S. NLRB Annual Reports (public domain). Reconstruction by NLRB Stats Archive. Read by claude-opus-5 (effort max, prompt extract_v1) from the 300-dpi scan; stitched by page. Updated October 2026.