NLRB Stats Archive › Annual Reports › FY2002 › Geographic Distribution of Decertification Elections Held in Cases Closed, Fiscal Year 2002
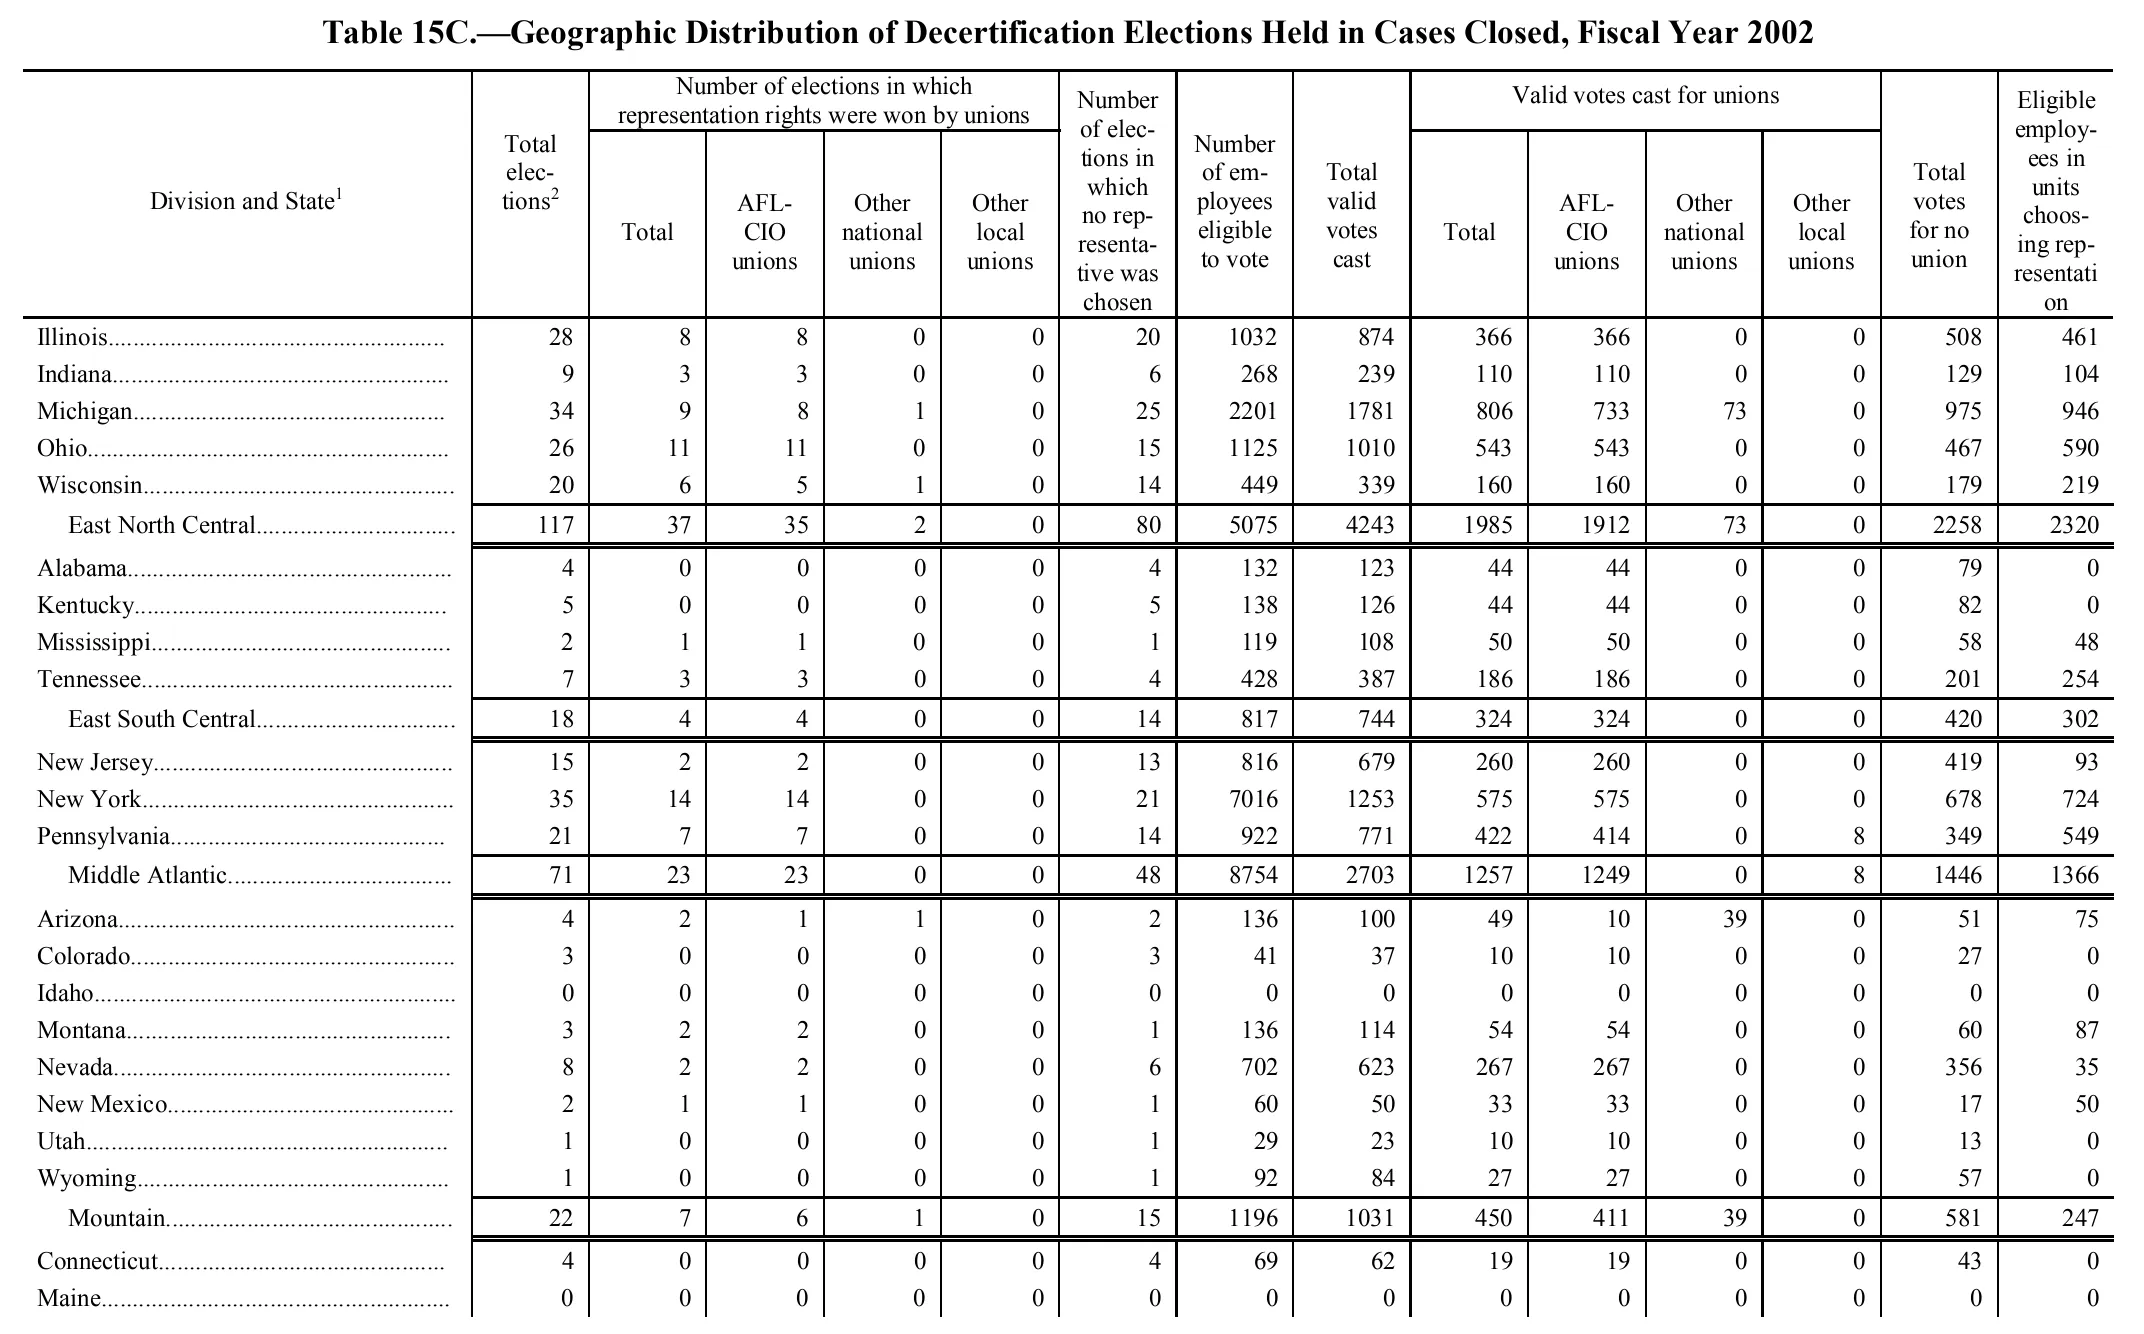
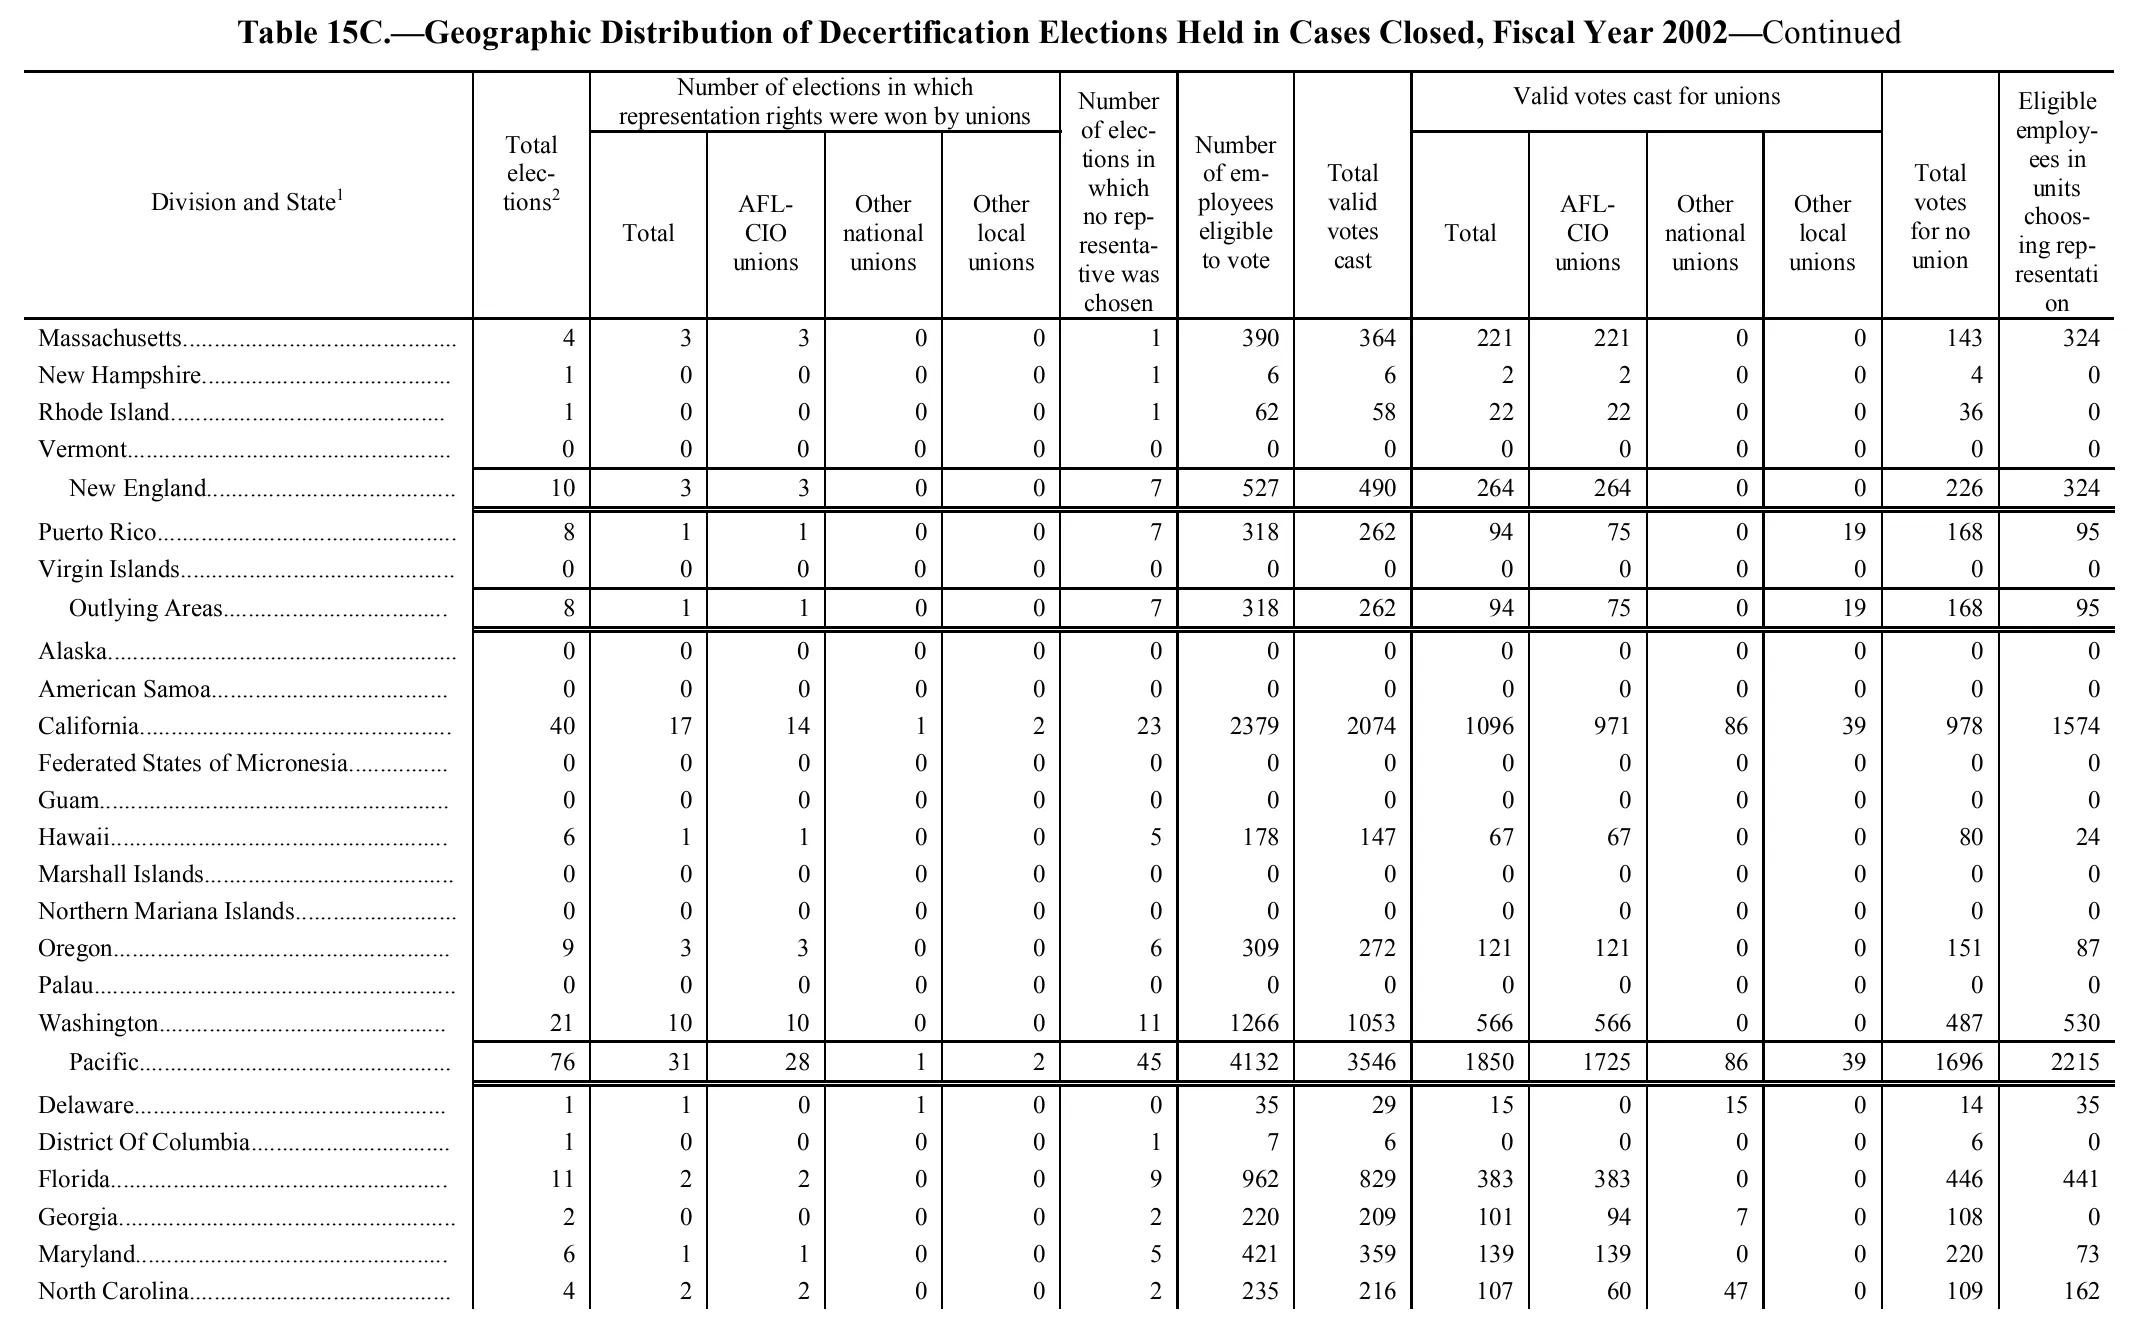
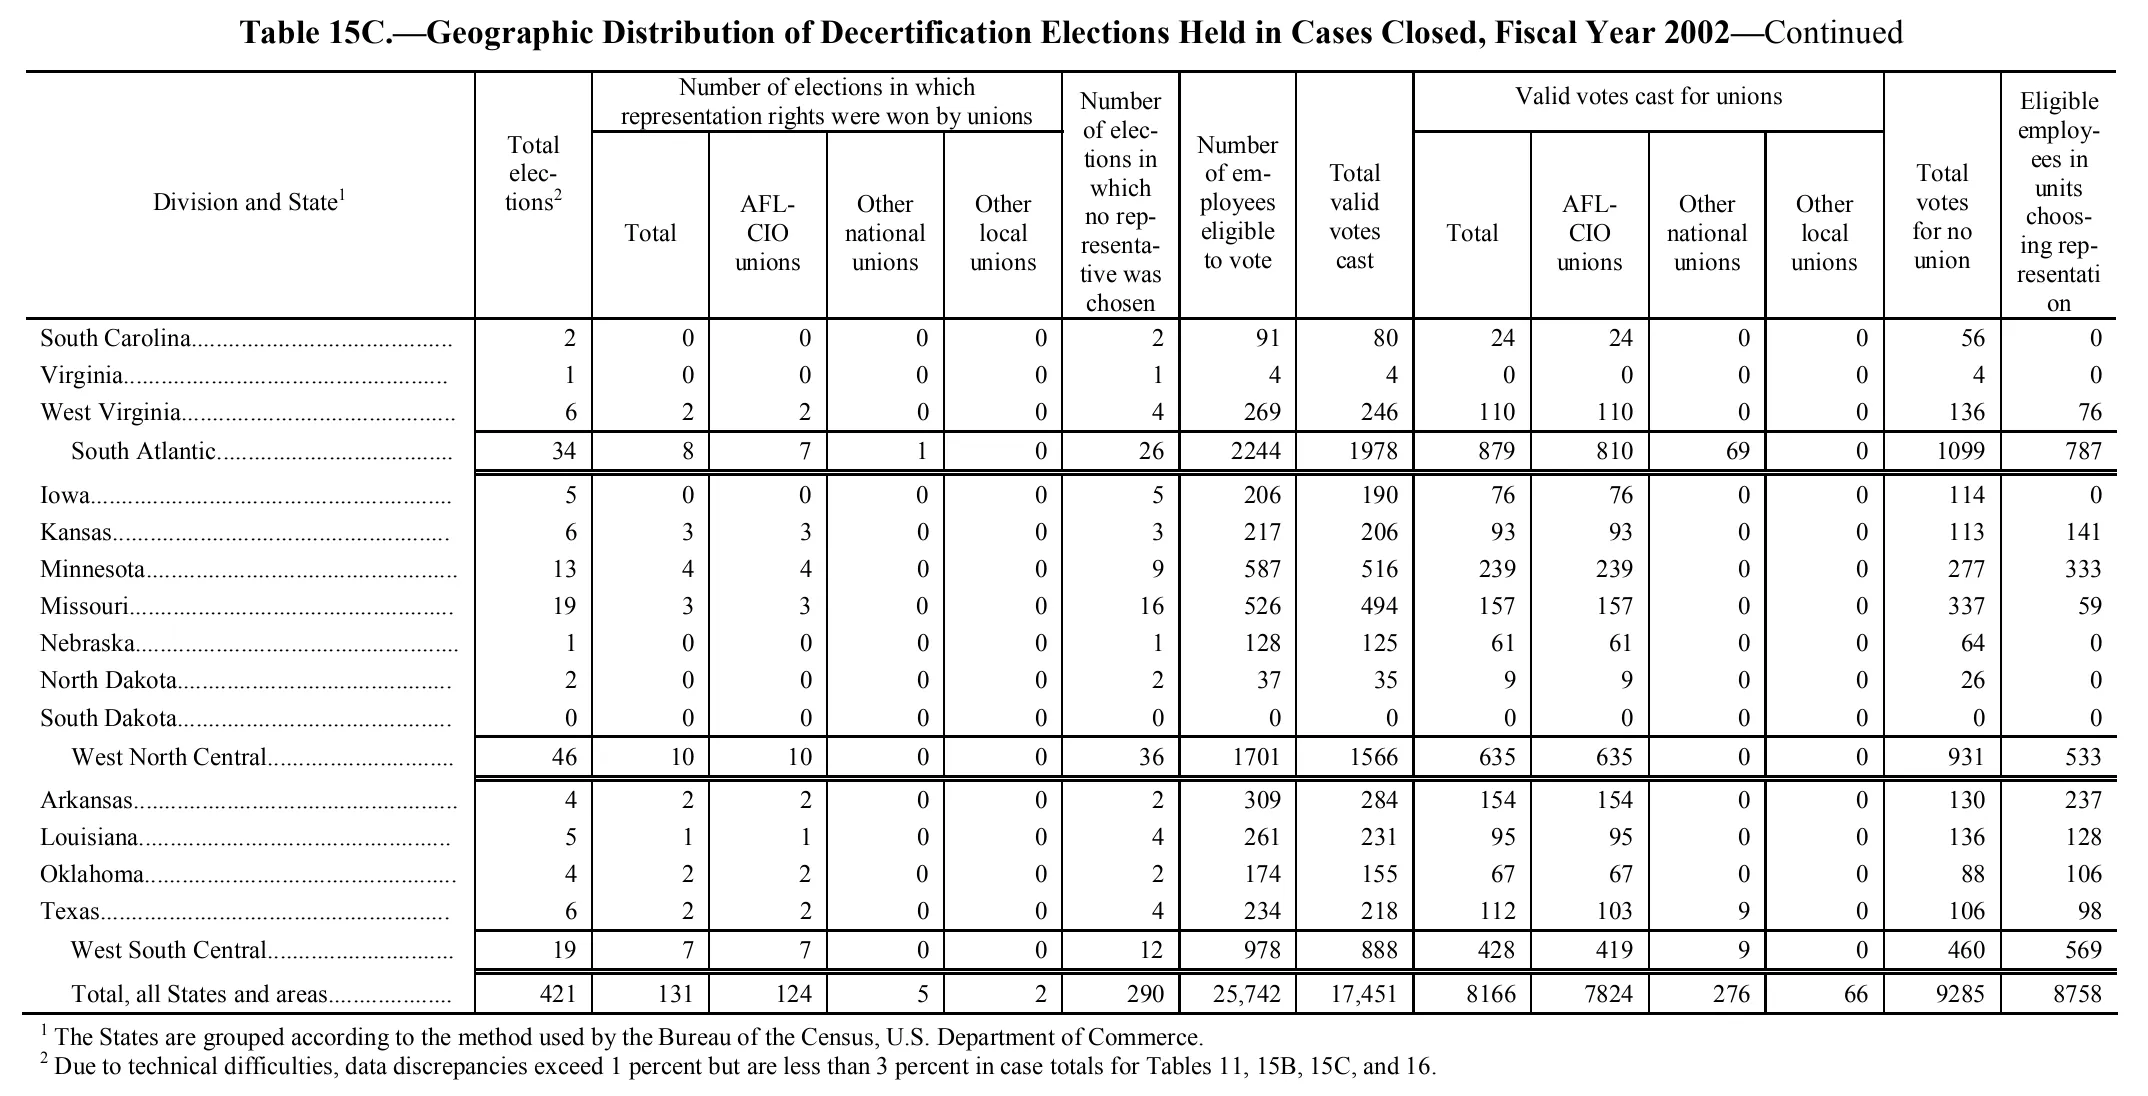
Geographic Distribution of Decertification Elections Held in Cases Closed, Fiscal Year 2002
Stitched from pp. 135–137.
| Division and State | Total elections | Number of elections in which representation rights were won by unions | Number of elections in which no representative was chosen | Number of employees eligible to vote | Total valid votes cast | Valid votes cast for unions | Total votes for no union | Eligible employees in units choosing representation | ||||||
|---|---|---|---|---|---|---|---|---|---|---|---|---|---|---|
| Division and State | Total elections | Total | AFL-CIO unions | Other national unions | Other local unions | Number of elections in which no representative was chosen | Number of employees eligible to vote | Total valid votes cast | Total | AFL-CIO unions | Other national unions | Other local unions | Total votes for no union | Eligible employees in units choosing representation |
| Illinois | 28 | 8 | 8 | 0 | 0 | 20 | 1032 | 874 | 366 | 366 | 0 | 0 | 508 | 461 |
| Indiana | 9 | 3 | 3 | 0 | 0 | 6 | 268 | 239 | 110 | 110 | 0 | 0 | 129 | 104 |
| Michigan | 34 | 9 | 8 | 1 | 0 | 25 | 2201 | 1781 | 806 | 733 | 73 | 0 | 975 | 946 |
| Ohio | 26 | 11 | 11 | 0 | 0 | 15 | 1125 | 1010 | 543 | 543 | 0 | 0 | 467 | 590 |
| Wisconsin | 20 | 6 | 5 | 1 | 0 | 14 | 449 | 339 | 160 | 160 | 0 | 0 | 179 | 219 |
| East North Central | 117 | 37 | 35 | 2 | 0 | 80 | 5075 | 4243 | 1985 | 1912 | 73 | 0 | 2258 | 2320 |
| Alabama | 4 | 0 | 0 | 0 | 0 | 4 | 132 | 123 | 44 | 44 | 0 | 0 | 79 | 0 |
| Kentucky | 5 | 0 | 0 | 0 | 0 | 5 | 138 | 126 | 44 | 44 | 0 | 0 | 82 | 0 |
| Mississippi | 2 | 1 | 1 | 0 | 0 | 1 | 119 | 108 | 50 | 50 | 0 | 0 | 58 | 48 |
| Tennessee | 7 | 3 | 3 | 0 | 0 | 4 | 428 | 387 | 186 | 186 | 0 | 0 | 201 | 254 |
| East South Central | 18 | 4 | 4 | 0 | 0 | 14 | 817 | 744 | 324 | 324 | 0 | 0 | 420 | 302 |
| New Jersey | 15 | 2 | 2 | 0 | 0 | 13 | 816 | 679 | 260 | 260 | 0 | 0 | 419 | 93 |
| New York | 35 | 14 | 14 | 0 | 0 | 21 | 7016 | 1253 | 575 | 575 | 0 | 0 | 678 | 724 |
| Pennsylvania | 21 | 7 | 7 | 0 | 0 | 14 | 922 | 771 | 422 | 414 | 0 | 8 | 349 | 549 |
| Middle Atlantic | 71 | 23 | 23 | 0 | 0 | 48 | 8754 | 2703 | 1257 | 1249 | 0 | 8 | 1446 | 1366 |
| Arizona | 4 | 2 | 1 | 1 | 0 | 2 | 136 | 100 | 49 | 10 | 39 | 0 | 51 | 75 |
| Colorado | 3 | 0 | 0 | 0 | 0 | 3 | 41 | 37 | 10 | 10 | 0 | 0 | 27 | 0 |
| Idaho | 0 | 0 | 0 | 0 | 0 | 0 | 0 | 0 | 0 | 0 | 0 | 0 | 0 | 0 |
| Montana | 3 | 2 | 2 | 0 | 0 | 1 | 136 | 114 | 54 | 54 | 0 | 0 | 60 | 87 |
| Nevada | 8 | 2 | 2 | 0 | 0 | 6 | 702 | 623 | 267 | 267 | 0 | 0 | 356 | 35 |
| New Mexico | 2 | 1 | 1 | 0 | 0 | 1 | 60 | 50 | 33 | 33 | 0 | 0 | 17 | 50 |
| Utah | 1 | 0 | 0 | 0 | 0 | 1 | 29 | 23 | 10 | 10 | 0 | 0 | 13 | 0 |
| Wyoming | 1 | 0 | 0 | 0 | 0 | 1 | 92 | 84 | 27 | 27 | 0 | 0 | 57 | 0 |
| Mountain | 22 | 7 | 6 | 1 | 0 | 15 | 1196 | 1031 | 450 | 411 | 39 | 0 | 581 | 247 |
| Connecticut | 4 | 0 | 0 | 0 | 0 | 4 | 69 | 62 | 19 | 19 | 0 | 0 | 43 | 0 |
| Maine | 0 | 0 | 0 | 0 | 0 | 0 | 0 | 0 | 0 | 0 | 0 | 0 | 0 | 0 |
| Massachusetts | 4 | 3 | 3 | 0 | 0 | 1 | 390 | 364 | 221 | 221 | 0 | 0 | 143 | 324 |
| New Hampshire | 1 | 0 | 0 | 0 | 0 | 1 | 6 | 6 | 2 | 2 | 0 | 0 | 4 | 0 |
| Rhode Island | 1 | 0 | 0 | 0 | 0 | 1 | 62 | 58 | 22 | 22 | 0 | 0 | 36 | 0 |
| Vermont | 0 | 0 | 0 | 0 | 0 | 0 | 0 | 0 | 0 | 0 | 0 | 0 | 0 | 0 |
| New England | 10 | 3 | 3 | 0 | 0 | 7 | 527 | 490 | 264 | 264 | 0 | 0 | 226 | 324 |
| Puerto Rico | 8 | 1 | 1 | 0 | 0 | 7 | 318 | 262 | 94 | 75 | 0 | 19 | 168 | 95 |
| Virgin Islands | 0 | 0 | 0 | 0 | 0 | 0 | 0 | 0 | 0 | 0 | 0 | 0 | 0 | 0 |
| Outlying Areas | 8 | 1 | 1 | 0 | 0 | 7 | 318 | 262 | 94 | 75 | 0 | 19 | 168 | 95 |
| Alaska | 0 | 0 | 0 | 0 | 0 | 0 | 0 | 0 | 0 | 0 | 0 | 0 | 0 | 0 |
| American Samoa | 0 | 0 | 0 | 0 | 0 | 0 | 0 | 0 | 0 | 0 | 0 | 0 | 0 | 0 |
| California | 40 | 17 | 14 | 1 | 2 | 23 | 2379 | 2074 | 1096 | 971 | 86 | 39 | 978 | 1574 |
| Federated States of Micronesia | 0 | 0 | 0 | 0 | 0 | 0 | 0 | 0 | 0 | 0 | 0 | 0 | 0 | 0 |
| Guam | 0 | 0 | 0 | 0 | 0 | 0 | 0 | 0 | 0 | 0 | 0 | 0 | 0 | 0 |
| Hawaii | 6 | 1 | 1 | 0 | 0 | 5 | 178 | 147 | 67 | 67 | 0 | 0 | 80 | 24 |
| Marshall Islands | 0 | 0 | 0 | 0 | 0 | 0 | 0 | 0 | 0 | 0 | 0 | 0 | 0 | 0 |
| Northern Mariana Islands | 0 | 0 | 0 | 0 | 0 | 0 | 0 | 0 | 0 | 0 | 0 | 0 | 0 | 0 |
| Oregon | 9 | 3 | 3 | 0 | 0 | 6 | 309 | 272 | 121 | 121 | 0 | 0 | 151 | 87 |
| Palau | 0 | 0 | 0 | 0 | 0 | 0 | 0 | 0 | 0 | 0 | 0 | 0 | 0 | 0 |
| Washington | 21 | 10 | 10 | 0 | 0 | 11 | 1266 | 1053 | 566 | 566 | 0 | 0 | 487 | 530 |
| Pacific | 76 | 31 | 28 | 1 | 2 | 45 | 4132 | 3546 | 1850 | 1725 | 86 | 39 | 1696 | 2215 |
| Delaware | 1 | 1 | 0 | 1 | 0 | 0 | 35 | 29 | 15 | 0 | 15 | 0 | 14 | 35 |
| District Of Columbia | 1 | 0 | 0 | 0 | 0 | 1 | 7 | 6 | 0 | 0 | 0 | 0 | 6 | 0 |
| Florida | 11 | 2 | 2 | 0 | 0 | 9 | 962 | 829 | 383 | 383 | 0 | 0 | 446 | 441 |
| Georgia | 2 | 0 | 0 | 0 | 0 | 2 | 220 | 209 | 101 | 94 | 7 | 0 | 108 | 0 |
| Maryland | 6 | 1 | 1 | 0 | 0 | 5 | 421 | 359 | 139 | 139 | 0 | 0 | 220 | 73 |
| North Carolina | 4 | 2 | 2 | 0 | 0 | 2 | 235 | 216 | 107 | 60 | 47 | 0 | 109 | 162 |
| South Carolina | 2 | 0 | 0 | 0 | 0 | 2 | 91 | 80 | 24 | 24 | 0 | 0 | 56 | 0 |
| Virginia | 1 | 0 | 0 | 0 | 0 | 1 | 4 | 4 | 0 | 0 | 0 | 0 | 4 | 0 |
| West Virginia | 6 | 2 | 2 | 0 | 0 | 4 | 269 | 246 | 110 | 110 | 0 | 0 | 136 | 76 |
| South Atlantic | 34 | 8 | 7 | 1 | 0 | 26 | 2244 | 1978 | 879 | 810 | 69 | 0 | 1099 | 787 |
| Iowa | 5 | 0 | 0 | 0 | 0 | 5 | 206 | 190 | 76 | 76 | 0 | 0 | 114 | 0 |
| Kansas | 6 | 3 | 3 | 0 | 0 | 3 | 217 | 206 | 93 | 93 | 0 | 0 | 113 | 141 |
| Minnesota | 13 | 4 | 4 | 0 | 0 | 9 | 587 | 516 | 239 | 239 | 0 | 0 | 277 | 333 |
| Missouri | 19 | 3 | 3 | 0 | 0 | 16 | 526 | 494 | 157 | 157 | 0 | 0 | 337 | 59 |
| Nebraska | 1 | 0 | 0 | 0 | 0 | 1 | 128 | 125 | 61 | 61 | 0 | 0 | 64 | 0 |
| North Dakota | 2 | 0 | 0 | 0 | 0 | 2 | 37 | 35 | 9 | 9 | 0 | 0 | 26 | 0 |
| South Dakota | 0 | 0 | 0 | 0 | 0 | 0 | 0 | 0 | 0 | 0 | 0 | 0 | 0 | 0 |
| West North Central | 46 | 10 | 10 | 0 | 0 | 36 | 1701 | 1566 | 635 | 635 | 0 | 0 | 931 | 533 |
| Arkansas | 4 | 2 | 2 | 0 | 0 | 2 | 309 | 284 | 154 | 154 | 0 | 0 | 130 | 237 |
| Louisiana | 5 | 1 | 1 | 0 | 0 | 4 | 261 | 231 | 95 | 95 | 0 | 0 | 136 | 128 |
| Oklahoma | 4 | 2 | 2 | 0 | 0 | 2 | 174 | 155 | 67 | 67 | 0 | 0 | 88 | 106 |
| Texas | 6 | 2 | 2 | 0 | 0 | 4 | 234 | 218 | 112 | 103 | 9 | 0 | 106 | 98 |
| West South Central | 19 | 7 | 7 | 0 | 0 | 12 | 978 | 888 | 428 | 419 | 9 | 0 | 460 | 569 |
| Total, all States and areas | 421 | 131 | 124 | 5 | 2 | 290 | 25,742 | 17,451 | 8166 | 7824 | 276 | 66 | 9285 | 8758 |
- 1 The States are grouped according to the method used by the Bureau of the Census, U.S. Department of Commerce.
- 2 Due to technical difficulties, data discrepancies exceed 1 percent but are less than 3 percent in case totals for Tables 11, 15B, 15C, and 16.
561 of 561 figures sit in a row or column sum that works out. 14 cells break a sum: 'Pennsylvania', column 10: prints 422, columns 11 to 12 add to 414; 'Middle Atlantic', column 10: prints 1,257, columns 11 to 12 add to 1,249; 'Puerto Rico', column 10: prints 94, columns 11 to 12 add to 75; 'Outlying Areas', column 10: prints 94, columns 11 to 12 add to 75; 'California', column 10: prints 1,096, columns 11 to 12 add to 1,057; 'Pacific', column 10: prints 1,850, columns 11 to 12 add to 1,811; 'Total, all States and areas', column 10: prints 8,166, columns 11 to 12 add to 8,100; 'Pennsylvania', column 9: prints 771, the subtotals in columns 10 to 14 add to 779; 'Middle Atlantic', column 9: prints 2,703, the subtotals in columns 10 to 14 add to 2,711; 'Puerto Rico', column 9: prints 262, the subtotals in columns 10 to 14 add to 281; 'Outlying Areas', column 9: prints 262, the subtotals in columns 10 to 14 add to 281; 'California', column 9: prints 2,074, the subtotals in columns 10 to 14 add to 2,113; 'Pacific', column 9: prints 3,546, the subtotals in columns 10 to 14 add to 3,585; 'Total, all States and areas', column 9: prints 17,451, the subtotals in columns 10 to 14 add to 17,517.
Reader’s notes
p. 135. The crop cuts the table off after the "Maine" row (the New England division and the remaining divisions/grand total continue on the rest of the page), and no footnote texts are visible in the crop even though the stub heading carries a raised 1 ("Division and State^1") and the second column a raised 2 ("Total elections^2"); those footnotes are printed below the cut. 15 printed columns: stub, "Total elections", four columns under "Number of elections in which representation rights were won by unions" (Total / AFL-CIO unions / Other national unions / Other local unions), "Number of elections in which no representative was chosen", "Number of employees eligible to vote", "Total valid votes cast", four columns under "Valid votes cast for unions" (same four sub-headings), "Total votes for no union", and "Eligible employees in units choosing representation". Division subtotal rows (East North Central, East South Central, Middle Atlantic, Mountain) are printed indented and set off by rules; they are transcribed as ordinary rows carrying their values. The last heading is printed hyphen-broken as "Eligible employ-ees in units choos-ing rep-resentati on" and has been rejoined to "Eligible employees in units choosing representation". All rows are internally consistent (valid votes for unions + votes for no union = total valid votes cast), with one oddity transcribed as printed: New York shows 7016 employees eligible to vote against only 1253 total valid votes cast, and the Middle Atlantic subtotal 8754 is consistent with that figure. Arizona's "Valid votes cast for unions — Total" of 49 splits as 10 AFL-CIO + 39 other national, as printed. No cell was illegible.
p. 136. 15 columns: stub, "Total elections^2", four columns under "Number of elections in which representation rights were won by unions", then three tall single columns, four columns under "Valid votes cast for unions", then "Total votes for no union" and "Eligible employees in units choosing representation". Headings were rejoined across line breaks and end-of-line hyphens (e.g. "elec-tions", "em-ployees", "no rep-resenta-tive was chosen", "choos-ing rep-resentati on"). This is a continuation page ("—Continued"). The crop is cut off at the bottom: the South Atlantic division continues past North Carolina (no divisional subtotal for it appears on this image). The "New England" subtotal row (10 elections, 527 eligible) exceeds the sum of the four New England states printed here (6 elections, 458 eligible) because the earlier states of that division (e.g. Connecticut, Maine) are printed on the preceding page; this is expected and not a misprint. Footnote markers 1 (on "Division and State") and 2 (on "Total elections") appear in the headings, but no footnote text is printed within this crop, so `footnotes` is empty. All other arithmetic checks internally: each state's union-total equals its AFL-CIO + other national + other local votes, union votes + no-union votes equal total valid votes cast, and the Pacific and Outlying Areas subtotals match the sum of their listed states exactly.
p. 137. This is a continuation page ("—Continued"): the body begins mid-way through the South Atlantic division (South Carolina, Virginia, West Virginia), so the earlier States of that division and all preceding divisions are on the previous page(s). The division subtotal rows (South Atlantic, West North Central, West South Central) and the final "Total, all States and areas" row are printed indented under the stub; they are transcribed with their own wording. Digit grouping is inconsistent in the printed final row and is transcribed as printed: "25,742" and "17,451" carry commas while "8166", "7824", "9285" and "8758" do not. Four-digit values in the subtotal rows (2244, 1978, 1099, 1701, 1566) are likewise printed without commas. The header column 1 label carries a raised 2 on "elections" ("Total elec-tions^2") and the stub heading a raised 1 ("Division and State^1"); both markers are recorded behind a caret. The last column heading is printed broken as "Eligible employ-ees in units choos-ing rep-resentati on" and has been joined to "Eligible employees in units choosing representation". All cells were legible; no doubtful digits. Internal checks are consistent where they can be made (e.g. South Atlantic 8 = 7+1+0 and 879+1099 = 1978; West North Central States sum to 46 elections; West South Central States sum to 19 elections and 428+460 = 888).
Source image
Source data: U.S. NLRB Annual Reports (public domain). Reconstruction by NLRB Stats Archive. Read by claude-opus-5 (effort max, prompt extract_v1) from the 300-dpi scan; stitched by page. Updated October 2026.