NLRB Stats Archive › Annual Reports › FY2002 › Analysis of Methods of Disposition of Representation and Union Deauthorization Cases Closed, Fiscal Year 2002
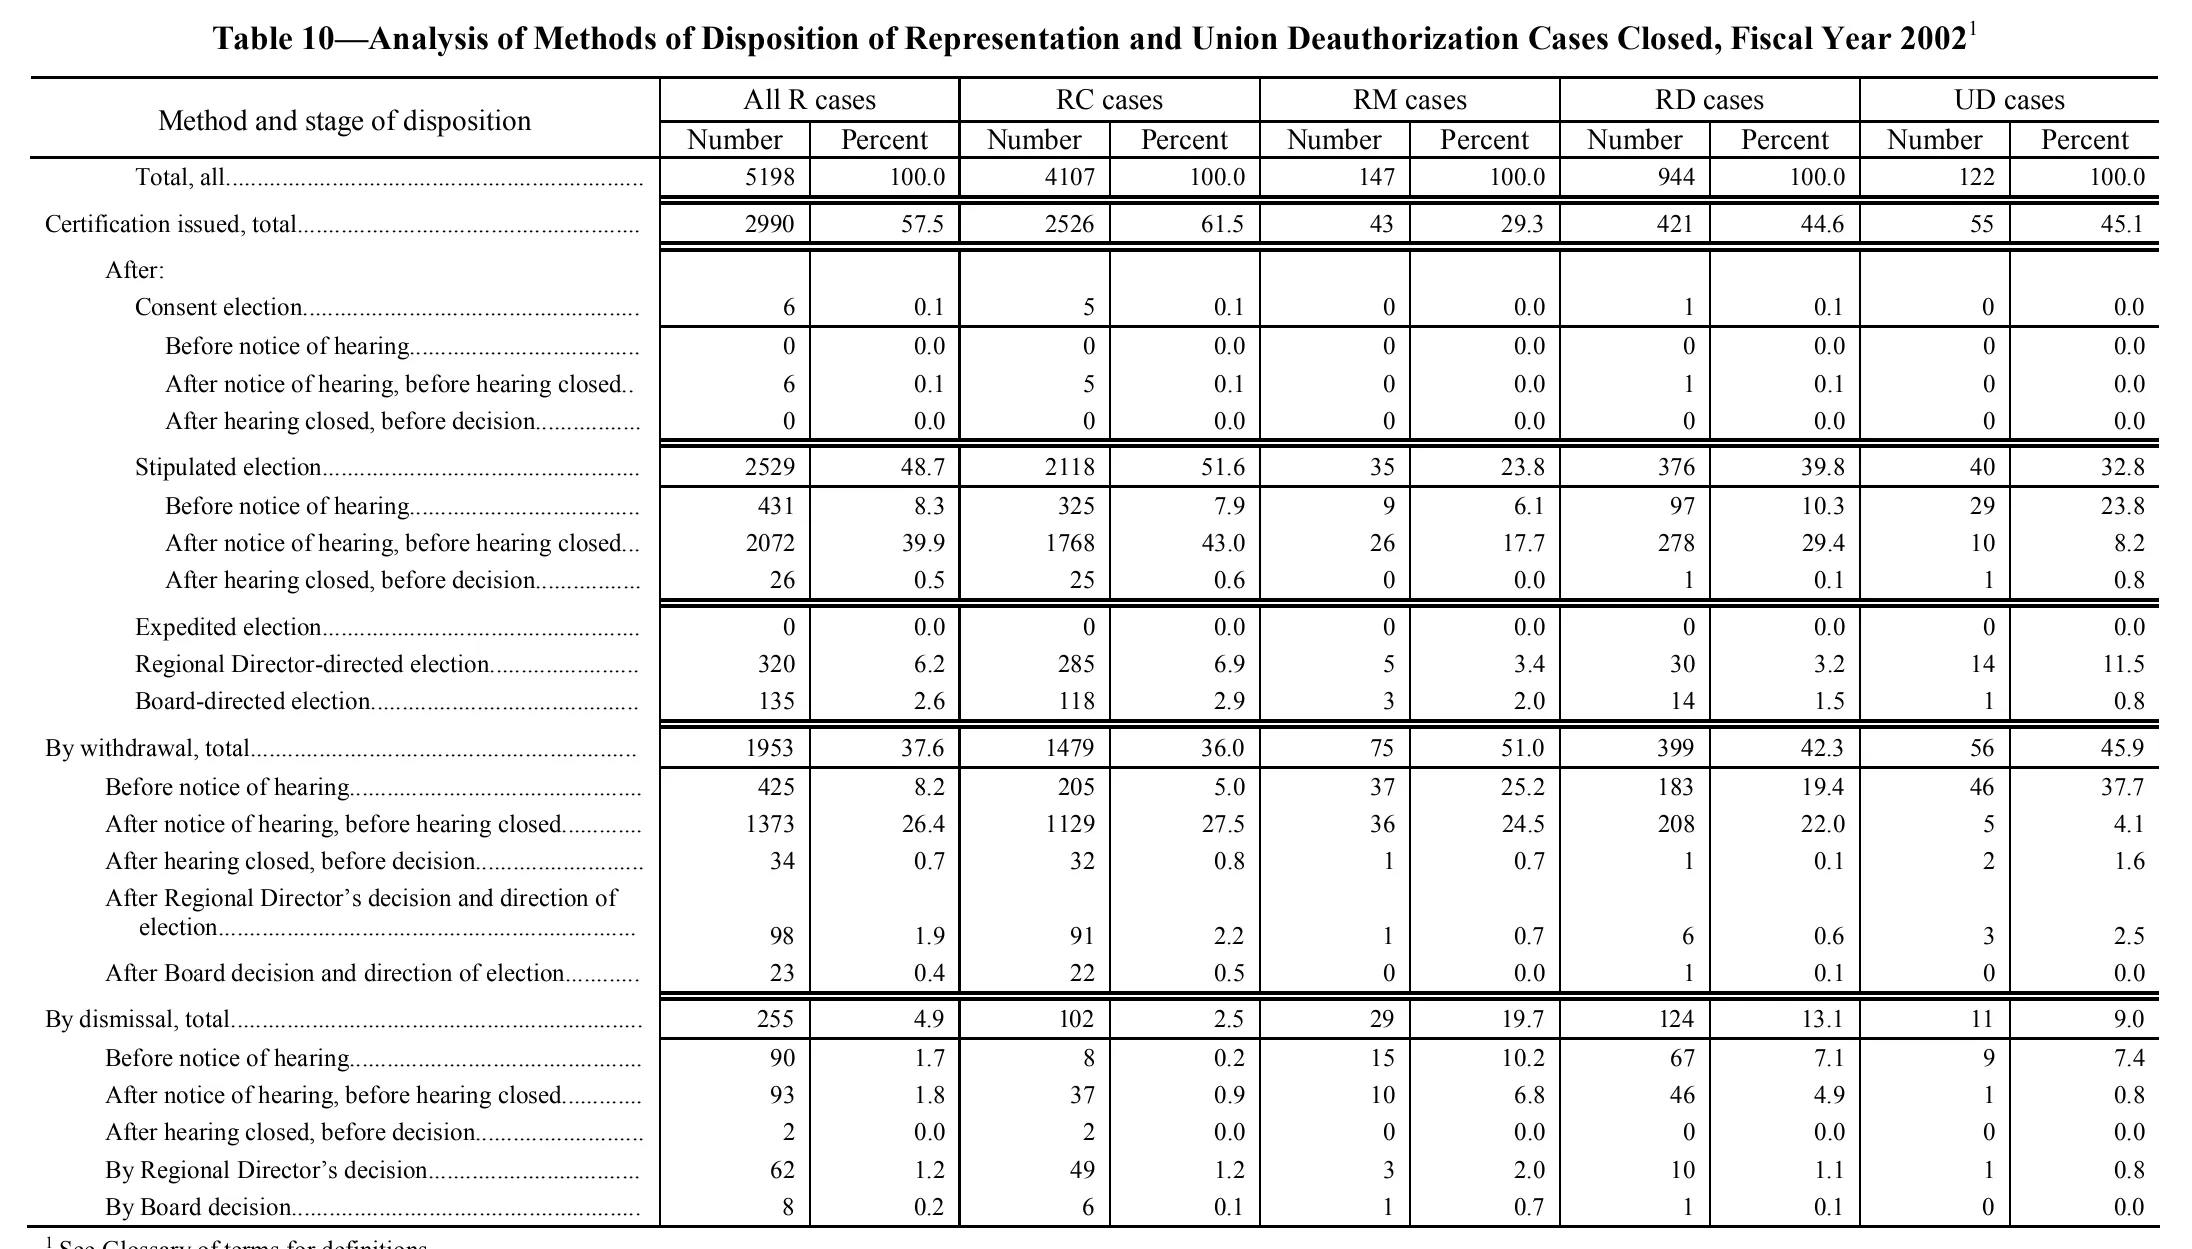
Analysis of Methods of Disposition of Representation and Union Deauthorization Cases Closed, Fiscal Year 2002
| Method and stage of disposition | All R cases | RC cases | RM cases | RD cases | UD cases | |||||
|---|---|---|---|---|---|---|---|---|---|---|
| Method and stage of disposition | Number | Percent | Number | Percent | Number | Percent | Number | Percent | Number | Percent |
| Total, all | 5198 | 100.0 | 4107 | 100.0 | 147 | 100.0 | 944 | 100.0 | 122 | 100.0 |
| Certification issued, total | 2990 | 57.5 | 2526 | 61.5 | 43 | 29.3 | 421 | 44.6 | 55 | 45.1 |
| After: | ||||||||||
| Consent election | 6 | 0.1 | 5 | 0.1 | 0 | 0.0 | 1 | 0.1 | 0 | 0.0 |
| Before notice of hearing | 0 | 0.0 | 0 | 0.0 | 0 | 0.0 | 0 | 0.0 | 0 | 0.0 |
| After notice of hearing, before hearing closed | 6 | 0.1 | 5 | 0.1 | 0 | 0.0 | 1 | 0.1 | 0 | 0.0 |
| After hearing closed, before decision | 0 | 0.0 | 0 | 0.0 | 0 | 0.0 | 0 | 0.0 | 0 | 0.0 |
| Stipulated election | 2529 | 48.7 | 2118 | 51.6 | 35 | 23.8 | 376 | 39.8 | 40 | 32.8 |
| Before notice of hearing | 431 | 8.3 | 325 | 7.9 | 9 | 6.1 | 97 | 10.3 | 29 | 23.8 |
| After notice of hearing, before hearing closed | 2072 | 39.9 | 1768 | 43.0 | 26 | 17.7 | 278 | 29.4 | 10 | 8.2 |
| After hearing closed, before decision | 26 | 0.5 | 25 | 0.6 | 0 | 0.0 | 1 | 0.1 | 1 | 0.8 |
| Expedited election | 0 | 0.0 | 0 | 0.0 | 0 | 0.0 | 0 | 0.0 | 0 | 0.0 |
| Regional Director-directed election | 320 | 6.2 | 285 | 6.9 | 5 | 3.4 | 30 | 3.2 | 14 | 11.5 |
| Board-directed election | 135 | 2.6 | 118 | 2.9 | 3 | 2.0 | 14 | 1.5 | 1 | 0.8 |
| By withdrawal, total | 1953 | 37.6 | 1479 | 36.0 | 75 | 51.0 | 399 | 42.3 | 56 | 45.9 |
| Before notice of hearing | 425 | 8.2 | 205 | 5.0 | 37 | 25.2 | 183 | 19.4 | 46 | 37.7 |
| After notice of hearing, before hearing closed | 1373 | 26.4 | 1129 | 27.5 | 36 | 24.5 | 208 | 22.0 | 5 | 4.1 |
| After hearing closed, before decision | 34 | 0.7 | 32 | 0.8 | 1 | 0.7 | 1 | 0.1 | 2 | 1.6 |
| After Regional Director's decision and direction of election | 98 | 1.9 | 91 | 2.2 | 1 | 0.7 | 6 | 0.6 | 3 | 2.5 |
| After Board decision and direction of election | 23 | 0.4 | 22 | 0.5 | 0 | 0.0 | 1 | 0.1 | 0 | 0.0 |
| By dismissal, total | 255 | 4.9 | 102 | 2.5 | 29 | 19.7 | 124 | 13.1 | 11 | 9.0 |
| Before notice of hearing | 90 | 1.7 | 8 | 0.2 | 15 | 10.2 | 67 | 7.1 | 9 | 7.4 |
| After notice of hearing, before hearing closed | 93 | 1.8 | 37 | 0.9 | 10 | 6.8 | 46 | 4.9 | 1 | 0.8 |
| After hearing closed, before decision | 2 | 0.0 | 2 | 0.0 | 0 | 0.0 | 0 | 0.0 | 0 | 0.0 |
| By Regional Director's decision | 62 | 1.2 | 49 | 1.2 | 3 | 2.0 | 10 | 1.1 | 1 | 0.8 |
| By Board decision | 8 | 0.2 | 6 | 0.1 | 1 | 0.7 | 1 | 0.1 | 0 | 0.0 |
- 1 See Glossary of terms for definitions.
95 of 99 figures sit in a row or column sum that works out.
Reader’s notes
p. 114. 11 columns: stub plus Number/Percent pairs for All R, RC, RM, RD and UD cases. The footnote line at the foot of the crop is clipped by the bottom edge — only the upper half of the glyphs is visible, but the text reads "See Glossary of terms for definitions." with reasonable certainty; the marker is the raised 1 keyed to the caption. The row "After:" is a section line carrying a label and no values. The two-line label "After Regional Director's decision and direction of election" has been joined into one row, with its figures printed on the second line. All printed arithmetic checks out: each section's components sum to its total, the three section totals sum to "Total, all" in every column, and All R equals RC + RM + RD (UD is a separate series). Apostrophes in "Regional Director's" are printed as typographic right single quotes; transcribed as plain apostrophes.
Source image
Source data: U.S. NLRB Annual Reports (public domain). Reconstruction by NLRB Stats Archive. Read by claude-opus-5 (effort max, prompt extract_v1) from the 300-dpi scan; stitched by page. Updated October 2026.