NLRB Stats Archive › Annual Reports › FY2001 › Size of Units in Representation Elections in Cases Closed, Fiscal Year 2001
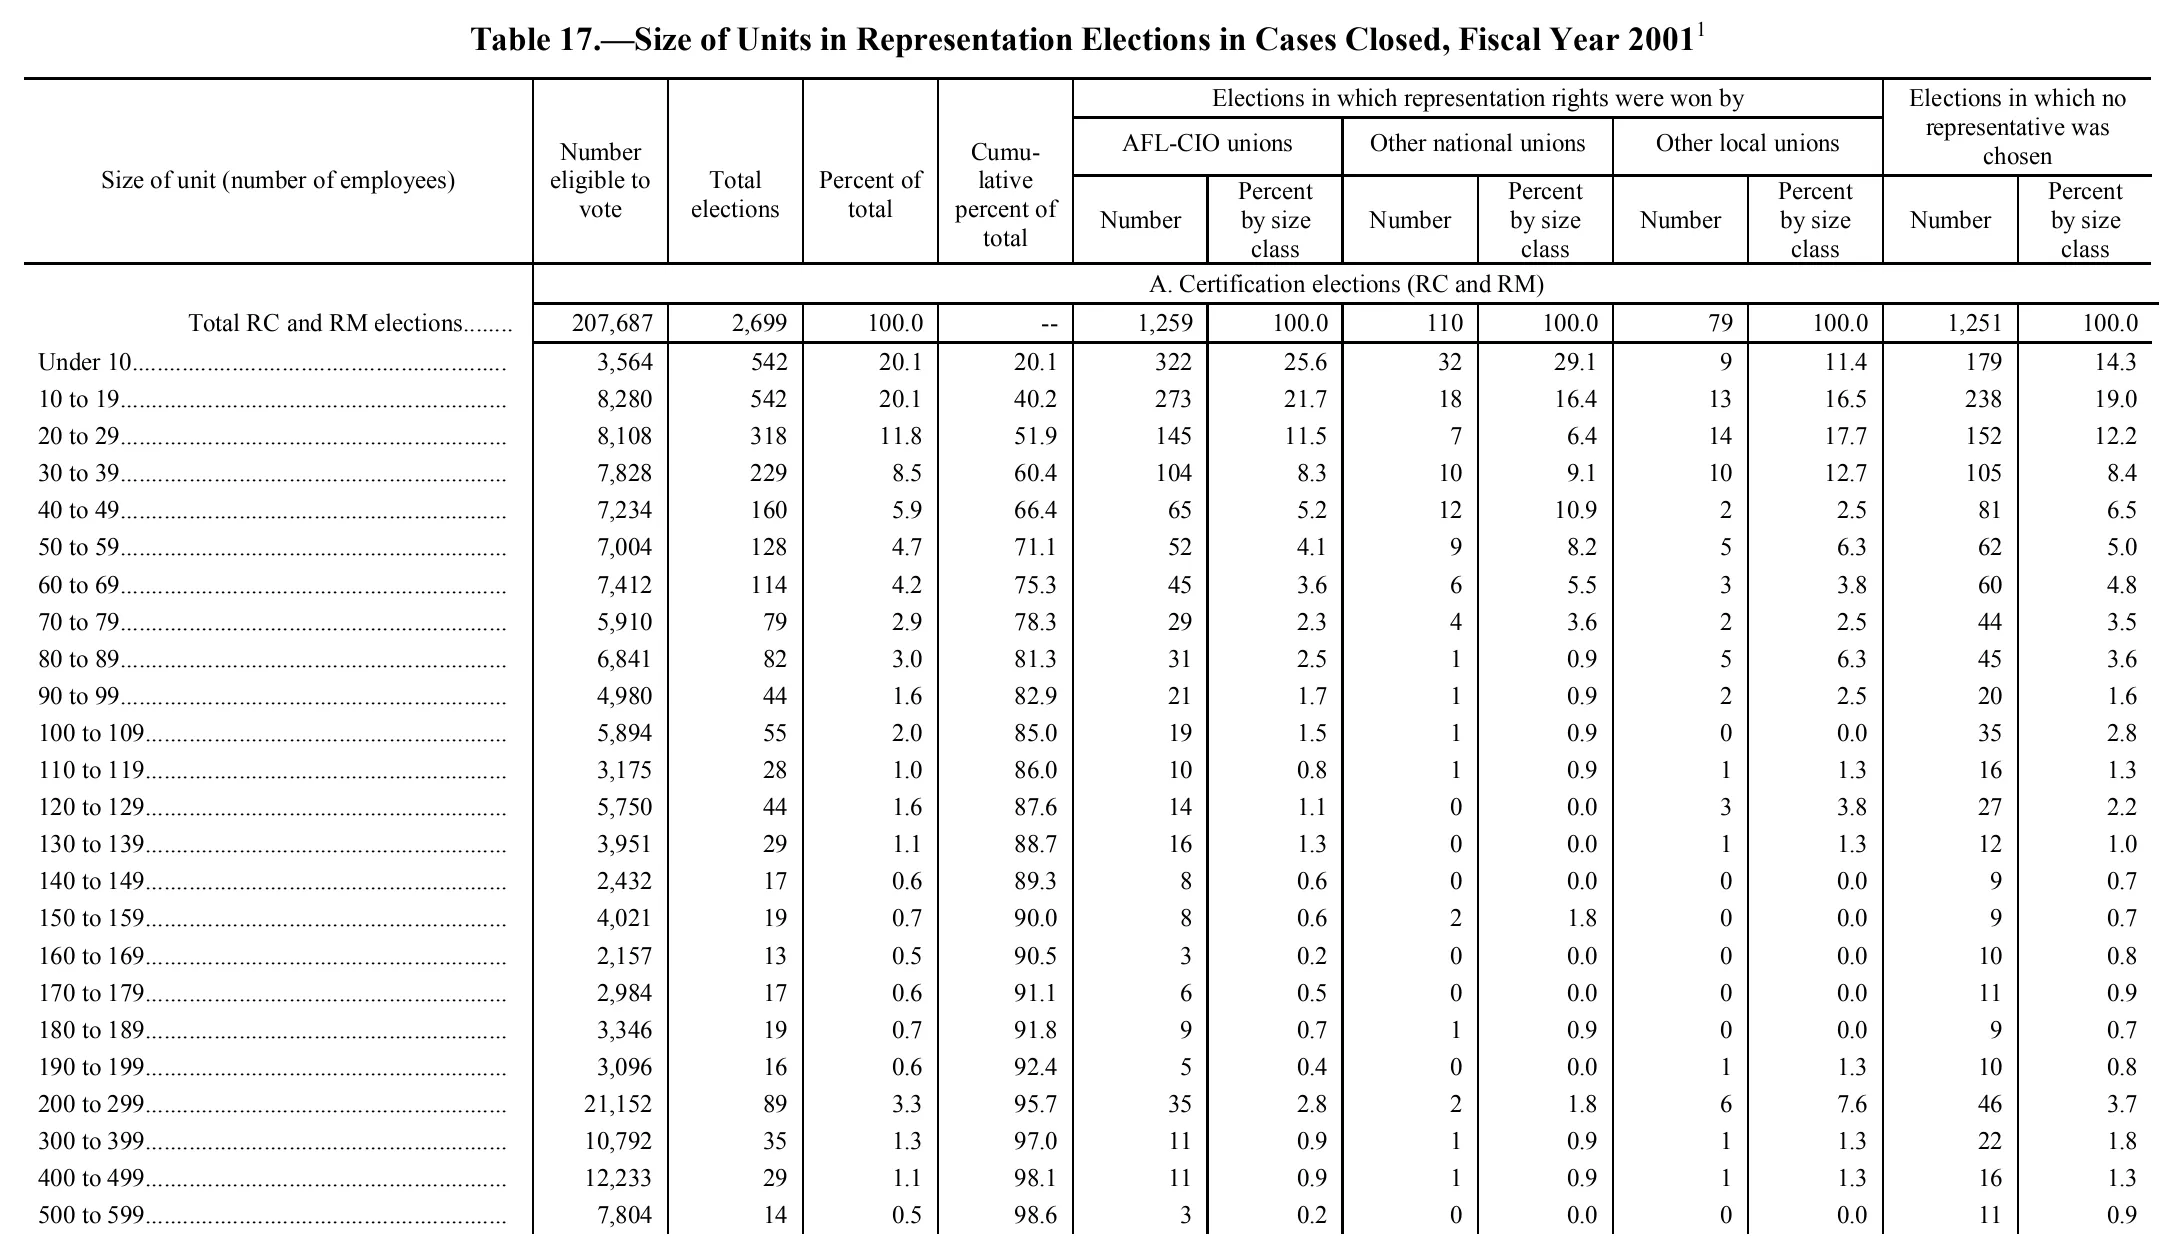
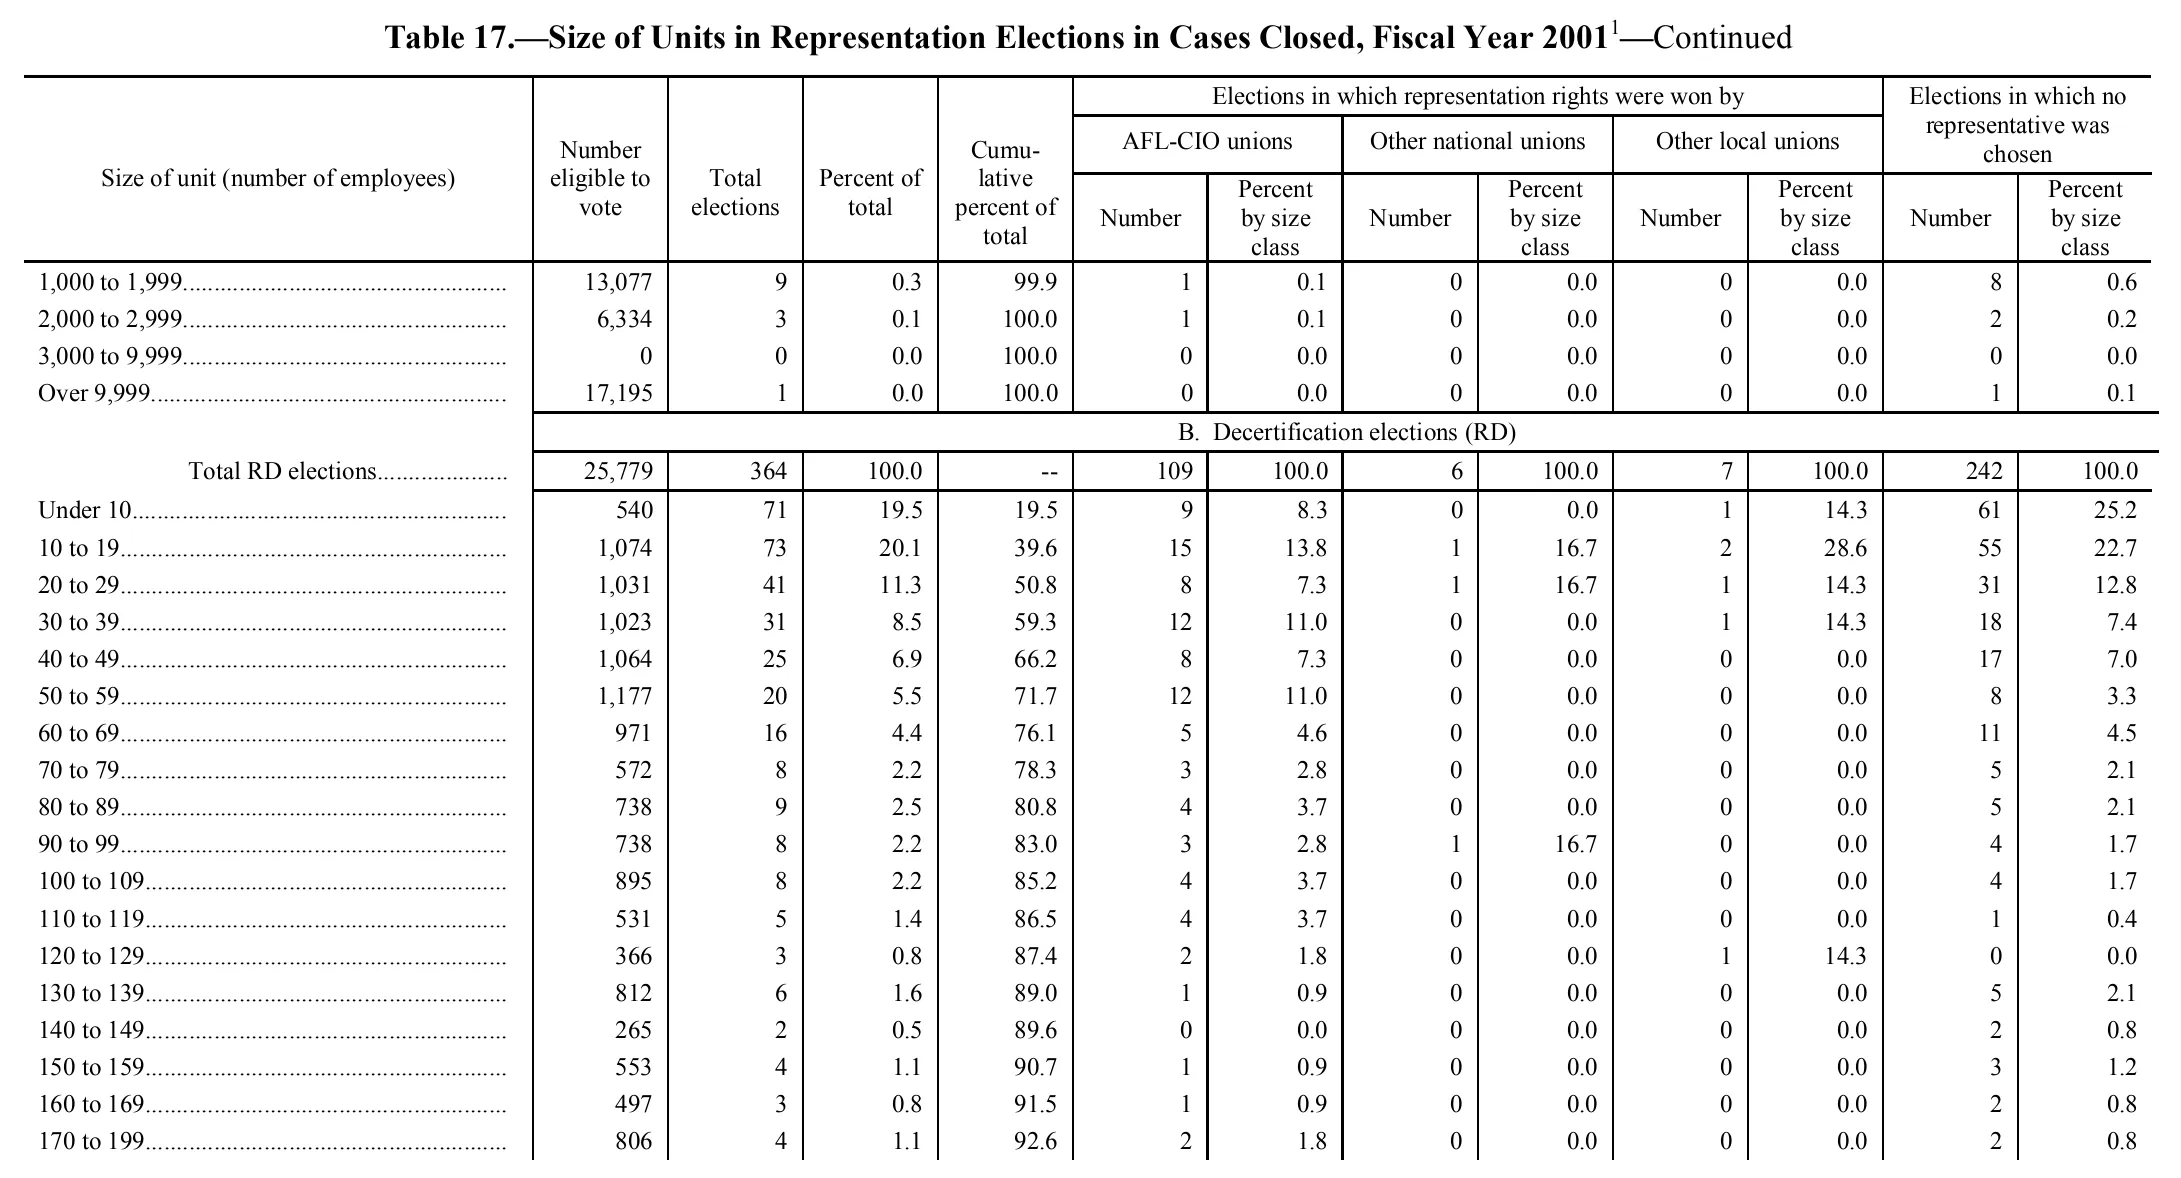
Size of Units in Representation Elections in Cases Closed, Fiscal Year 2001
Stitched from pp. 189–191.
| Size of unit (number of employees) | Number eligible to vote | Total elections | Percent of total | Cumulative percent of total | Elections in which representation rights were won by | Elections in which no representative was chosen | ||||||
|---|---|---|---|---|---|---|---|---|---|---|---|---|
| Size of unit (number of employees) | Number eligible to vote | Total elections | Percent of total | Cumulative percent of total | AFL-CIO unions | Other national unions | Other local unions | Elections in which no representative was chosen | ||||
| Size of unit (number of employees) | Number eligible to vote | Total elections | Percent of total | Cumulative percent of total | Number | Percent by size class | Number | Percent by size class | Number | Percent by size class | Number | Percent by size class |
| A. Certification elections (RC and RM) | ||||||||||||
| Total RC and RM elections | 207,687 | 2,699 | 100.0 | 1,259 | 100.0 | 110 | 100.0 | 79 | 100.0 | 1,251 | 100.0 | |
| Under 10 | 3,564 | 542 | 20.1 | 20.1 | 322 | 25.6 | 32 | 29.1 | 9 | 11.4 | 179 | 14.3 |
| 10 to 19 | 8,280 | 542 | 20.1 | 40.2 | 273 | 21.7 | 18 | 16.4 | 13 | 16.5 | 238 | 19.0 |
| 20 to 29 | 8,108 | 318 | 11.8 | 51.9 | 145 | 11.5 | 7 | 6.4 | 14 | 17.7 | 152 | 12.2 |
| 30 to 39 | 7,828 | 229 | 8.5 | 60.4 | 104 | 8.3 | 10 | 9.1 | 10 | 12.7 | 105 | 8.4 |
| 40 to 49 | 7,234 | 160 | 5.9 | 66.4 | 65 | 5.2 | 12 | 10.9 | 2 | 2.5 | 81 | 6.5 |
| 50 to 59 | 7,004 | 128 | 4.7 | 71.1 | 52 | 4.1 | 9 | 8.2 | 5 | 6.3 | 62 | 5.0 |
| 60 to 69 | 7,412 | 114 | 4.2 | 75.3 | 45 | 3.6 | 6 | 5.5 | 3 | 3.8 | 60 | 4.8 |
| 70 to 79 | 5,910 | 79 | 2.9 | 78.3 | 29 | 2.3 | 4 | 3.6 | 2 | 2.5 | 44 | 3.5 |
| 80 to 89 | 6,841 | 82 | 3.0 | 81.3 | 31 | 2.5 | 1 | 0.9 | 5 | 6.3 | 45 | 3.6 |
| 90 to 99 | 4,980 | 44 | 1.6 | 82.9 | 21 | 1.7 | 1 | 0.9 | 2 | 2.5 | 20 | 1.6 |
| 100 to 109 | 5,894 | 55 | 2.0 | 85.0 | 19 | 1.5 | 1 | 0.9 | 0 | 0.0 | 35 | 2.8 |
| 110 to 119 | 3,175 | 28 | 1.0 | 86.0 | 10 | 0.8 | 1 | 0.9 | 1 | 1.3 | 16 | 1.3 |
| 120 to 129 | 5,750 | 44 | 1.6 | 87.6 | 14 | 1.1 | 0 | 0.0 | 3 | 3.8 | 27 | 2.2 |
| 130 to 139 | 3,951 | 29 | 1.1 | 88.7 | 16 | 1.3 | 0 | 0.0 | 1 | 1.3 | 12 | 1.0 |
| 140 to 149 | 2,432 | 17 | 0.6 | 89.3 | 8 | 0.6 | 0 | 0.0 | 0 | 0.0 | 9 | 0.7 |
| 150 to 159 | 4,021 | 19 | 0.7 | 90.0 | 8 | 0.6 | 2 | 1.8 | 0 | 0.0 | 9 | 0.7 |
| 160 to 169 | 2,157 | 13 | 0.5 | 90.5 | 3 | 0.2 | 0 | 0.0 | 0 | 0.0 | 10 | 0.8 |
| 170 to 179 | 2,984 | 17 | 0.6 | 91.1 | 6 | 0.5 | 0 | 0.0 | 0 | 0.0 | 11 | 0.9 |
| 180 to 189 | 3,346 | 19 | 0.7 | 91.8 | 9 | 0.7 | 1 | 0.9 | 0 | 0.0 | 9 | 0.7 |
| 190 to 199 | 3,096 | 16 | 0.6 | 92.4 | 5 | 0.4 | 0 | 0.0 | 1 | 1.3 | 10 | 0.8 |
| 200 to 299 | 21,152 | 89 | 3.3 | 95.7 | 35 | 2.8 | 2 | 1.8 | 6 | 7.6 | 46 | 3.7 |
| 300 to 399 | 10,792 | 35 | 1.3 | 97.0 | 11 | 0.9 | 1 | 0.9 | 1 | 1.3 | 22 | 1.8 |
| 400 to 499 | 12,233 | 29 | 1.1 | 98.1 | 11 | 0.9 | 1 | 0.9 | 1 | 1.3 | 16 | 1.3 |
| 500 to 599 | 7,804 | 14 | 0.5 | 98.6 | 3 | 0.2 | 0 | 0.0 | 0 | 0.0 | 11 | 0.9 |
| 1,000 to 1,999 | 13,077 | 9 | 0.3 | 99.9 | 1 | 0.1 | 0 | 0.0 | 0 | 0.0 | 8 | 0.6 |
| 2,000 to 2,999 | 6,334 | 3 | 0.1 | 100.0 | 1 | 0.1 | 0 | 0.0 | 0 | 0.0 | 2 | 0.2 |
| 3,000 to 9,999 | 0 | 0 | 0.0 | 100.0 | 0 | 0.0 | 0 | 0.0 | 0 | 0.0 | 0 | 0.0 |
| Over 9,999 | 17,195 | 1 | 0.0 | 100.0 | 0 | 0.0 | 0 | 0.0 | 0 | 0.0 | 1 | 0.1 |
| B. Decertification elections (RD) | ||||||||||||
| Total RD elections | 25,779 | 364 | 100.0 | 109 | 100.0 | 6 | 100.0 | 7 | 100.0 | 242 | 100.0 | |
| Under 10 | 540 | 71 | 19.5 | 19.5 | 9 | 8.3 | 0 | 0.0 | 1 | 14.3 | 61 | 25.2 |
| 10 to 19 | 1,074 | 73 | 20.1 | 39.6 | 15 | 13.8 | 1 | 16.7 | 2 | 28.6 | 55 | 22.7 |
| 20 to 29 | 1,031 | 41 | 11.3 | 50.8 | 8 | 7.3 | 1 | 16.7 | 1 | 14.3 | 31 | 12.8 |
| 30 to 39 | 1,023 | 31 | 8.5 | 59.3 | 12 | 11.0 | 0 | 0.0 | 1 | 14.3 | 18 | 7.4 |
| 40 to 49 | 1,064 | 25 | 6.9 | 66.2 | 8 | 7.3 | 0 | 0.0 | 0 | 0.0 | 17 | 7.0 |
| 50 to 59 | 1,177 | 20 | 5.5 | 71.7 | 12 | 11.0 | 0 | 0.0 | 0 | 0.0 | 8 | 3.3 |
| 60 to 69 | 971 | 16 | 4.4 | 76.1 | 5 | 4.6 | 0 | 0.0 | 0 | 0.0 | 11 | 4.5 |
| 70 to 79 | 572 | 8 | 2.2 | 78.3 | 3 | 2.8 | 0 | 0.0 | 0 | 0.0 | 5 | 2.1 |
| 80 to 89 | 738 | 9 | 2.5 | 80.8 | 4 | 3.7 | 0 | 0.0 | 0 | 0.0 | 5 | 2.1 |
| 90 to 99 | 738 | 8 | 2.2 | 83.0 | 3 | 2.8 | 1 | 16.7 | 0 | 0.0 | 4 | 1.7 |
| 100 to 109 | 895 | 8 | 2.2 | 85.2 | 4 | 3.7 | 0 | 0.0 | 0 | 0.0 | 4 | 1.7 |
| 110 to 119 | 531 | 5 | 1.4 | 86.5 | 4 | 3.7 | 0 | 0.0 | 0 | 0.0 | 1 | 0.4 |
| 120 to 129 | 366 | 3 | 0.8 | 87.4 | 2 | 1.8 | 0 | 0.0 | 1 | 14.3 | 0 | 0.0 |
| 130 to 139 | 812 | 6 | 1.6 | 89.0 | 1 | 0.9 | 0 | 0.0 | 0 | 0.0 | 5 | 2.1 |
| 140 to 149 | 265 | 2 | 0.5 | 89.6 | 0 | 0.0 | 0 | 0.0 | 0 | 0.0 | 2 | 0.8 |
| 150 to 159 | 553 | 4 | 1.1 | 90.7 | 1 | 0.9 | 0 | 0.0 | 0 | 0.0 | 3 | 1.2 |
| 160 to 169 | 497 | 3 | 0.8 | 91.5 | 1 | 0.9 | 0 | 0.0 | 0 | 0.0 | 2 | 0.8 |
| 170 to 199 | 806 | 4 | 1.1 | 92.6 | 2 | 1.8 | 0 | 0.0 | 0 | 0.0 | 2 | 0.8 |
| 200 to 299 | 2,708 | 12 | 3.3 | 95.9 | 8 | 7.3 | 0 | 0.0 | 0 | 0.0 | 4 | 1.7 |
| 300 to 499 | 3,437 | 9 | 2.5 | 98.4 | 4 | 3.7 | 2 | 33.3 | 1 | 14.3 | 2 | 0.8 |
| 500 to 799 | 2,090 | 3 | 0.8 | 99.2 | 2 | 1.8 | 0 | 0.0 | 0 | 0.0 | 1 | 0.4 |
| 800 and Over | 3,891 | 3 | 0.8 | 100.0 | 1 | 0.9 | 1 | 16.7 | 0 | 0.0 | 1 | 0.4 |
- 1 See Glossary of terms for definitions.
222 of 250 figures sit in a row or column sum that works out.
Reader’s notes
p. 189. The crop is cut off at the bottom: the body ends mid-table at the "500 to 599" row, and the table clearly continues (larger size classes, and presumably a panel "B." for other election types) on the rest of the page, which is not shown. No footnote texts are printed within the crop, although the caption carries a raised "1" marker (caption itself excluded per instructions). Table has 13 printed columns. Column 5 ("Cumulative percent of total") in the "Total RC and RM elections" row holds a short dash rule ("--") rather than a value; transcribed as "" per the dash-rule convention. "A. Certification elections (RC and RM)" is a panel/section banner centered across the data columns; its label is placed in the stub with the remaining cells empty. Printed data note (not corrected): the "Under 10" and "10 to 19" rows both show 542 total elections and 20.1 percent, and the component columns of the total row (1,259 + 110 + 79 + 1,251 = 2,699) do agree with the printed total. Individual size-class percentages are as printed and were not recomputed.
p. 190. Thirteen printed columns. The crop is a continuation page: the first four rows (1,000 to 1,999 through Over 9,999) finish the preceding section (panel A, RC elections), whose section label is on the earlier page; the body then continues past the bottom of the crop after "170 to 199", so the table is cut off at the foot. The section line "B. Decertification elections (RD)" is printed centred as a banner across the twelve data columns (not in the stub column); it is given here in the stub cell with the remaining cells empty. "Total RD elections" row: the Cumulative percent of total cell holds a short dash rule ("--", the report's not-applicable mark) and is transcribed as "". That row's label is printed indented/centred in the stub. The caption carries a superscript 1, but no footnote text is printed within this crop, so `footnotes` is empty. Internal checks all agree with the print: 109 + 6 + 7 + 242 = 364 total RD elections, and the percent-of-total, cumulative-percent and percent-by-size-class figures reproduce from the counts throughout, so no misprint is suspected. "80 to 89" and "90 to 99" both show 738 eligible to vote; the digits are clearly legible in both rows and this is a genuine coincidence, not a duplication error.
p. 191. This crop is a "—Continued" page: it shows the repeated column headings but only the last four size classes of the table, which begins on an earlier page. The footnote line at the bottom is clipped by the crop (the lower halves of the letters are cut off), but it reads "1 See Glossary of terms for definitions."; the footnote marker 1 is attached to the caption, which is not transcribed. All data cells are crisp and unambiguous.
Source image

Source data: U.S. NLRB Annual Reports (public domain). Reconstruction by NLRB Stats Archive. Read by claude-opus-5 (effort max, prompt extract_v1) from the 300-dpi scan; stitched by page. Updated October 2026.