NLRB Stats Archive › Annual Reports › FY2001 › Geographic Distribution of Representation Elections Held in Cases Closed, Fiscal Year 2001
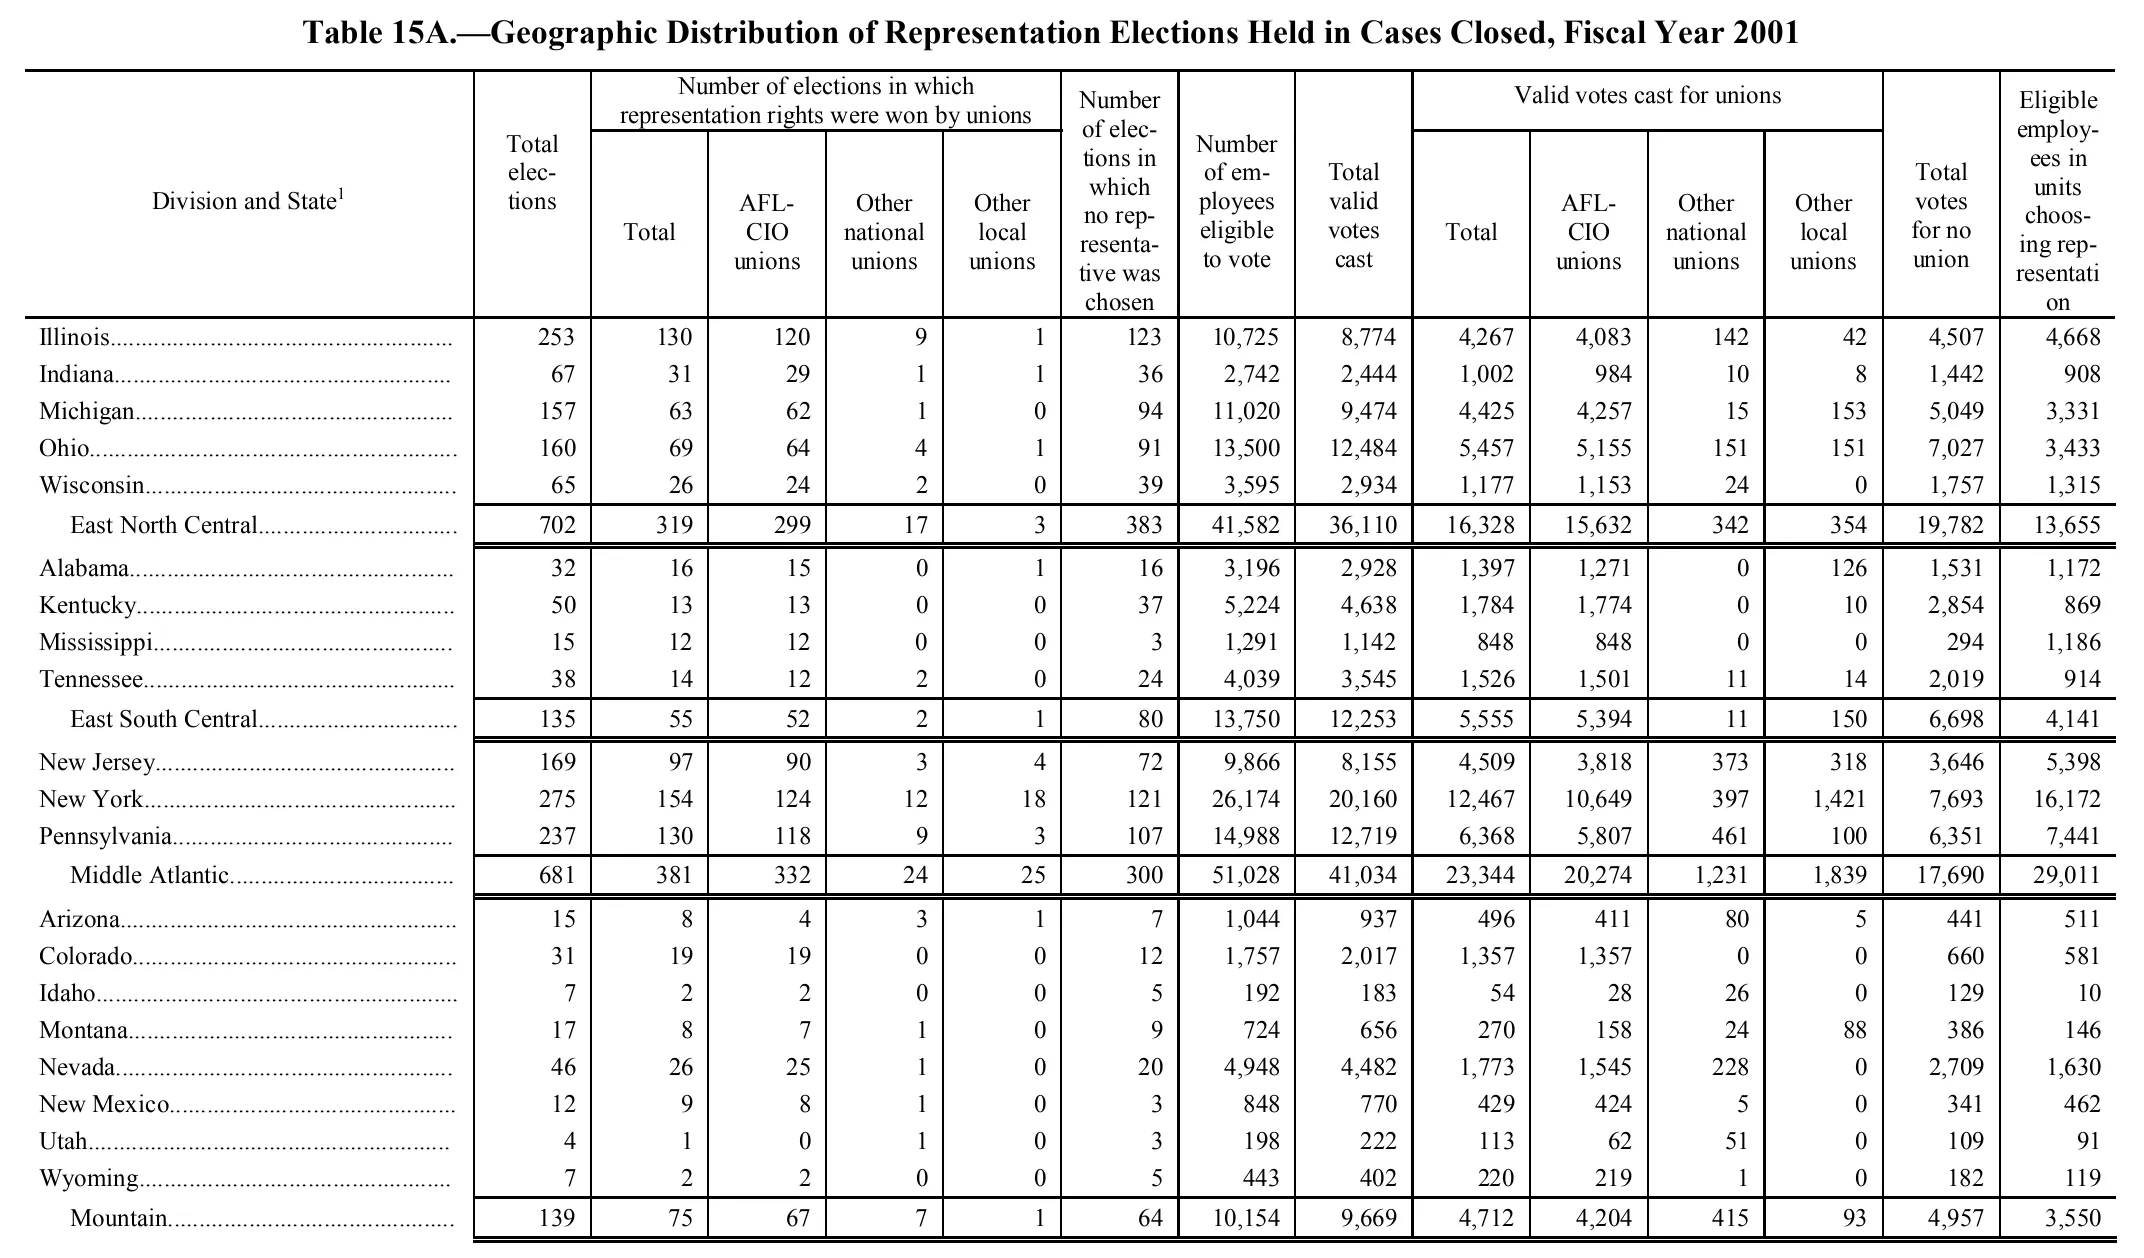
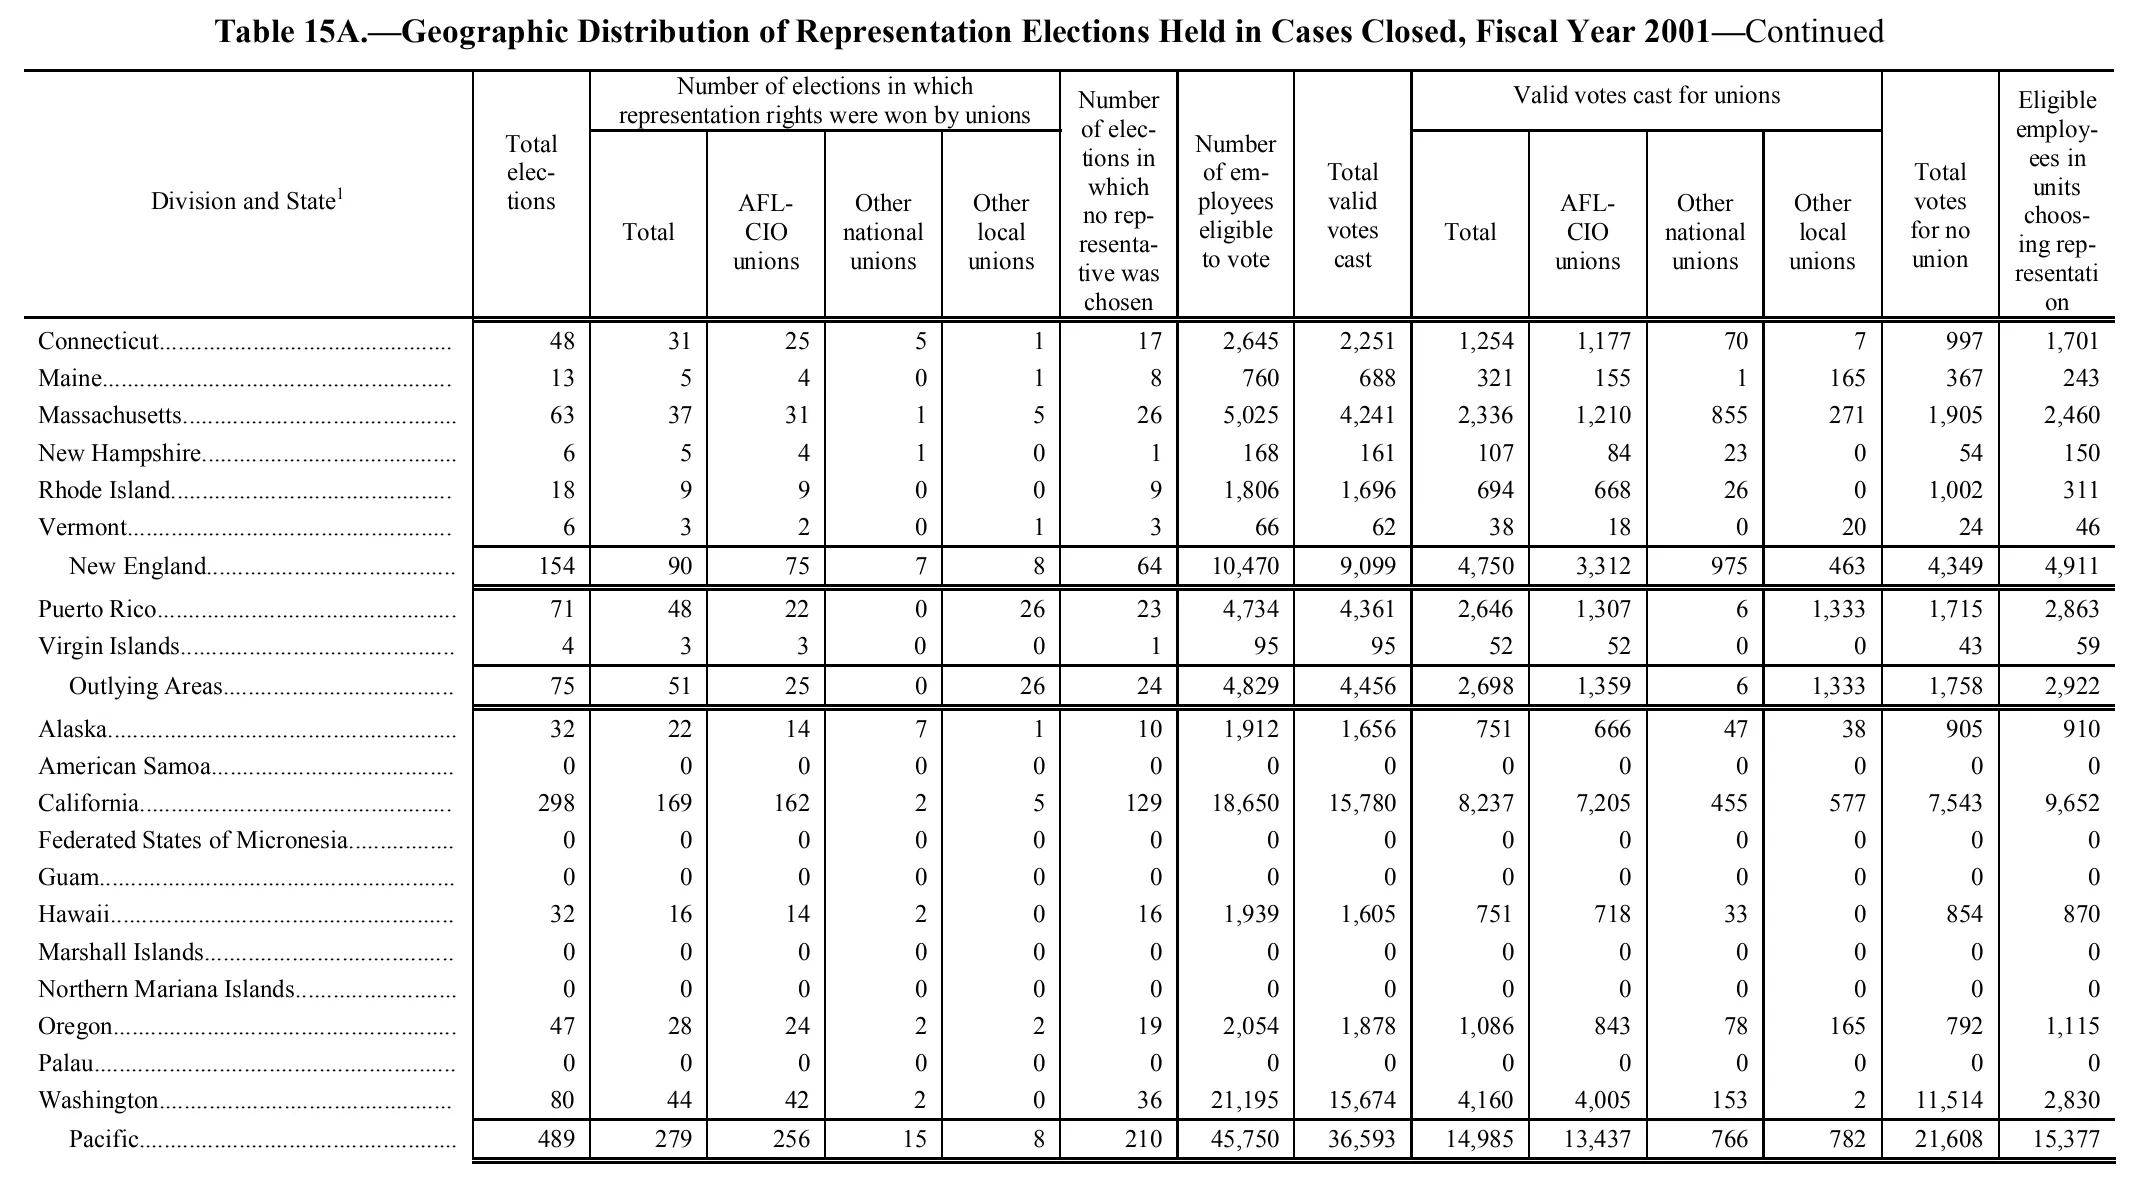
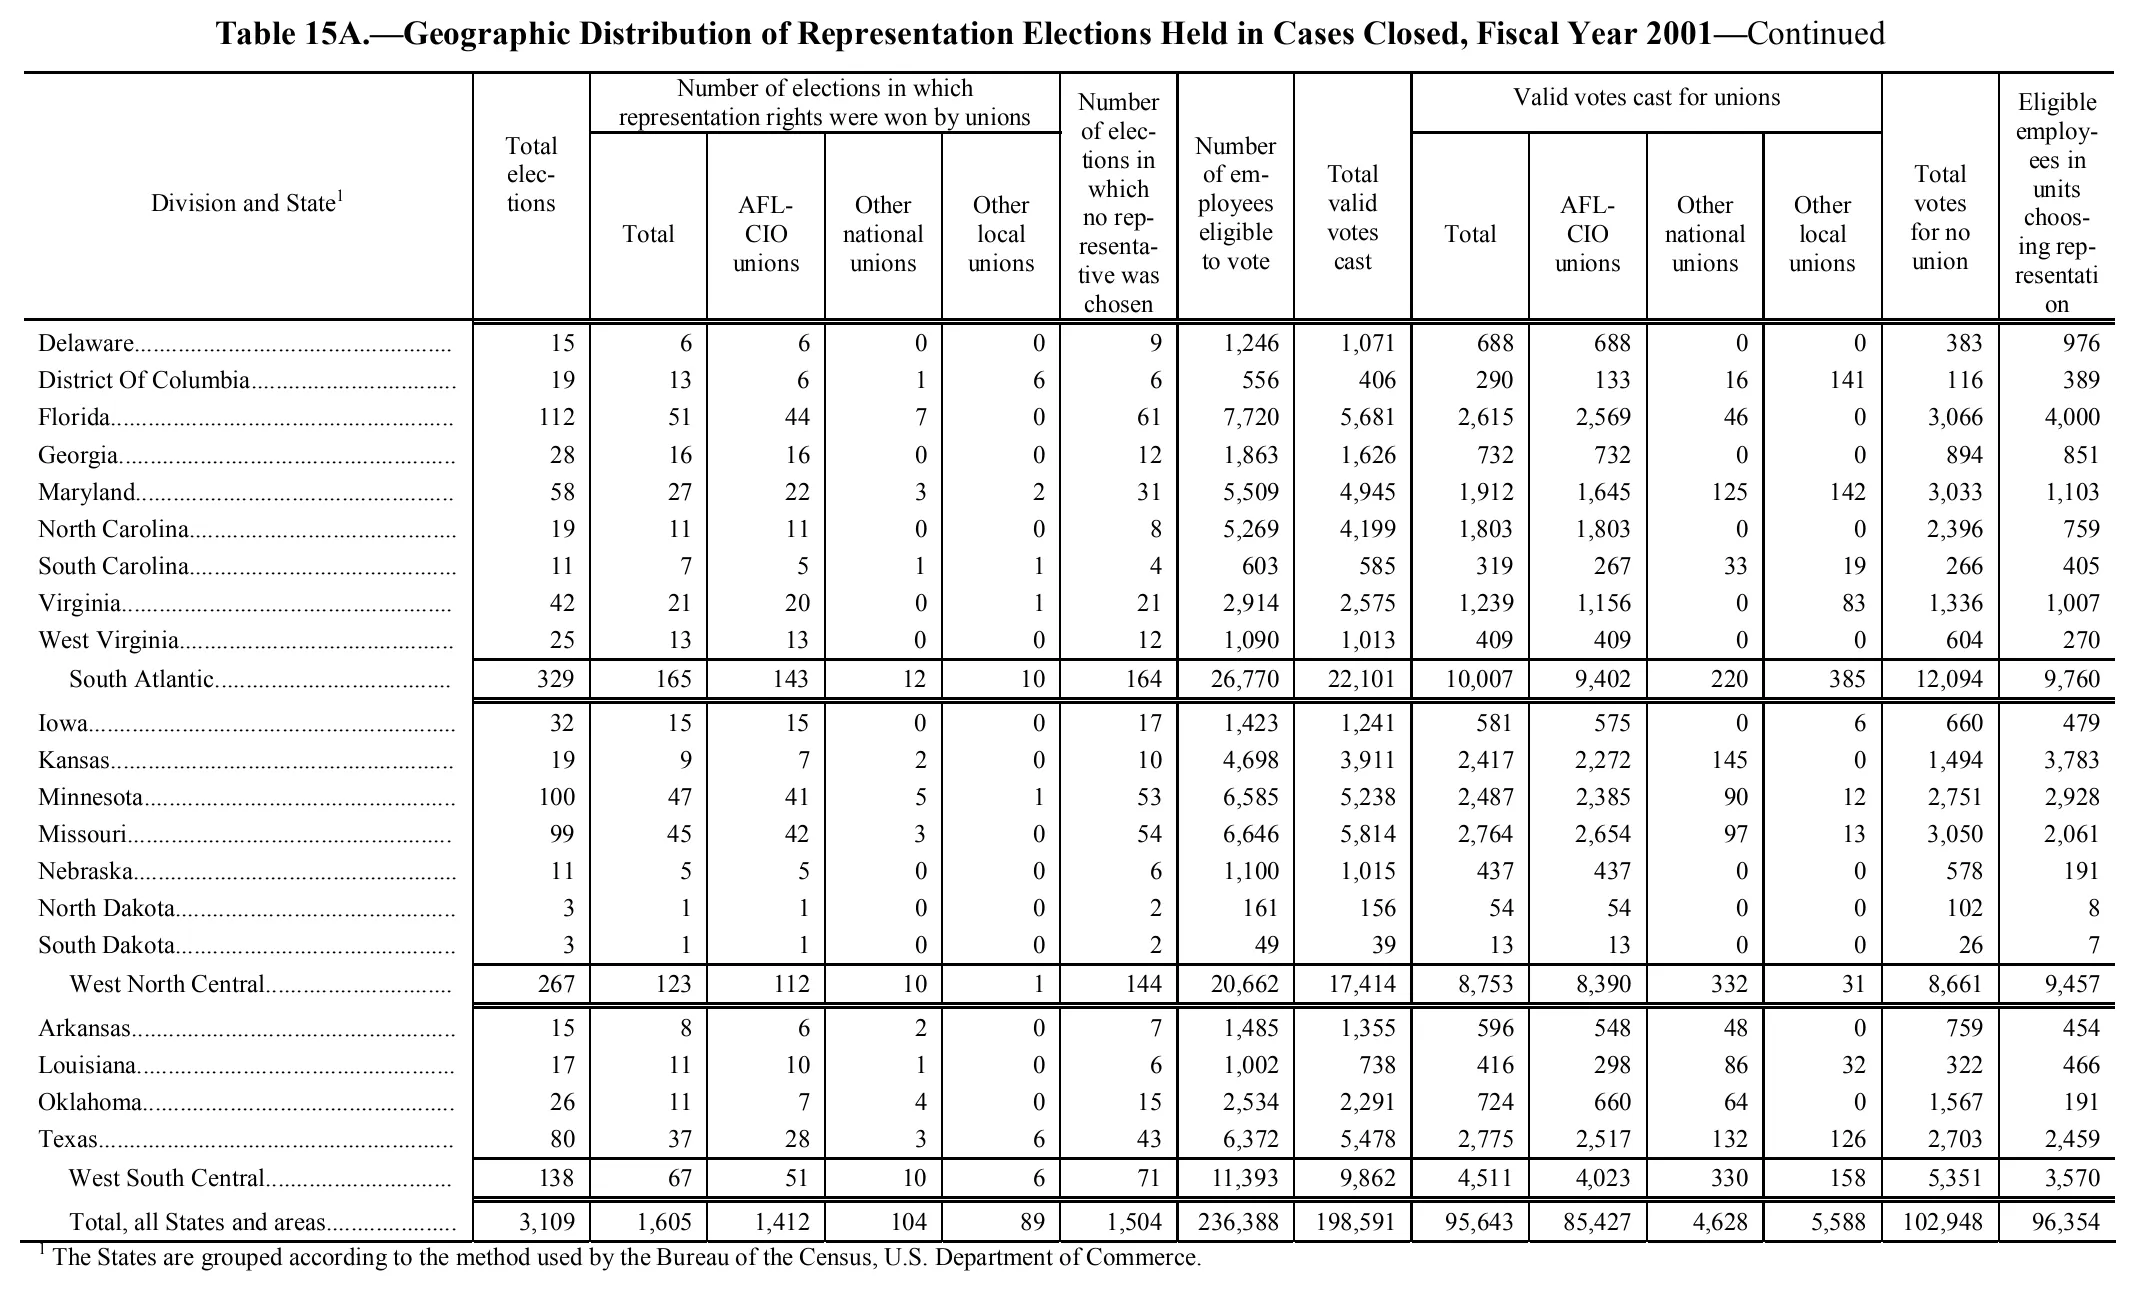
Geographic Distribution of Representation Elections Held in Cases Closed, Fiscal Year 2001
Stitched from pp. 174–176.
| Division and State | Total elections | Number of elections in which representation rights were won by unions | Number of elections in which no representative was chosen | Number of employees eligible to vote | Total valid votes cast | Valid votes cast for unions | Total votes for no union | Eligible employees in units choosing representation | ||||||
|---|---|---|---|---|---|---|---|---|---|---|---|---|---|---|
| Division and State | Total elections | Total | AFL-CIO unions | Other national unions | Other local unions | Number of elections in which no representative was chosen | Number of employees eligible to vote | Total valid votes cast | Total | AFL-CIO unions | Other national unions | Other local unions | Total votes for no union | Eligible employees in units choosing representation |
| Illinois | 253 | 130 | 120 | 9 | 1 | 123 | 10,725 | 8,774 | 4,267 | 4,083 | 142 | 42 | 4,507 | 4,668 |
| Indiana | 67 | 31 | 29 | 1 | 1 | 36 | 2,742 | 2,444 | 1,002 | 984 | 10 | 8 | 1,442 | 908 |
| Michigan | 157 | 63 | 62 | 1 | 0 | 94 | 11,020 | 9,474 | 4,425 | 4,257 | 15 | 153 | 5,049 | 3,331 |
| Ohio | 160 | 69 | 64 | 4 | 1 | 91 | 13,500 | 12,484 | 5,457 | 5,155 | 151 | 151 | 7,027 | 3,433 |
| Wisconsin | 65 | 26 | 24 | 2 | 0 | 39 | 3,595 | 2,934 | 1,177 | 1,153 | 24 | 0 | 1,757 | 1,315 |
| East North Central | 702 | 319 | 299 | 17 | 3 | 383 | 41,582 | 36,110 | 16,328 | 15,632 | 342 | 354 | 19,782 | 13,655 |
| Alabama | 32 | 16 | 15 | 0 | 1 | 16 | 3,196 | 2,928 | 1,397 | 1,271 | 0 | 126 | 1,531 | 1,172 |
| Kentucky | 50 | 13 | 13 | 0 | 0 | 37 | 5,224 | 4,638 | 1,784 | 1,774 | 0 | 10 | 2,854 | 869 |
| Mississippi | 15 | 12 | 12 | 0 | 0 | 3 | 1,291 | 1,142 | 848 | 848 | 0 | 0 | 294 | 1,186 |
| Tennessee | 38 | 14 | 12 | 2 | 0 | 24 | 4,039 | 3,545 | 1,526 | 1,501 | 11 | 14 | 2,019 | 914 |
| East South Central | 135 | 55 | 52 | 2 | 1 | 80 | 13,750 | 12,253 | 5,555 | 5,394 | 11 | 150 | 6,698 | 4,141 |
| New Jersey | 169 | 97 | 90 | 3 | 4 | 72 | 9,866 | 8,155 | 4,509 | 3,818 | 373 | 318 | 3,646 | 5,398 |
| New York | 275 | 154 | 124 | 12 | 18 | 121 | 26,174 | 20,160 | 12,467 | 10,649 | 397 | 1,421 | 7,693 | 16,172 |
| Pennsylvania | 237 | 130 | 118 | 9 | 3 | 107 | 14,988 | 12,719 | 6,368 | 5,807 | 461 | 100 | 6,351 | 7,441 |
| Middle Atlantic | 681 | 381 | 332 | 24 | 25 | 300 | 51,028 | 41,034 | 23,344 | 20,274 | 1,231 | 1,839 | 17,690 | 29,011 |
| Arizona | 15 | 8 | 4 | 3 | 1 | 7 | 1,044 | 937 | 496 | 411 | 80 | 5 | 441 | 511 |
| Colorado | 31 | 19 | 19 | 0 | 0 | 12 | 1,757 | 2,017 | 1,357 | 1,357 | 0 | 0 | 660 | 581 |
| Idaho | 7 | 2 | 2 | 0 | 0 | 5 | 192 | 183 | 54 | 28 | 26 | 0 | 129 | 10 |
| Montana | 17 | 8 | 7 | 1 | 0 | 9 | 724 | 656 | 270 | 158 | 24 | 88 | 386 | 146 |
| Nevada | 46 | 26 | 25 | 1 | 0 | 20 | 4,948 | 4,482 | 1,773 | 1,545 | 228 | 0 | 2,709 | 1,630 |
| New Mexico | 12 | 9 | 8 | 1 | 0 | 3 | 848 | 770 | 429 | 424 | 5 | 0 | 341 | 462 |
| Utah | 4 | 1 | 0 | 1 | 0 | 3 | 198 | 222 | 113 | 62 | 51 | 0 | 109 | 91 |
| Wyoming | 7 | 2 | 2 | 0 | 0 | 5 | 443 | 402 | 220 | 219 | 1 | 0 | 182 | 119 |
| Mountain | 139 | 75 | 67 | 7 | 1 | 64 | 10,154 | 9,669 | 4,712 | 4,204 | 415 | 93 | 4,957 | 3,550 |
| Connecticut | 48 | 31 | 25 | 5 | 1 | 17 | 2,645 | 2,251 | 1,254 | 1,177 | 70 | 7 | 997 | 1,701 |
| Maine | 13 | 5 | 4 | 0 | 1 | 8 | 760 | 688 | 321 | 155 | 1 | 165 | 367 | 243 |
| Massachusetts | 63 | 37 | 31 | 1 | 5 | 26 | 5,025 | 4,241 | 2,336 | 1,210 | 855 | 271 | 1,905 | 2,460 |
| New Hampshire | 6 | 5 | 4 | 1 | 0 | 1 | 168 | 161 | 107 | 84 | 23 | 0 | 54 | 150 |
| Rhode Island | 18 | 9 | 9 | 0 | 0 | 9 | 1,806 | 1,696 | 694 | 668 | 26 | 0 | 1,002 | 311 |
| Vermont | 6 | 3 | 2 | 0 | 1 | 3 | 66 | 62 | 38 | 18 | 0 | 20 | 24 | 46 |
| New England | 154 | 90 | 75 | 7 | 8 | 64 | 10,470 | 9,099 | 4,750 | 3,312 | 975 | 463 | 4,349 | 4,911 |
| Puerto Rico | 71 | 48 | 22 | 0 | 26 | 23 | 4,734 | 4,361 | 2,646 | 1,307 | 6 | 1,333 | 1,715 | 2,863 |
| Virgin Islands | 4 | 3 | 3 | 0 | 0 | 1 | 95 | 95 | 52 | 52 | 0 | 0 | 43 | 59 |
| Outlying Areas | 75 | 51 | 25 | 0 | 26 | 24 | 4,829 | 4,456 | 2,698 | 1,359 | 6 | 1,333 | 1,758 | 2,922 |
| Alaska | 32 | 22 | 14 | 7 | 1 | 10 | 1,912 | 1,656 | 751 | 666 | 47 | 38 | 905 | 910 |
| American Samoa | 0 | 0 | 0 | 0 | 0 | 0 | 0 | 0 | 0 | 0 | 0 | 0 | 0 | 0 |
| California | 298 | 169 | 162 | 2 | 5 | 129 | 18,650 | 15,780 | 8,237 | 7,205 | 455 | 577 | 7,543 | 9,652 |
| Federated States of Micronesia | 0 | 0 | 0 | 0 | 0 | 0 | 0 | 0 | 0 | 0 | 0 | 0 | 0 | 0 |
| Guam | 0 | 0 | 0 | 0 | 0 | 0 | 0 | 0 | 0 | 0 | 0 | 0 | 0 | 0 |
| Hawaii | 32 | 16 | 14 | 2 | 0 | 16 | 1,939 | 1,605 | 751 | 718 | 33 | 0 | 854 | 870 |
| Marshall Islands | 0 | 0 | 0 | 0 | 0 | 0 | 0 | 0 | 0 | 0 | 0 | 0 | 0 | 0 |
| Northern Mariana Islands | 0 | 0 | 0 | 0 | 0 | 0 | 0 | 0 | 0 | 0 | 0 | 0 | 0 | 0 |
| Oregon | 47 | 28 | 24 | 2 | 2 | 19 | 2,054 | 1,878 | 1,086 | 843 | 78 | 165 | 792 | 1,115 |
| Palau | 0 | 0 | 0 | 0 | 0 | 0 | 0 | 0 | 0 | 0 | 0 | 0 | 0 | 0 |
| Washington | 80 | 44 | 42 | 2 | 0 | 36 | 21,195 | 15,674 | 4,160 | 4,005 | 153 | 2 | 11,514 | 2,830 |
| Pacific | 489 | 279 | 256 | 15 | 8 | 210 | 45,750 | 36,593 | 14,985 | 13,437 | 766 | 782 | 21,608 | 15,377 |
| Delaware | 15 | 6 | 6 | 0 | 0 | 9 | 1,246 | 1,071 | 688 | 688 | 0 | 0 | 383 | 976 |
| District Of Columbia | 19 | 13 | 6 | 1 | 6 | 6 | 556 | 406 | 290 | 133 | 16 | 141 | 116 | 389 |
| Florida | 112 | 51 | 44 | 7 | 0 | 61 | 7,720 | 5,681 | 2,615 | 2,569 | 46 | 0 | 3,066 | 4,000 |
| Georgia | 28 | 16 | 16 | 0 | 0 | 12 | 1,863 | 1,626 | 732 | 732 | 0 | 0 | 894 | 851 |
| Maryland | 58 | 27 | 22 | 3 | 2 | 31 | 5,509 | 4,945 | 1,912 | 1,645 | 125 | 142 | 3,033 | 1,103 |
| North Carolina | 19 | 11 | 11 | 0 | 0 | 8 | 5,269 | 4,199 | 1,803 | 1,803 | 0 | 0 | 2,396 | 759 |
| South Carolina | 11 | 7 | 5 | 1 | 1 | 4 | 603 | 585 | 319 | 267 | 33 | 19 | 266 | 405 |
| Virginia | 42 | 21 | 20 | 0 | 1 | 21 | 2,914 | 2,575 | 1,239 | 1,156 | 0 | 83 | 1,336 | 1,007 |
| West Virginia | 25 | 13 | 13 | 0 | 0 | 12 | 1,090 | 1,013 | 409 | 409 | 0 | 0 | 604 | 270 |
| South Atlantic | 329 | 165 | 143 | 12 | 10 | 164 | 26,770 | 22,101 | 10,007 | 9,402 | 220 | 385 | 12,094 | 9,760 |
| Iowa | 32 | 15 | 15 | 0 | 0 | 17 | 1,423 | 1,241 | 581 | 575 | 0 | 6 | 660 | 479 |
| Kansas | 19 | 9 | 7 | 2 | 0 | 10 | 4,698 | 3,911 | 2,417 | 2,272 | 145 | 0 | 1,494 | 3,783 |
| Minnesota | 100 | 47 | 41 | 5 | 1 | 53 | 6,585 | 5,238 | 2,487 | 2,385 | 90 | 12 | 2,751 | 2,928 |
| Missouri | 99 | 45 | 42 | 3 | 0 | 54 | 6,646 | 5,814 | 2,764 | 2,654 | 97 | 13 | 3,050 | 2,061 |
| Nebraska | 11 | 5 | 5 | 0 | 0 | 6 | 1,100 | 1,015 | 437 | 437 | 0 | 0 | 578 | 191 |
| North Dakota | 3 | 1 | 1 | 0 | 0 | 2 | 161 | 156 | 54 | 54 | 0 | 0 | 102 | 8 |
| South Dakota | 3 | 1 | 1 | 0 | 0 | 2 | 49 | 39 | 13 | 13 | 0 | 0 | 26 | 7 |
| West North Central | 267 | 123 | 112 | 10 | 1 | 144 | 20,662 | 17,414 | 8,753 | 8,390 | 332 | 31 | 8,661 | 9,457 |
| Arkansas | 15 | 8 | 6 | 2 | 0 | 7 | 1,485 | 1,355 | 596 | 548 | 48 | 0 | 759 | 454 |
| Louisiana | 17 | 11 | 10 | 1 | 0 | 6 | 1,002 | 738 | 416 | 298 | 86 | 32 | 322 | 466 |
| Oklahoma | 26 | 11 | 7 | 4 | 0 | 15 | 2,534 | 2,291 | 724 | 660 | 64 | 0 | 1,567 | 191 |
| Texas | 80 | 37 | 28 | 3 | 6 | 43 | 6,372 | 5,478 | 2,775 | 2,517 | 132 | 126 | 2,703 | 2,459 |
| West South Central | 138 | 67 | 51 | 10 | 6 | 71 | 11,393 | 9,862 | 4,511 | 4,023 | 330 | 158 | 5,351 | 3,570 |
| Total, all States and areas | 3,109 | 1,605 | 1,412 | 104 | 89 | 1,504 | 236,388 | 198,591 | 95,643 | 85,427 | 4,628 | 5,588 | 102,948 | 96,354 |
- 1 The States are grouped according to the method used by the Bureau of the Census, U.S. Department of Commerce.
805 of 805 figures sit in a row or column sum that works out.
Reader’s notes
p. 174. The crop is cut off at the bottom: the table body ends at the "Mountain" division subtotal, and further divisions/states (and the grand total, if any) continue beyond the crop. The stub heading carries a superscript 1 marker ("Division and State^1"), but the text of footnote 1 is not printed within this crop, so `footnotes` is empty. Column 14 ("Eligible employees in units choosing representation") is printed hyphenated across seven lines ("Eligible employ- ees in units choos- ing rep- resentati on"); it has been joined and de-hyphenated. Arithmetic checks: all four division subtotal rows shown (East North Central, East South Central, Middle Atlantic, Mountain) sum exactly from their member states in every one of the 14 numeric columns, which confirms the column alignment and the digits. Two apparent source anomalies, transcribed exactly as printed: Colorado shows 1,757 employees eligible to vote but 2,017 total valid votes cast, and Utah shows 198 eligible but 222 total valid votes cast — in both rows the votes cast exceed the eligible employees. Idaho's column 14 value (10) is unusually small relative to its 192 eligible employees, but it is clearly printed as "10" and the Mountain subtotal of 3,550 confirms it. Ohio has the same value (151) printed in both "Other national unions" and "Other local unions" under valid votes cast; both are confirmed by the East North Central subtotals (342 and 354).
p. 175. 15 columns: stub, "Total elections", four columns under "Number of elections in which representation rights were won by unions", "Number of elections in which no representative was chosen", "Number of employees eligible to vote", "Total valid votes cast", four columns under "Valid votes cast for unions", "Total votes for no union", "Eligible employees in units choosing representation". The last heading is printed broken as "Eligible employ- ees in units choos- ing rep- resentati on"; joined to "Eligible employees in units choosing representation". The stub heading carries footnote marker 1 ("Division and State^1"), but no footnote text appears on this crop — this is a "—Continued" page and the footnote block presumably sits on the final page of the table. The three division subtotal rows (New England, Outlying Areas, Pacific) are printed indented and set off by rules; they are transcribed as ordinary rows with their labels as printed, without the indentation. All arithmetic is internally consistent as transcribed: each subtotal row equals the sum of its member states in all 14 numeric columns, and in every row the union vote columns sum to the union total and union total + votes for no union = total valid votes cast. No printed value appeared doubtful or illegible.
p. 176. The crop is a continuation page: it carries the full column headings but only the last three census divisions (South Atlantic, West North Central, West South Central) plus the grand total row "Total, all States and areas"; the earlier divisions are on preceding pages, so the grand total is far larger than the sum of the rows shown here. The three division subtotal rows (South Atlantic, West North Central, West South Central) are each printed in the stub indented under their member states; all three check out exactly against the sum of their own states in every one of the 14 numeric columns, which supports the digit reading. The last column heading is typeset broken as "Eligible employ-/ees in/units/choos-/ing rep-/resentati/on" and has been joined to "Eligible employees in units choosing representation" (the final break falls inside "representation" without a hyphen). "District Of Columbia" is transcribed with the capital "Of" as printed. No footnote markers appear on any data cell; the only marker is the superscript 1 on the stub heading "Division and State".
Source image
Source data: U.S. NLRB Annual Reports (public domain). Reconstruction by NLRB Stats Archive. Read by claude-opus-5 (effort max, prompt extract_v1) from the 300-dpi scan; stitched by page. Updated October 2026.