NLRB Stats Archive › Annual Reports › FY2001 › Analysis of Methods of Disposition of Representation and Union Deauthorization Cases Closed, Fiscal Year 2001
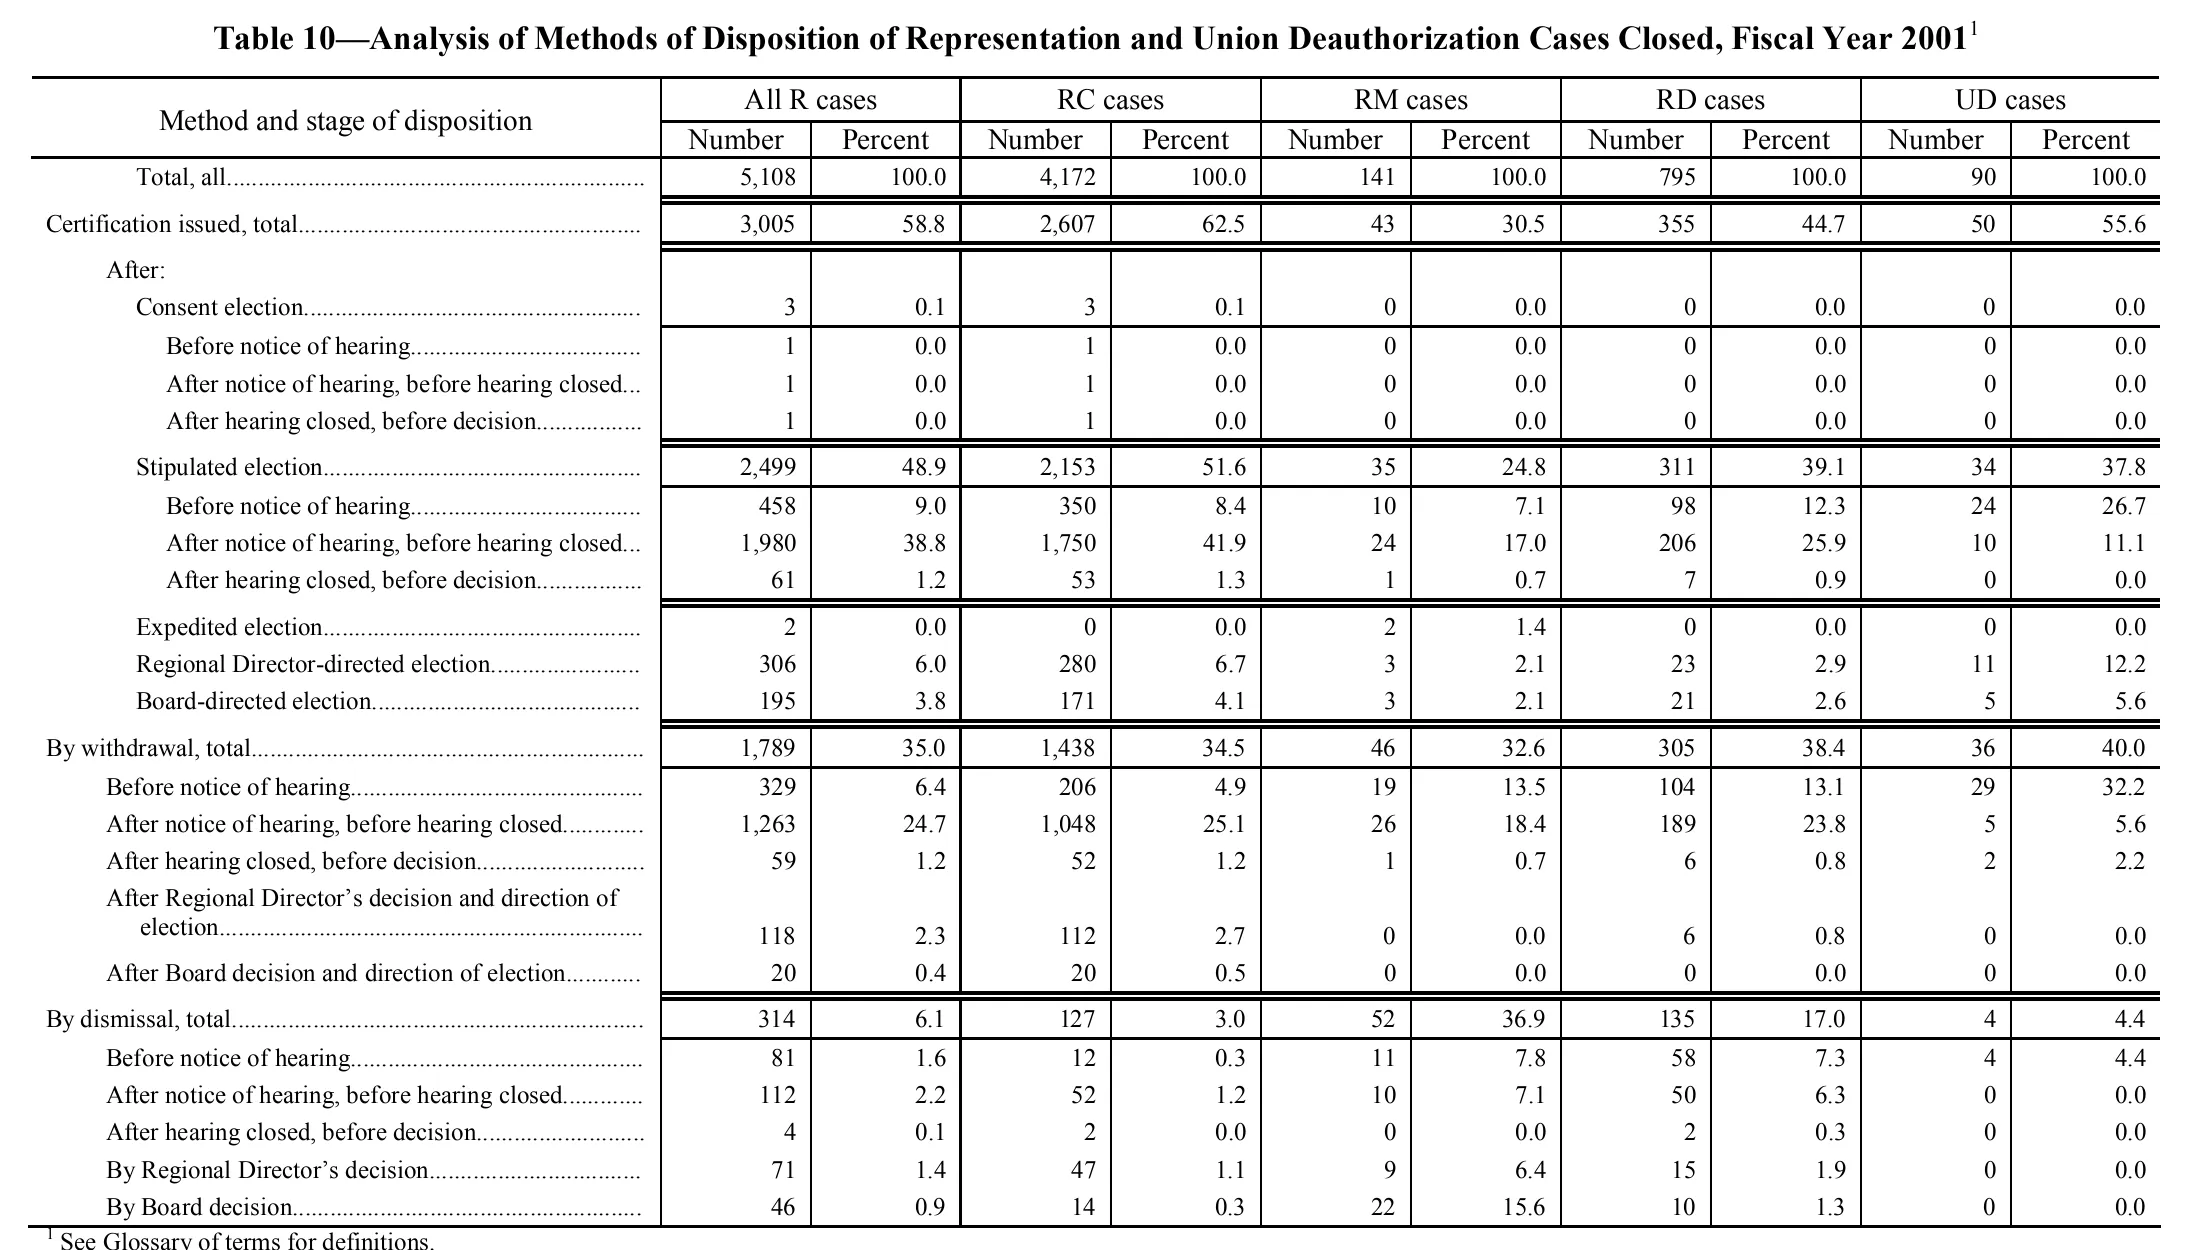
Analysis of Methods of Disposition of Representation and Union Deauthorization Cases Closed, Fiscal Year 2001
| Method and stage of disposition | All R cases | RC cases | RM cases | RD cases | UD cases | |||||
|---|---|---|---|---|---|---|---|---|---|---|
| Method and stage of disposition | Number | Percent | Number | Percent | Number | Percent | Number | Percent | Number | Percent |
| Total, all | 5,108 | 100.0 | 4,172 | 100.0 | 141 | 100.0 | 795 | 100.0 | 90 | 100.0 |
| Certification issued, total | 3,005 | 58.8 | 2,607 | 62.5 | 43 | 30.5 | 355 | 44.7 | 50 | 55.6 |
| After: | ||||||||||
| Consent election | 3 | 0.1 | 3 | 0.1 | 0 | 0.0 | 0 | 0.0 | 0 | 0.0 |
| Before notice of hearing | 1 | 0.0 | 1 | 0.0 | 0 | 0.0 | 0 | 0.0 | 0 | 0.0 |
| After notice of hearing, before hearing closed | 1 | 0.0 | 1 | 0.0 | 0 | 0.0 | 0 | 0.0 | 0 | 0.0 |
| After hearing closed, before decision | 1 | 0.0 | 1 | 0.0 | 0 | 0.0 | 0 | 0.0 | 0 | 0.0 |
| Stipulated election | 2,499 | 48.9 | 2,153 | 51.6 | 35 | 24.8 | 311 | 39.1 | 34 | 37.8 |
| Before notice of hearing | 458 | 9.0 | 350 | 8.4 | 10 | 7.1 | 98 | 12.3 | 24 | 26.7 |
| After notice of hearing, before hearing closed | 1,980 | 38.8 | 1,750 | 41.9 | 24 | 17.0 | 206 | 25.9 | 10 | 11.1 |
| After hearing closed, before decision | 61 | 1.2 | 53 | 1.3 | 1 | 0.7 | 7 | 0.9 | 0 | 0.0 |
| Expedited election | 2 | 0.0 | 0 | 0.0 | 2 | 1.4 | 0 | 0.0 | 0 | 0.0 |
| Regional Director-directed election | 306 | 6.0 | 280 | 6.7 | 3 | 2.1 | 23 | 2.9 | 11 | 12.2 |
| Board-directed election | 195 | 3.8 | 171 | 4.1 | 3 | 2.1 | 21 | 2.6 | 5 | 5.6 |
| By withdrawal, total | 1,789 | 35.0 | 1,438 | 34.5 | 46 | 32.6 | 305 | 38.4 | 36 | 40.0 |
| Before notice of hearing | 329 | 6.4 | 206 | 4.9 | 19 | 13.5 | 104 | 13.1 | 29 | 32.2 |
| After notice of hearing, before hearing closed | 1,263 | 24.7 | 1,048 | 25.1 | 26 | 18.4 | 189 | 23.8 | 5 | 5.6 |
| After hearing closed, before decision | 59 | 1.2 | 52 | 1.2 | 1 | 0.7 | 6 | 0.8 | 2 | 2.2 |
| After Regional Director's decision and direction of election | 118 | 2.3 | 112 | 2.7 | 0 | 0.0 | 6 | 0.8 | 0 | 0.0 |
| After Board decision and direction of election | 20 | 0.4 | 20 | 0.5 | 0 | 0.0 | 0 | 0.0 | 0 | 0.0 |
| By dismissal, total | 314 | 6.1 | 127 | 3.0 | 52 | 36.9 | 135 | 17.0 | 4 | 4.4 |
| Before notice of hearing | 81 | 1.6 | 12 | 0.3 | 11 | 7.8 | 58 | 7.3 | 4 | 4.4 |
| After notice of hearing, before hearing closed | 112 | 2.2 | 52 | 1.2 | 10 | 7.1 | 50 | 6.3 | 0 | 0.0 |
| After hearing closed, before decision | 4 | 0.1 | 2 | 0.0 | 0 | 0.0 | 2 | 0.3 | 0 | 0.0 |
| By Regional Director's decision | 71 | 1.4 | 47 | 1.1 | 9 | 6.4 | 15 | 1.9 | 0 | 0.0 |
| By Board decision | 46 | 0.9 | 14 | 0.3 | 22 | 15.6 | 10 | 1.3 | 0 | 0.0 |
- 1 See Glossary of terms for definitions.
95 of 99 figures sit in a row or column sum that works out.
Reader’s notes
p. 159. Eleven columns: stub plus Number/Percent pairs for All R, RC, RM, RD and UD cases. The footnote line at the very bottom of the crop is clipped by the lower edge (the descenders of "definitions." are partly cut), but the text is legible; no other footnote text appears below it. The row "After:" is a section label with no values. All internal sums check out (e.g. 3,005 + 1,789 + 314 = 5,108 for All R cases, and each section's components sum to its total in every column), so no apparent misprints. The apostrophes in "Regional Director's" are typographic right single quotes in the original; transcribed as plain apostrophes.
Source image
Source data: U.S. NLRB Annual Reports (public domain). Reconstruction by NLRB Stats Archive. Read by claude-opus-5 (effort max, prompt extract_v1) from the 300-dpi scan; stitched by page. Updated October 2026.