NLRB Stats Archive › Annual Reports › FY2001 › Geographic Distribution of Cases Received, Fiscal Year 2001
Geographic Distribution of Cases Received, Fiscal Year 2001
Stitched from pp. 149–151.
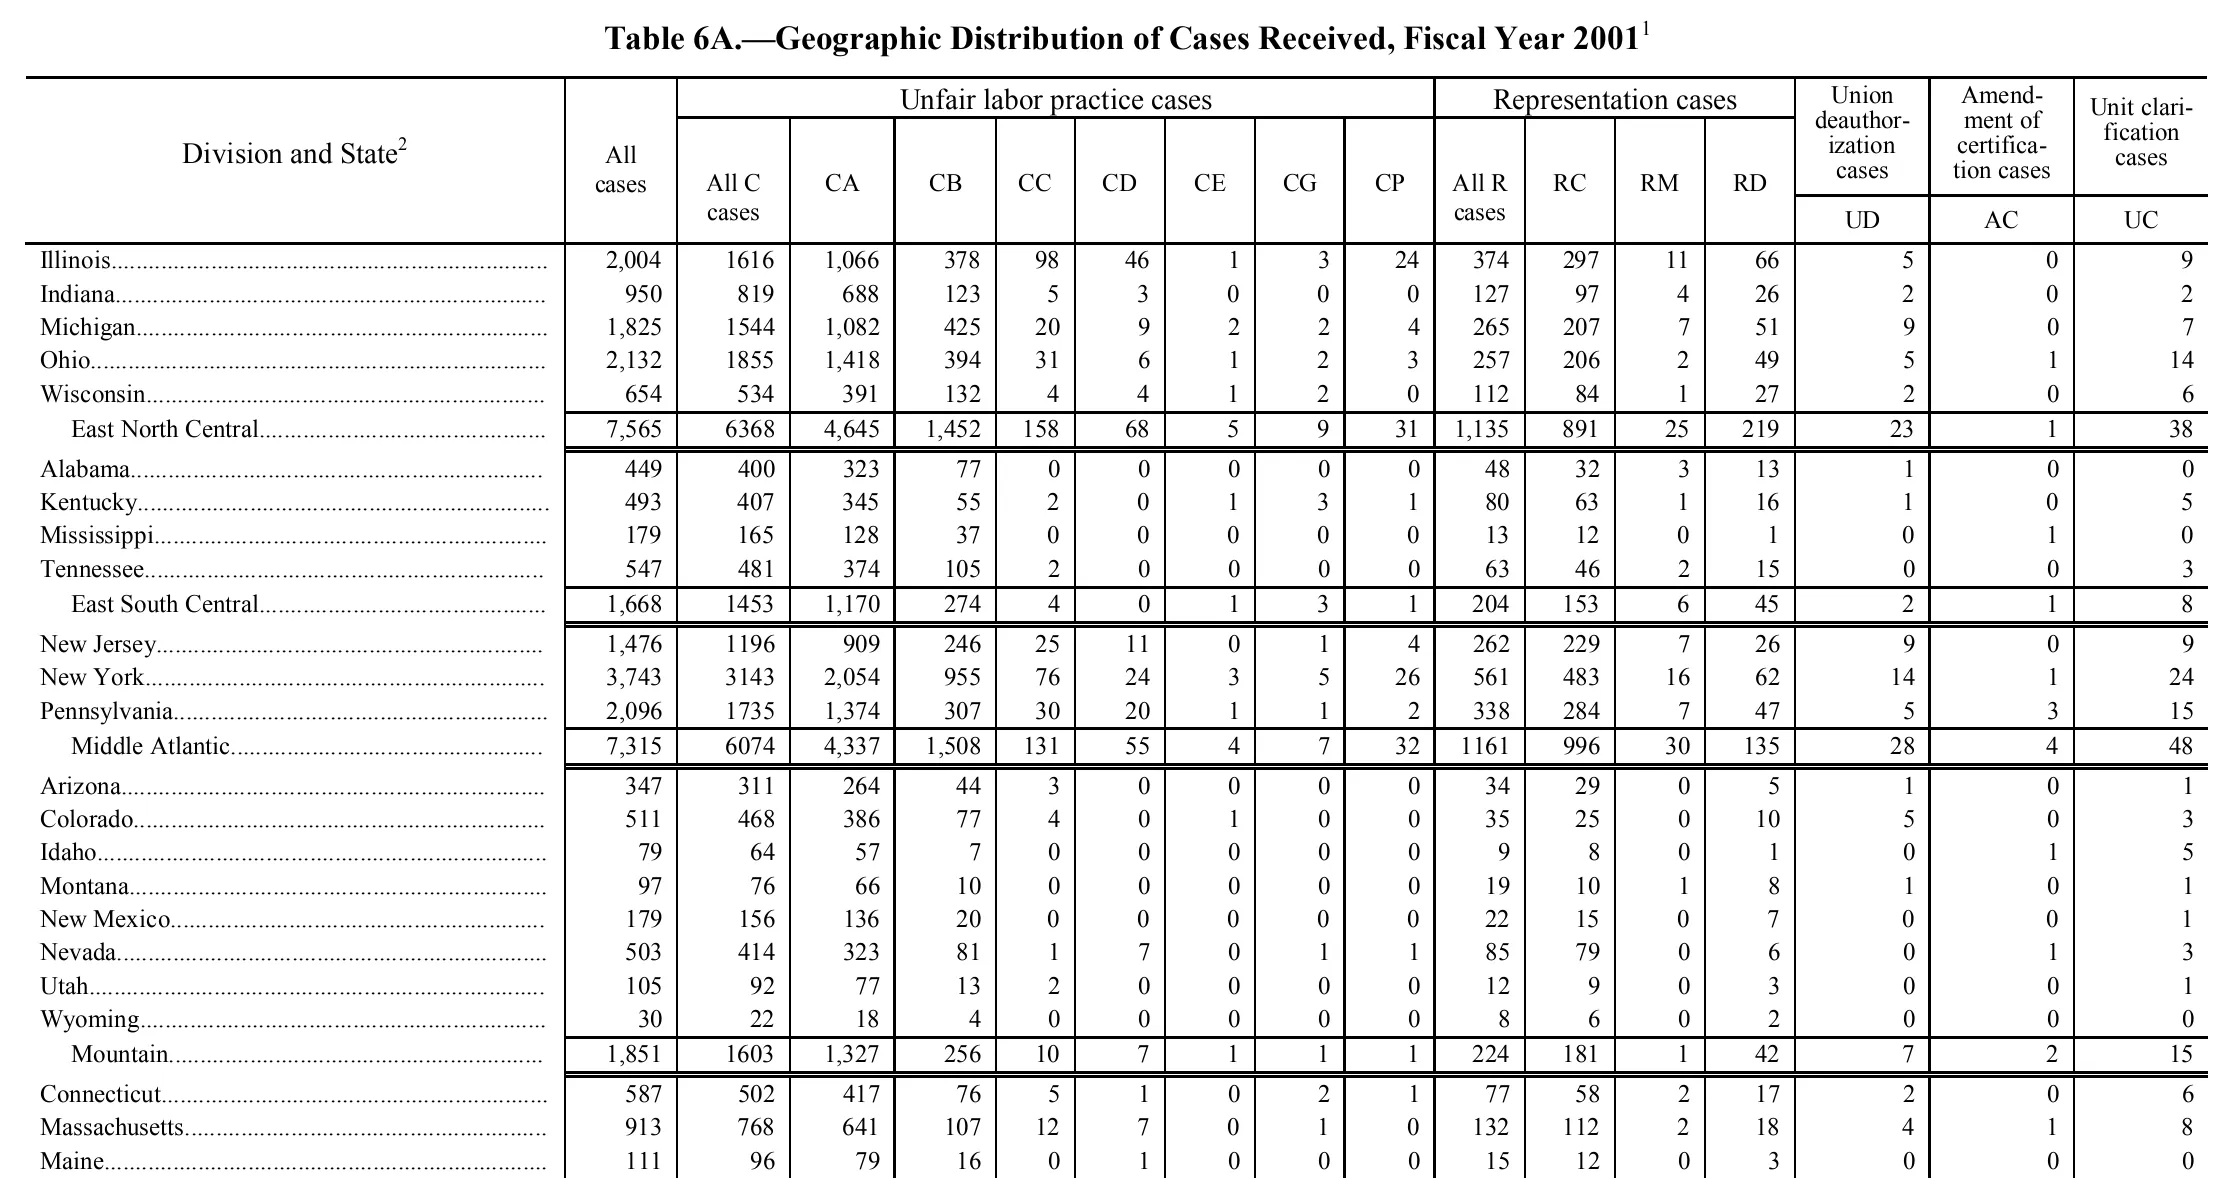
| Division and State | All cases | Unfair labor practice cases | Representation cases | Union deauthorization cases | Amendment of certification cases | Unit clarification cases | ||||||||||
|---|---|---|---|---|---|---|---|---|---|---|---|---|---|---|---|---|
| Division and State | All cases | All C cases | CA | CB | CC | CD | CE | CG | CP | All R cases | RC | RM | RD | Union deauthorization cases | Amendment of certification cases | Unit clarification cases |
| Division and State | All cases | All C cases | CA | CB | CC | CD | CE | CG | CP | All R cases | RC | RM | RD | UD | AC | UC |
| Illinois | 2,004 | 1616 | 1,066 | 378 | 98 | 46 | 1 | 3 | 24 | 374 | 297 | 11 | 66 | 5 | 0 | 9 |
| Indiana | 950 | 819 | 688 | 123 | 5 | 3 | 0 | 0 | 0 | 127 | 97 | 4 | 26 | 2 | 0 | 2 |
| Michigan | 1,825 | 1544 | 1,082 | 425 | 20 | 9 | 2 | 2 | 4 | 265 | 207 | 7 | 51 | 9 | 0 | 7 |
| Ohio | 2,132 | 1855 | 1,418 | 394 | 31 | 6 | 1 | 2 | 3 | 257 | 206 | 2 | 49 | 5 | 1 | 14 |
| Wisconsin | 654 | 534 | 391 | 132 | 4 | 4 | 1 | 2 | 0 | 112 | 84 | 1 | 27 | 2 | 0 | 6 |
| East North Central | 7,565 | 6368 | 4,645 | 1,452 | 158 | 68 | 5 | 9 | 31 | 1,135 | 891 | 25 | 219 | 23 | 1 | 38 |
| Alabama | 449 | 400 | 323 | 77 | 0 | 0 | 0 | 0 | 0 | 48 | 32 | 3 | 13 | 1 | 0 | 0 |
| Kentucky | 493 | 407 | 345 | 55 | 2 | 0 | 1 | 3 | 1 | 80 | 63 | 1 | 16 | 1 | 0 | 5 |
| Mississippi | 179 | 165 | 128 | 37 | 0 | 0 | 0 | 0 | 0 | 13 | 12 | 0 | 1 | 0 | 1 | 0 |
| Tennessee | 547 | 481 | 374 | 105 | 2 | 0 | 0 | 0 | 0 | 63 | 46 | 2 | 15 | 0 | 0 | 3 |
| East South Central | 1,668 | 1453 | 1,170 | 274 | 4 | 0 | 1 | 3 | 1 | 204 | 153 | 6 | 45 | 2 | 1 | 8 |
| New Jersey | 1,476 | 1196 | 909 | 246 | 25 | 11 | 0 | 1 | 4 | 262 | 229 | 7 | 26 | 9 | 0 | 9 |
| New York | 3,743 | 3143 | 2,054 | 955 | 76 | 24 | 3 | 5 | 26 | 561 | 483 | 16 | 62 | 14 | 1 | 24 |
| Pennsylvania | 2,096 | 1735 | 1,374 | 307 | 30 | 20 | 1 | 1 | 2 | 338 | 284 | 7 | 47 | 5 | 3 | 15 |
| Middle Atlantic | 7,315 | 6074 | 4,337 | 1,508 | 131 | 55 | 4 | 7 | 32 | 1161 | 996 | 30 | 135 | 28 | 4 | 48 |
| Arizona | 347 | 311 | 264 | 44 | 3 | 0 | 0 | 0 | 0 | 34 | 29 | 0 | 5 | 1 | 0 | 1 |
| Colorado | 511 | 468 | 386 | 77 | 4 | 0 | 1 | 0 | 0 | 35 | 25 | 0 | 10 | 5 | 0 | 3 |
| Idaho | 79 | 64 | 57 | 7 | 0 | 0 | 0 | 0 | 0 | 9 | 8 | 0 | 1 | 0 | 1 | 5 |
| Montana | 97 | 76 | 66 | 10 | 0 | 0 | 0 | 0 | 0 | 19 | 10 | 1 | 8 | 1 | 0 | 1 |
| New Mexico | 179 | 156 | 136 | 20 | 0 | 0 | 0 | 0 | 0 | 22 | 15 | 0 | 7 | 0 | 0 | 1 |
| Nevada | 503 | 414 | 323 | 81 | 1 | 7 | 0 | 1 | 1 | 85 | 79 | 0 | 6 | 0 | 1 | 3 |
| Utah | 105 | 92 | 77 | 13 | 2 | 0 | 0 | 0 | 0 | 12 | 9 | 0 | 3 | 0 | 0 | 1 |
| Wyoming | 30 | 22 | 18 | 4 | 0 | 0 | 0 | 0 | 0 | 8 | 6 | 0 | 2 | 0 | 0 | 0 |
| Mountain | 1,851 | 1603 | 1,327 | 256 | 10 | 7 | 1 | 1 | 1 | 224 | 181 | 1 | 42 | 7 | 2 | 15 |
| Connecticut | 587 | 502 | 417 | 76 | 5 | 1 | 0 | 2 | 1 | 77 | 58 | 2 | 17 | 2 | 0 | 6 |
| Massachusetts | 913 | 768 | 641 | 107 | 12 | 7 | 0 | 1 | 0 | 132 | 112 | 2 | 18 | 4 | 1 | 8 |
| Maine | 111 | 96 | 79 | 16 | 0 | 1 | 0 | 0 | 0 | 15 | 12 | 0 | 3 | 0 | 0 | 0 |
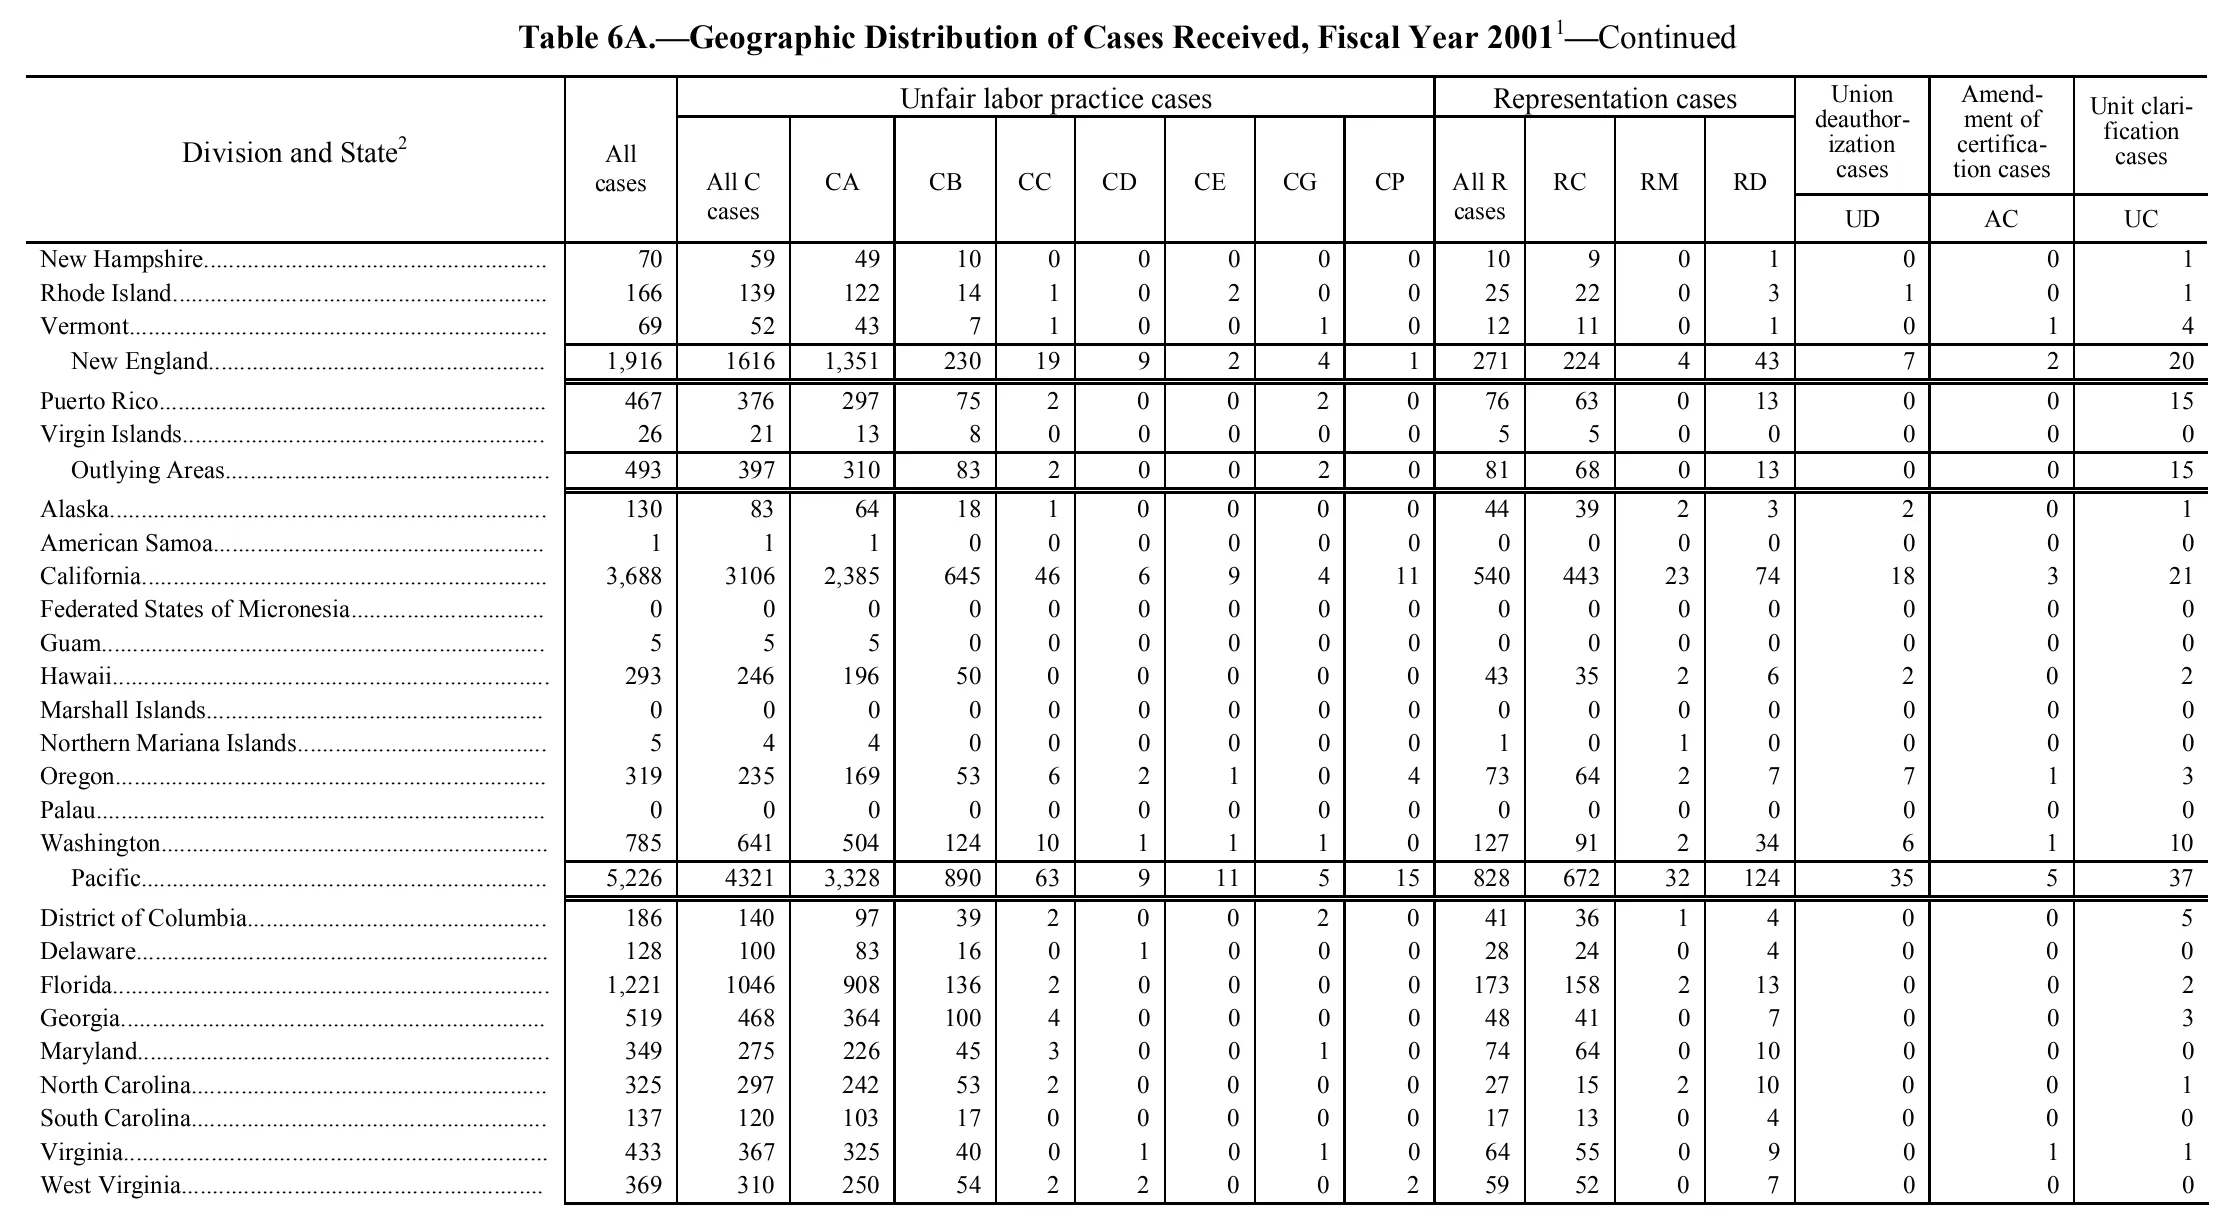
| New Hampshire | 70 | 59 | 49 | 10 | 0 | 0 | 0 | 0 | 0 | 10 | 9 | 0 | 1 | 0 | 0 | 1 |
| Rhode Island | 166 | 139 | 122 | 14 | 1 | 0 | 2 | 0 | 0 | 25 | 22 | 0 | 3 | 1 | 0 | 1 |
| Vermont | 69 | 52 | 43 | 7 | 1 | 0 | 0 | 1 | 0 | 12 | 11 | 0 | 1 | 0 | 1 | 4 |
| New England | 1,916 | 1616 | 1,351 | 230 | 19 | 9 | 2 | 4 | 1 | 271 | 224 | 4 | 43 | 7 | 2 | 20 |
| Puerto Rico | 467 | 376 | 297 | 75 | 2 | 0 | 0 | 2 | 0 | 76 | 63 | 0 | 13 | 0 | 0 | 15 |
| Virgin Islands | 26 | 21 | 13 | 8 | 0 | 0 | 0 | 0 | 0 | 5 | 5 | 0 | 0 | 0 | 0 | 0 |
| Outlying Areas | 493 | 397 | 310 | 83 | 2 | 0 | 0 | 2 | 0 | 81 | 68 | 0 | 13 | 0 | 0 | 15 |
| Alaska | 130 | 83 | 64 | 18 | 1 | 0 | 0 | 0 | 0 | 44 | 39 | 2 | 3 | 2 | 0 | 1 |
| American Samoa | 1 | 1 | 1 | 0 | 0 | 0 | 0 | 0 | 0 | 0 | 0 | 0 | 0 | 0 | 0 | 0 |
| California | 3,688 | 3106 | 2,385 | 645 | 46 | 6 | 9 | 4 | 11 | 540 | 443 | 23 | 74 | 18 | 3 | 21 |
| Federated States of Micronesia | 0 | 0 | 0 | 0 | 0 | 0 | 0 | 0 | 0 | 0 | 0 | 0 | 0 | 0 | 0 | 0 |
| Guam | 5 | 5 | 5 | 0 | 0 | 0 | 0 | 0 | 0 | 0 | 0 | 0 | 0 | 0 | 0 | 0 |
| Hawaii | 293 | 246 | 196 | 50 | 0 | 0 | 0 | 0 | 0 | 43 | 35 | 2 | 6 | 2 | 0 | 2 |
| Marshall Islands | 0 | 0 | 0 | 0 | 0 | 0 | 0 | 0 | 0 | 0 | 0 | 0 | 0 | 0 | 0 | 0 |
| Northern Mariana Islands | 5 | 4 | 4 | 0 | 0 | 0 | 0 | 0 | 0 | 1 | 0 | 1 | 0 | 0 | 0 | 0 |
| Oregon | 319 | 235 | 169 | 53 | 6 | 2 | 1 | 0 | 4 | 73 | 64 | 2 | 7 | 7 | 1 | 3 |
| Palau | 0 | 0 | 0 | 0 | 0 | 0 | 0 | 0 | 0 | 0 | 0 | 0 | 0 | 0 | 0 | 0 |
| Washington | 785 | 641 | 504 | 124 | 10 | 1 | 1 | 1 | 0 | 127 | 91 | 2 | 34 | 6 | 1 | 10 |
| Pacific | 5,226 | 4321 | 3,328 | 890 | 63 | 9 | 11 | 5 | 15 | 828 | 672 | 32 | 124 | 35 | 5 | 37 |
| District of Columbia | 186 | 140 | 97 | 39 | 2 | 0 | 0 | 2 | 0 | 41 | 36 | 1 | 4 | 0 | 0 | 5 |
| Delaware | 128 | 100 | 83 | 16 | 0 | 1 | 0 | 0 | 0 | 28 | 24 | 0 | 4 | 0 | 0 | 0 |
| Florida | 1,221 | 1046 | 908 | 136 | 2 | 0 | 0 | 0 | 0 | 173 | 158 | 2 | 13 | 0 | 0 | 2 |
| Georgia | 519 | 468 | 364 | 100 | 4 | 0 | 0 | 0 | 0 | 48 | 41 | 0 | 7 | 0 | 0 | 3 |
| Maryland | 349 | 275 | 226 | 45 | 3 | 0 | 0 | 1 | 0 | 74 | 64 | 0 | 10 | 0 | 0 | 0 |
| North Carolina | 325 | 297 | 242 | 53 | 2 | 0 | 0 | 0 | 0 | 27 | 15 | 2 | 10 | 0 | 0 | 1 |
| South Carolina | 137 | 120 | 103 | 17 | 0 | 0 | 0 | 0 | 0 | 17 | 13 | 0 | 4 | 0 | 0 | 0 |
| Virginia | 433 | 367 | 325 | 40 | 0 | 1 | 0 | 1 | 0 | 64 | 55 | 0 | 9 | 0 | 1 | 1 |
| West Virginia | 369 | 310 | 250 | 54 | 2 | 2 | 0 | 0 | 2 | 59 | 52 | 0 | 7 | 0 | 0 | 0 |
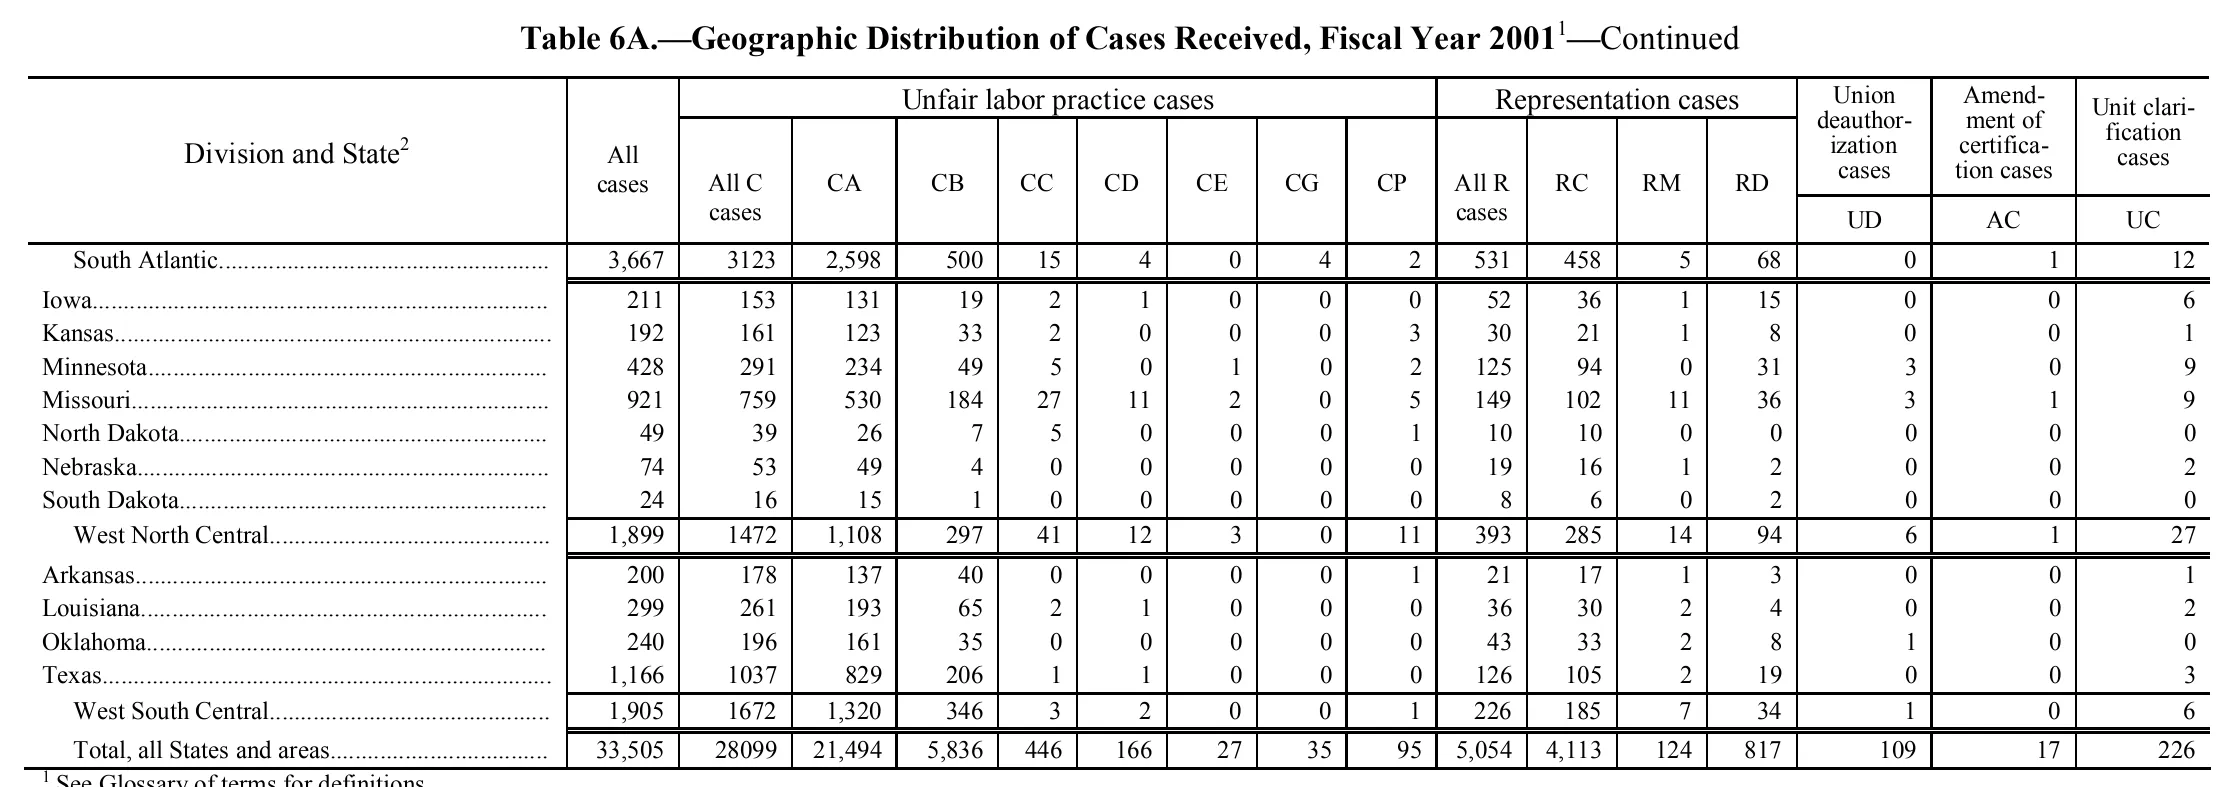
| South Atlantic | 3,667 | 3123 | 2,598 | 500 | 15 | 4 | 0 | 4 | 2 | 531 | 458 | 5 | 68 | 0 | 1 | 12 |
| Iowa | 211 | 153 | 131 | 19 | 2 | 1 | 0 | 0 | 0 | 52 | 36 | 1 | 15 | 0 | 0 | 6 |
| Kansas | 192 | 161 | 123 | 33 | 2 | 0 | 0 | 0 | 3 | 30 | 21 | 1 | 8 | 0 | 0 | 1 |
| Minnesota | 428 | 291 | 234 | 49 | 5 | 0 | 1 | 0 | 2 | 125 | 94 | 0 | 31 | 3 | 0 | 9 |
| Missouri | 921 | 759 | 530 | 184 | 27 | 11 | 2 | 0 | 5 | 149 | 102 | 11 | 36 | 3 | 1 | 9 |
| North Dakota | 49 | 39 | 26 | 7 | 5 | 0 | 0 | 0 | 1 | 10 | 10 | 0 | 0 | 0 | 0 | 0 |
| Nebraska | 74 | 53 | 49 | 4 | 0 | 0 | 0 | 0 | 0 | 19 | 16 | 1 | 2 | 0 | 0 | 2 |
| South Dakota | 24 | 16 | 15 | 1 | 0 | 0 | 0 | 0 | 0 | 8 | 6 | 0 | 2 | 0 | 0 | 0 |
| West North Central | 1,899 | 1472 | 1,108 | 297 | 41 | 12 | 3 | 0 | 11 | 393 | 285 | 14 | 94 | 6 | 1 | 27 |
| Arkansas | 200 | 178 | 137 | 40 | 0 | 0 | 0 | 0 | 1 | 21 | 17 | 1 | 3 | 0 | 0 | 1 |
| Louisiana | 299 | 261 | 193 | 65 | 2 | 1 | 0 | 0 | 0 | 36 | 30 | 2 | 4 | 0 | 0 | 2 |
| Oklahoma | 240 | 196 | 161 | 35 | 0 | 0 | 0 | 0 | 0 | 43 | 33 | 2 | 8 | 1 | 0 | 0 |
| Texas | 1,166 | 1037 | 829 | 206 | 1 | 1 | 0 | 0 | 0 | 126 | 105 | 2 | 19 | 0 | 0 | 3 |
| West South Central | 1,905 | 1672 | 1,320 | 346 | 3 | 2 | 0 | 0 | 1 | 226 | 185 | 7 | 34 | 1 | 0 | 6 |
| Total, all States and areas | 33,505 | 28099 | 21,494 | 5,836 | 446 | 166 | 27 | 35 | 95 | 5,054 | 4,113 | 124 | 817 | 109 | 17 | 226 |
- 1 See Glossary of terms for definitions.
758 of 758 figures sit in a row or column sum that works out.
Reader’s notes
p. 149. The crop is cut off at the bottom: the table continues past the "Maine" row (the New England division subtotal and the remaining divisions are not on this image), and no footnote texts are printed in the crop even though markers 1 (on the caption) and 2 (on the stub heading "Division and State") are present; marker 2 is retained on the stub heading, the caption marker is omitted with the caption. Column structure: 17 columns — stub, "All cases", eight unfair-labor-practice columns (All C cases, CA, CB, CC, CD, CE, CG, CP), four representation columns (All R cases, RC, RM, RD), then UD, AC and UC. The three right-hand headings ("Union deauthorization cases", "Amendment of certification cases", "Unit clarification cases") span the top two heading levels with their code (UD/AC/UC) on the third level; "Division and State" and "All cases" likewise span levels, so they are repeated per the convention. Typesetting inconsistency, transcribed as printed: the "All C cases" column carries no digit-grouping commas anywhere (1616, 1544, 1855, 6368, 3143, 1735, 6074, 1453, 1603), unlike the neighbouring columns. In the "All R cases" column the East North Central subtotal prints as "1,135" with a comma while the Middle Atlantic subtotal prints as "1161" without one. Arithmetic cross-checks: every state row and every division subtotal reconciles both across the detail columns and down the column, which supports the digit and column assignments. For example Illinois 1,066+378+98+46+1+3+24 = 1616 and 1616+374+5+0+9 = 2,004; Idaho's unusually large UC value of 5 is confirmed by 64+9+0+1+5 = 79. No printed total appears to be in error. Division subtotal rows (East North Central, East South Central, Middle Atlantic, Mountain) are printed indented under their member states and set off by rules; the indentation is not reproduced in the labels.
p. 150. 17 columns: stub, "All cases", eight unfair-labor-practice columns (All C cases, CA, CB, CC, CD, CE, CG, CP), four representation columns (All R cases, RC, RM, RD), and UD, AC, UC. The three right-hand headings ("Union deauthorization cases", "Amendment of certification cases", "Unit clarification cases") are tall headings spanning the top two heading levels, with UD/AC/UC printed below a rule on the third level; the stub heading and the "All cases"/"All C cases"/... column headings are repeated down the levels they span. This crop is a continuation page ("—Continued" in the caption): the New England division begins on the preceding page, so only New Hampshire, Rhode Island and Vermont appear above the indented "New England" subtotal row, which covers the whole division. Likewise the body is cut off after West Virginia — the South Atlantic division's remaining states and its subtotal are on the following page. The three indented rows "New England", "Outlying Areas" and "Pacific" are division subtotal rows (they are set off by heavy rules in the image) and are transcribed with their values as printed. In the "All C cases" column, four-digit values are printed without digit-grouping commas (1616, 3106, 4321, 1046) while the same magnitudes in "All cases" and "CA" carry commas (1,916; 3,688; 5,226; 1,221; 1,351; 2,385; 3,328). Transcribed exactly as printed, without adding commas. No footnote text is printed beneath the table on this crop; the markers 1 (caption, excluded) and 2 (stub heading "Division and State") refer to notes printed elsewhere. All printed row totals and division subtotals in this crop are internally consistent when checked against their component columns.
p. 151. Crop is a continuation page of Table 6A (the caption carries \"—Continued\"), so it opens mid-table with the \"South Atlantic\" division total; the South Atlantic member states and all earlier divisions are on previous pages. Column headings are printed on this page, so they are transcribed. The table has 17 columns: stub, \"All cases\", eight columns under \"Unfair labor practice cases\" (All C cases, CA, CB, CC, CD, CE, CG, CP), four under \"Representation cases\" (All R cases, RC, RM, RD), then the three tall single-column headings whose code letters UD, AC and UC occupy the third heading level. Typography note, not an error: the \"All C cases\" column is set without digit-grouping commas throughout (3123, 1472, 1672, 28099) while every other column uses them (3,667; 1,108; 21,494). Transcribed exactly as printed. Footnote 1 is clipped by the bottom edge of the crop — the marker and the words \"See Glossary of terms for definitions.\" are legible but the baseline is cut, and any further footnotes below it (including the text of footnote 2, whose marker appears on the stub heading \"Division and State\") are not visible in this image. All arithmetic was checked and is internally consistent: both division subtotals equal the sum of their member states in every column, \"All C cases\" equals CA+CB+CC+CD+CE+CG+CP, \"All R cases\" equals RC+RM+RD, and \"All cases\" equals All C + All R + UD + AC + UC in the South Atlantic, both subtotal and total rows. No doubtful or illegible cells.
Source image
Source data: U.S. NLRB Annual Reports (public domain). Reconstruction by NLRB Stats Archive. Read by claude-opus-5 (effort max, prompt extract_v1) from the 300-dpi scan; stitched by page. Updated October 2026.