NLRB Stats Archive › Annual Reports › FY2000 › Proceedings Decided by Circuit Courts of Appeals on Petitions for Enforcement and/or Review of Board Orders, Fiscal Year 2000, Compared With 5-Year Cumulative Totals, 1995 Through 1999
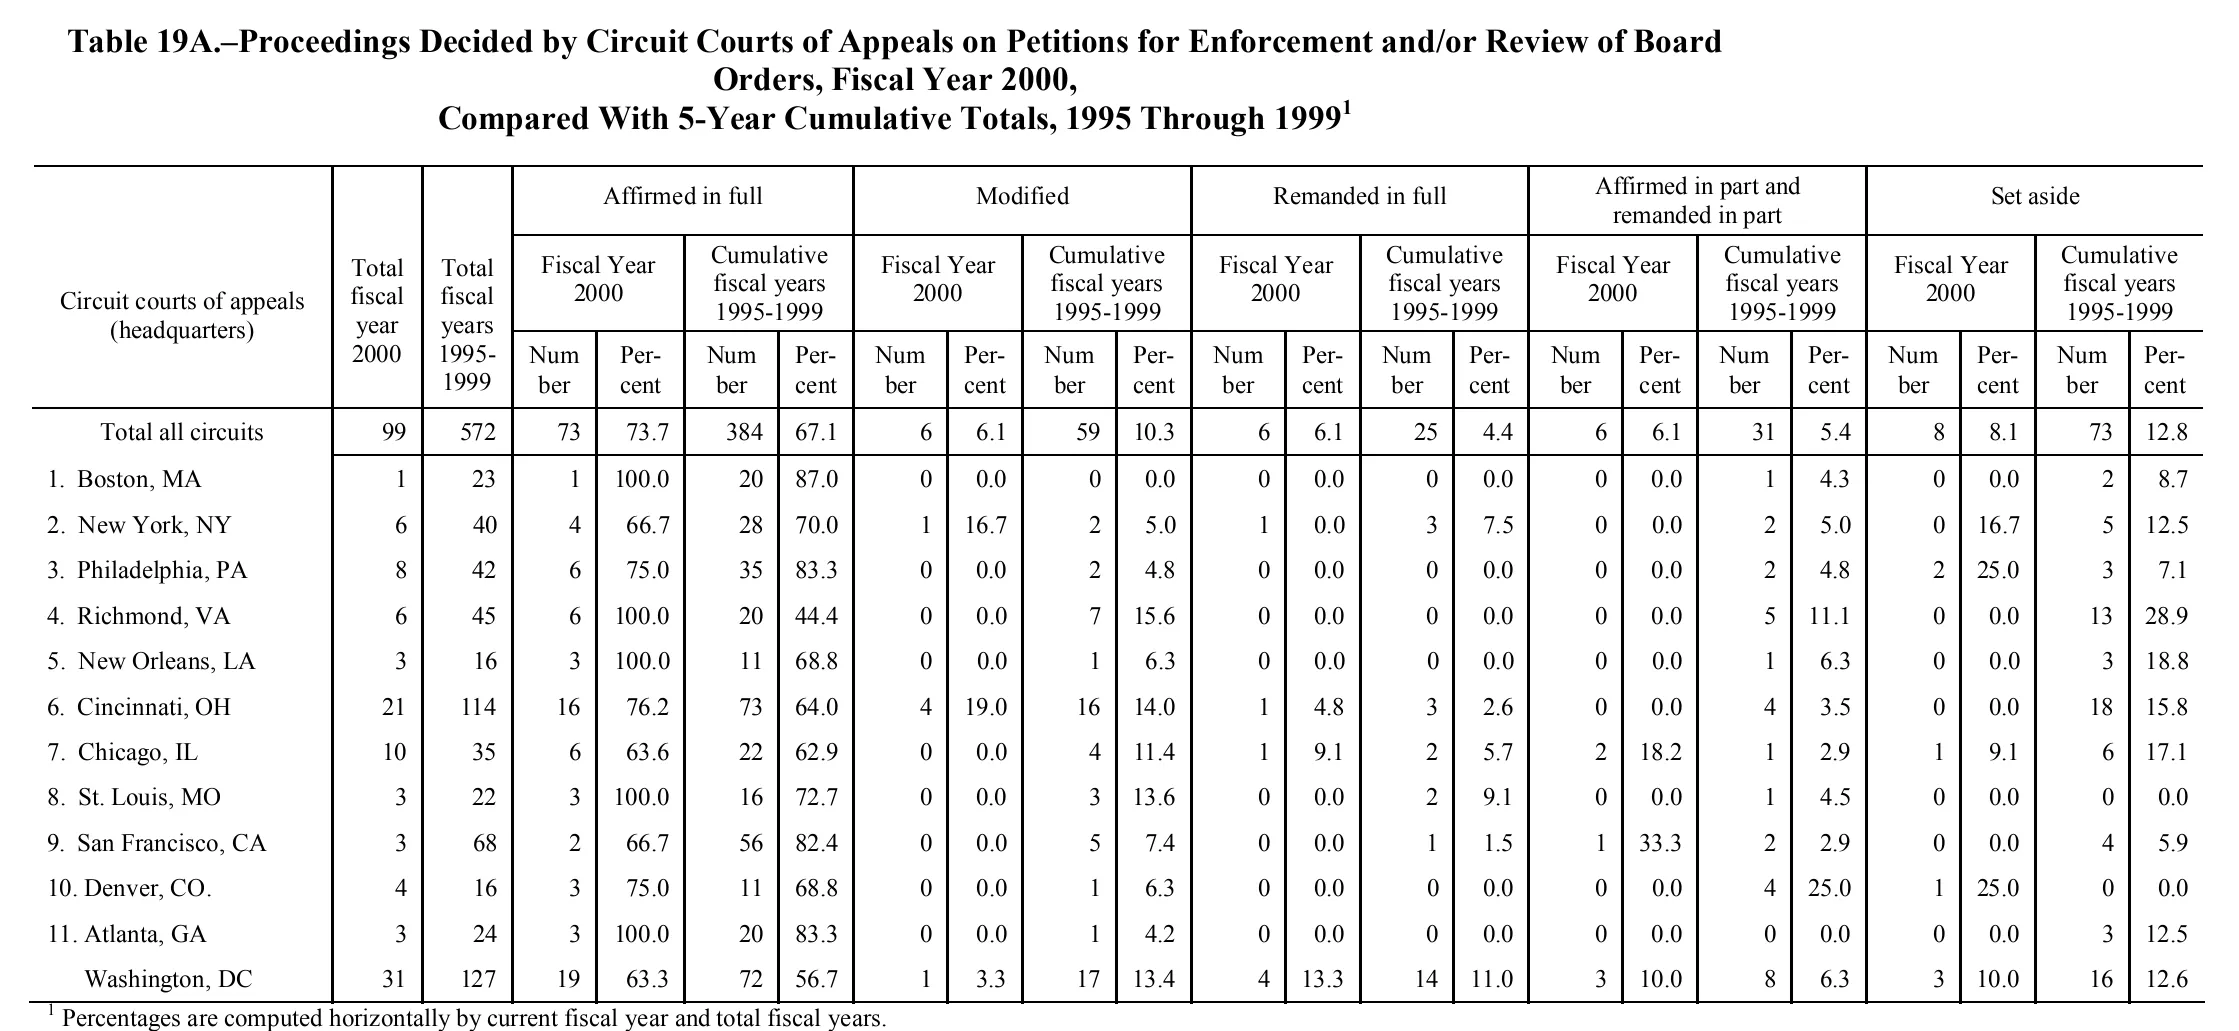
Proceedings Decided by Circuit Courts of Appeals on Petitions for Enforcement and/or Review of Board Orders, Fiscal Year 2000, Compared With 5-Year Cumulative Totals, 1995 Through 1999
| Circuit courts of appeals (headquarters) | Total fiscal year 2000 | Total fiscal years 1995-1999 | Affirmed in full | Modified | Remanded in full | Affirmed in part and remanded in part | Set aside | |||||||||||||||
|---|---|---|---|---|---|---|---|---|---|---|---|---|---|---|---|---|---|---|---|---|---|---|
| Circuit courts of appeals (headquarters) | Total fiscal year 2000 | Total fiscal years 1995-1999 | Fiscal Year 2000 | Cumulative fiscal years 1995-1999 | Fiscal Year 2000 | Cumulative fiscal years 1995-1999 | Fiscal Year 2000 | Cumulative fiscal years 1995-1999 | Fiscal Year 2000 | Cumulative fiscal years 1995-1999 | Fiscal Year 2000 | Cumulative fiscal years 1995-1999 | ||||||||||
| Circuit courts of appeals (headquarters) | Total fiscal year 2000 | Total fiscal years 1995-1999 | Number | Percent | Number | Percent | Number | Percent | Number | Percent | Number | Percent | Number | Percent | Number | Percent | Number | Percent | Number | Percent | Number | Percent |
| Total all circuits | 99 | 572 | 73 | 73.7 | 384 | 67.1 | 6 | 6.1 | 59 | 10.3 | 6 | 6.1 | 25 | 4.4 | 6 | 6.1 | 31 | 5.4 | 8 | 8.1 | 73 | 12.8 |
| 1. Boston, MA | 1 | 23 | 1 | 100.0 | 20 | 87.0 | 0 | 0.0 | 0 | 0.0 | 0 | 0.0 | 0 | 0.0 | 0 | 0.0 | 1 | 4.3 | 0 | 0.0 | 2 | 8.7 |
| 2. New York, NY | 6 | 40 | 4 | 66.7 | 28 | 70.0 | 1 | 16.7 | 2 | 5.0 | 1 | 0.0 | 3 | 7.5 | 0 | 0.0 | 2 | 5.0 | 0 | 16.7 | 5 | 12.5 |
| 3. Philadelphia, PA | 8 | 42 | 6 | 75.0 | 35 | 83.3 | 0 | 0.0 | 2 | 4.8 | 0 | 0.0 | 0 | 0.0 | 0 | 0.0 | 2 | 4.8 | 2 | 25.0 | 3 | 7.1 |
| 4. Richmond, VA | 6 | 45 | 6 | 100.0 | 20 | 44.4 | 0 | 0.0 | 7 | 15.6 | 0 | 0.0 | 0 | 0.0 | 0 | 0.0 | 5 | 11.1 | 0 | 0.0 | 13 | 28.9 |
| 5. New Orleans, LA | 3 | 16 | 3 | 100.0 | 11 | 68.8 | 0 | 0.0 | 1 | 6.3 | 0 | 0.0 | 0 | 0.0 | 0 | 0.0 | 1 | 6.3 | 0 | 0.0 | 3 | 18.8 |
| 6. Cincinnati, OH | 21 | 114 | 16 | 76.2 | 73 | 64.0 | 4 | 19.0 | 16 | 14.0 | 1 | 4.8 | 3 | 2.6 | 0 | 0.0 | 4 | 3.5 | 0 | 0.0 | 18 | 15.8 |
| 7. Chicago, IL | 10 | 35 | 6 | 63.6 | 22 | 62.9 | 0 | 0.0 | 4 | 11.4 | 1 | 9.1 | 2 | 5.7 | 2 | 18.2 | 1 | 2.9 | 1 | 9.1 | 6 | 17.1 |
| 8. St. Louis, MO | 3 | 22 | 3 | 100.0 | 16 | 72.7 | 0 | 0.0 | 3 | 13.6 | 0 | 0.0 | 2 | 9.1 | 0 | 0.0 | 1 | 4.5 | 0 | 0.0 | 0 | 0.0 |
| 9. San Francisco, CA | 3 | 68 | 2 | 66.7 | 56 | 82.4 | 0 | 0.0 | 5 | 7.4 | 0 | 0.0 | 1 | 1.5 | 1 | 33.3 | 2 | 2.9 | 0 | 0.0 | 4 | 5.9 |
| 10. Denver, CO. | 4 | 16 | 3 | 75.0 | 11 | 68.8 | 0 | 0.0 | 1 | 6.3 | 0 | 0.0 | 0 | 0.0 | 0 | 0.0 | 4 | 25.0 | 1 | 25.0 | 0 | 0.0 |
| 11. Atlanta, GA | 3 | 24 | 3 | 100.0 | 20 | 83.3 | 0 | 0.0 | 1 | 4.2 | 0 | 0.0 | 0 | 0.0 | 0 | 0.0 | 0 | 0.0 | 0 | 0.0 | 3 | 12.5 |
| Washington, DC | 31 | 127 | 19 | 63.3 | 72 | 56.7 | 1 | 3.3 | 17 | 13.4 | 4 | 13.3 | 14 | 11.0 | 3 | 10.0 | 8 | 6.3 | 3 | 10.0 | 16 | 12.6 |
- 1 Percentages are computed horizontally by current fiscal year and total fiscal years.
89 of 112 figures sit in a row or column sum that works out. 3 cells break a sum: 'Total all circuits', column 4: prints 73, rows '1. Boston, MA' to 'Washington, DC' add to 72; 'Total all circuits', column 12: prints 6, rows '1. Boston, MA' to 'Washington, DC' add to 7; 'Total all circuits', column 20: prints 8, rows '1. Boston, MA' to 'Washington, DC' add to 7.
Reader’s notes
p. 187. 23 columns: stub, two tall "Total" columns, then five 4-column blocks (Affirmed in full, Modified, Remanded in full, Affirmed in part and remanded in part, Set aside), each split into Fiscal Year 2000 (Number, Percent) and Cumulative fiscal years 1995-1999 (Number, Percent). The caption carries footnote marker 1 but is excluded per instructions. Suspected misprints, all transcribed exactly as printed: (a) Row "2. New York, NY": the Remanded in full / Fiscal Year 2000 pair reads 1 and 0.0, while the Set aside / Fiscal Year 2000 pair reads 0 and 16.7 — the two percents appear interchanged, or the numbers are. (With Remanded = 0 / 0.0 and Set aside = 1 / 16.7 the row would sum to its total of 6 and all column totals would check out.) The glyphs in those four cells are legible and I am confident of the characters and of the column each sits in. (b) Row "7. Chicago, IL": percents imply a denominator of 11, but the printed Total fiscal year 2000 is 10; the FY2000 numbers (6+0+1+2+1) sum to 10, matching the printed total, while 63.6 percent would require an Affirmed in full number of 7. The digit is read as 6. (c) Row "Washington, DC": percents imply a denominator of 30, but the printed Total fiscal year 2000 is 31; the FY2000 numbers sum to 30. Column arithmetic verified against the printed "Total all circuits" row: both Total columns and all five Cumulative Number columns sum exactly (99, 572, 384, 59, 25, 31, 73), as do the FY2000 Modified (6) and Affirmed in part (6) columns. The FY2000 Affirmed in full column sums to 72 against a printed 73, Remanded in full to 7 against 6, and Set aside to 7 against 8 — discrepancies traceable to (a) and (b) above. "10. Denver, CO." is printed with a trailing period after CO; the final row is printed as "Washington, DC" with no circuit number and is indented under the numbered circuits.
Source image
Source data: U.S. NLRB Annual Reports (public domain). Reconstruction by NLRB Stats Archive. Read by claude-opus-5 (effort max, prompt extract_v1) from the 300-dpi scan; stitched by page. Updated October 2026.