NLRB Stats Archive › Annual Reports › FY1999 › Size of Units in Representation Elections in Cases Closed, Fiscal Year 1999
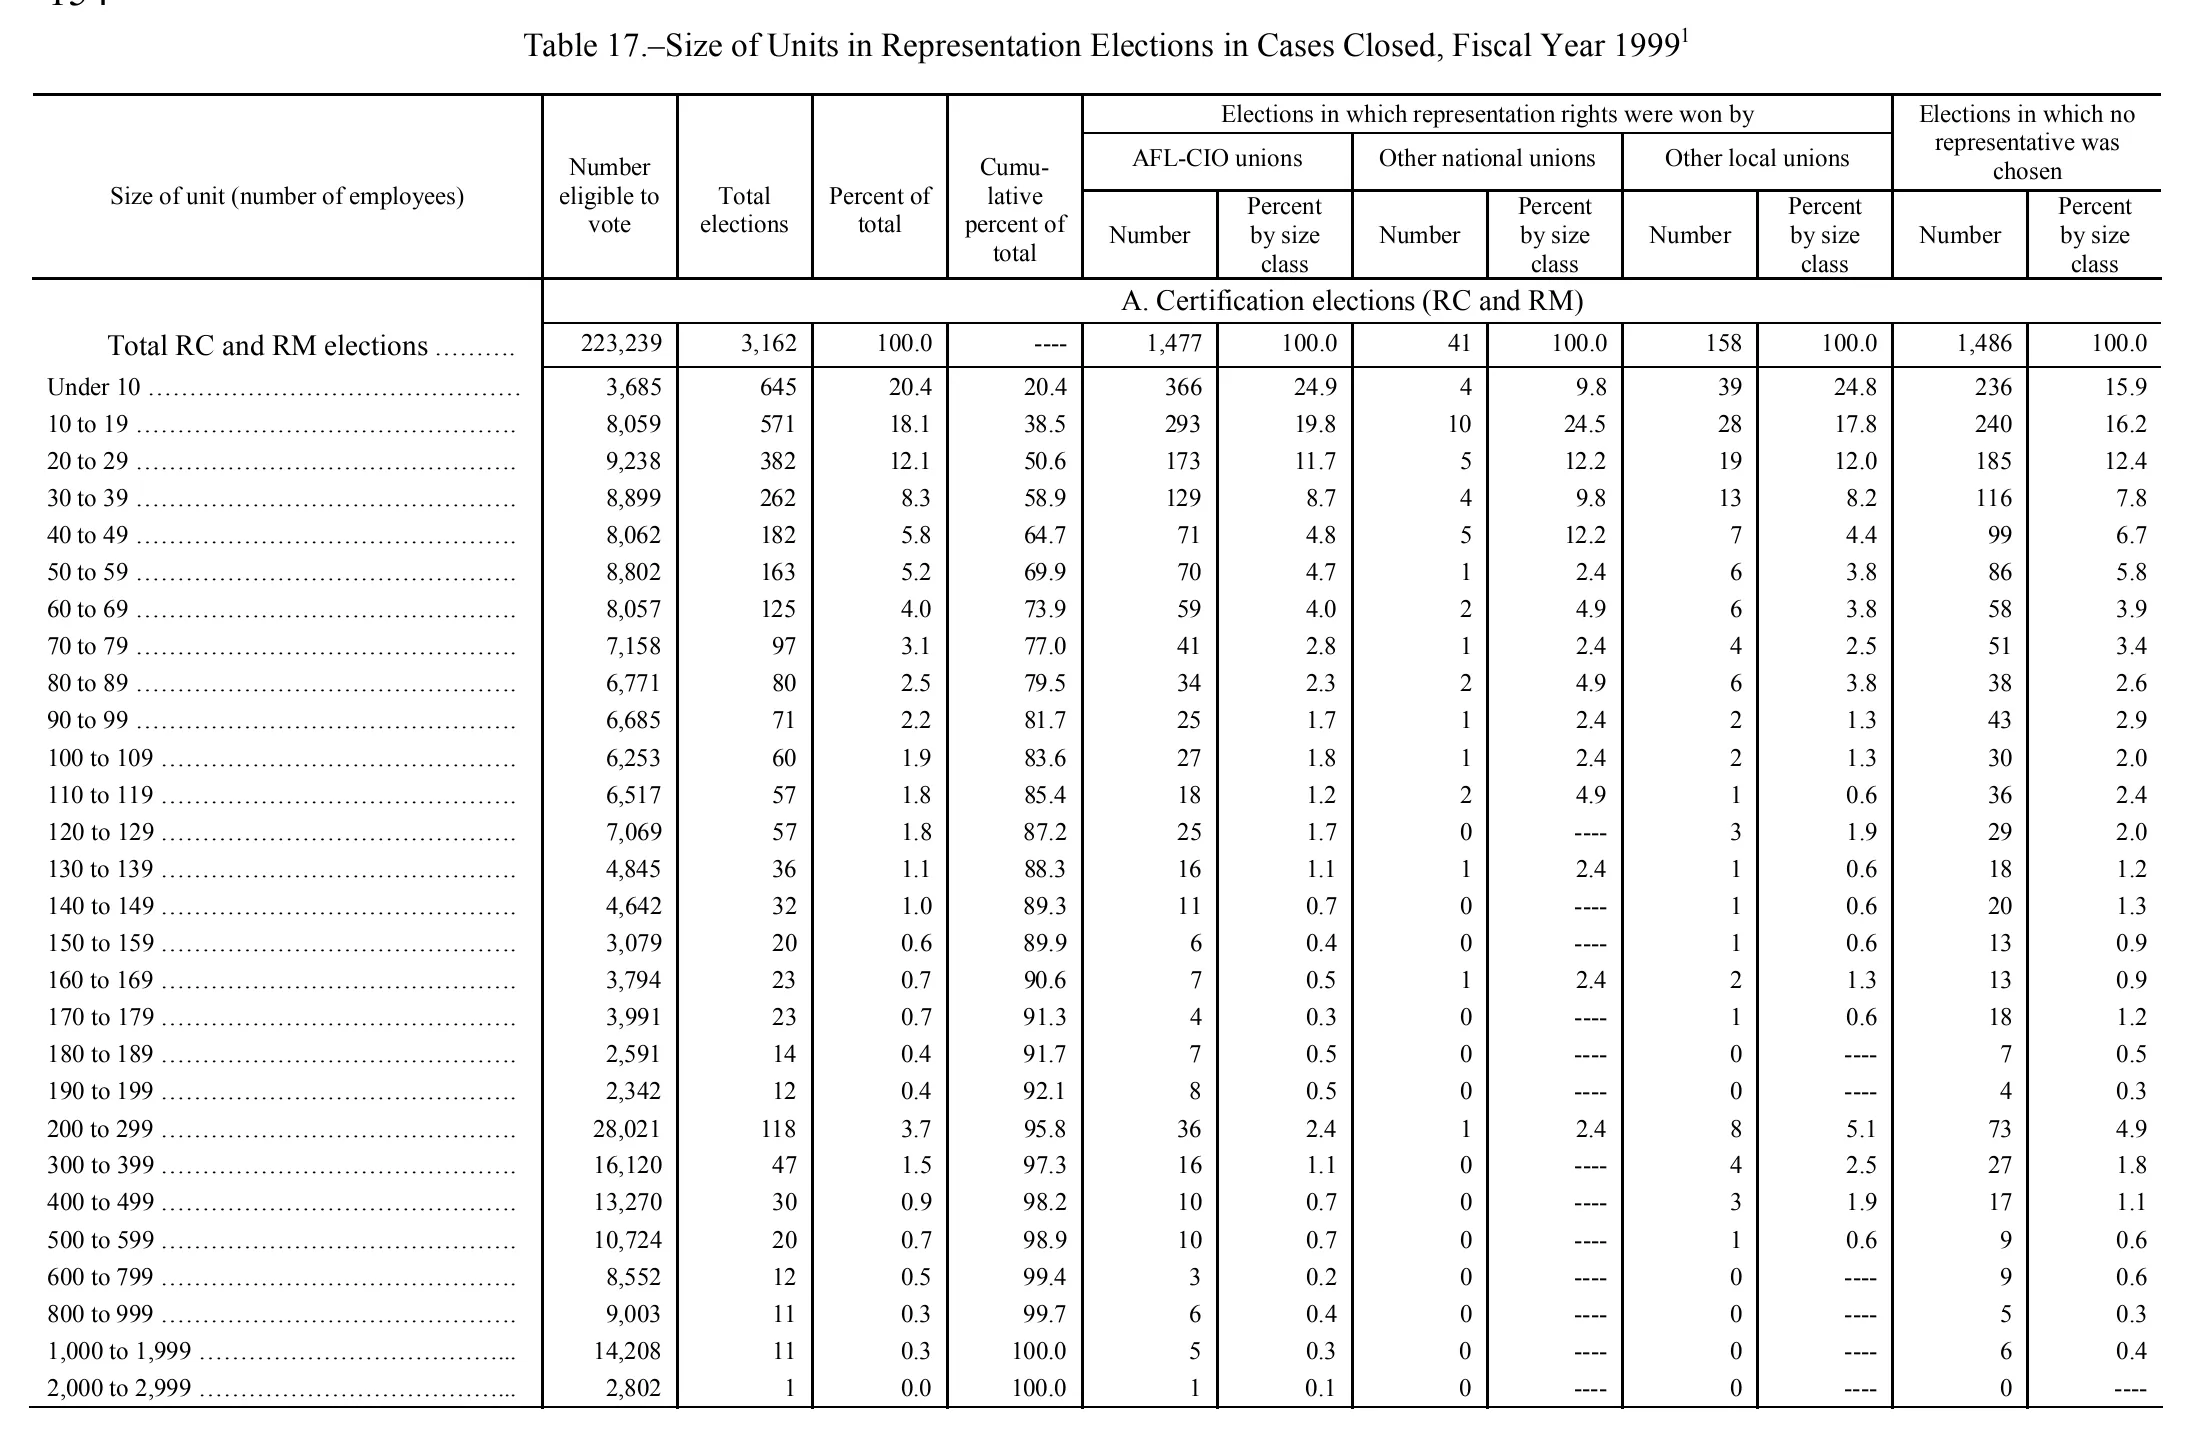
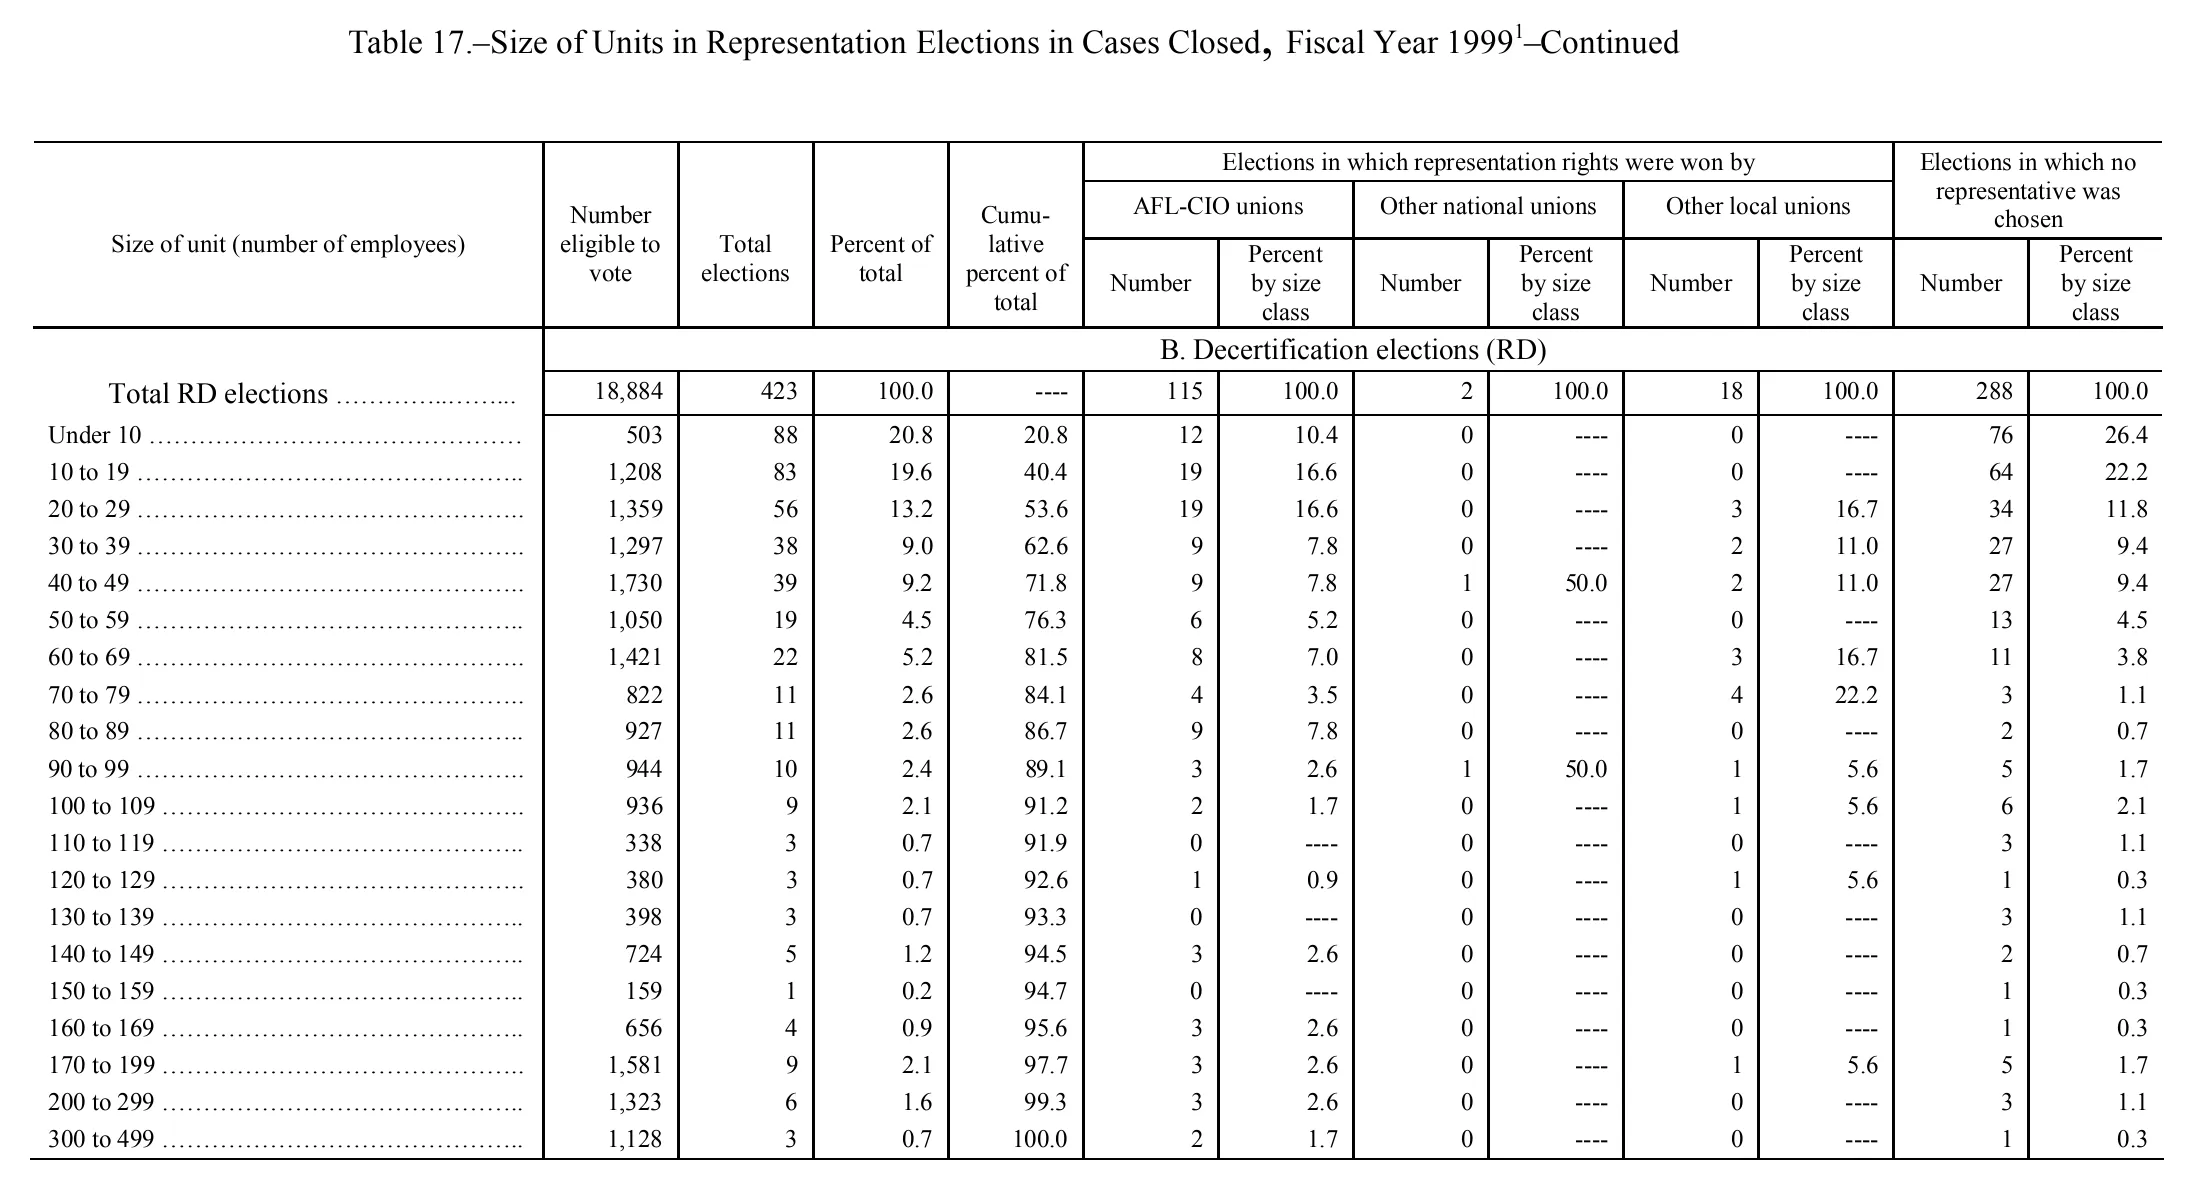
Size of Units in Representation Elections in Cases Closed, Fiscal Year 1999
Stitched from pp. 163–164.
| Size of unit (number of employees) | Number eligible to vote | Total elections | Percent of total | Cumulative percent of total | Elections in which representation rights were won by | Elections in which no representative was chosen | ||||||
|---|---|---|---|---|---|---|---|---|---|---|---|---|
| Size of unit (number of employees) | Number eligible to vote | Total elections | Percent of total | Cumulative percent of total | AFL-CIO unions | Other national unions | Other local unions | Elections in which no representative was chosen | ||||
| Size of unit (number of employees) | Number eligible to vote | Total elections | Percent of total | Cumulative percent of total | Number | Percent by size class | Number | Percent by size class | Number | Percent by size class | Number | Percent by size class |
| A. Certification elections (RC and RM) | ||||||||||||
| Total RC and RM elections | 223,239 | 3,162 | 100.0 | 1,477 | 100.0 | 41 | 100.0 | 158 | 100.0 | 1,486 | 100.0 | |
| Under 10 | 3,685 | 645 | 20.4 | 20.4 | 366 | 24.9 | 4 | 9.8 | 39 | 24.8 | 236 | 15.9 |
| 10 to 19 | 8,059 | 571 | 18.1 | 38.5 | 293 | 19.8 | 10 | 24.5 | 28 | 17.8 | 240 | 16.2 |
| 20 to 29 | 9,238 | 382 | 12.1 | 50.6 | 173 | 11.7 | 5 | 12.2 | 19 | 12.0 | 185 | 12.4 |
| 30 to 39 | 8,899 | 262 | 8.3 | 58.9 | 129 | 8.7 | 4 | 9.8 | 13 | 8.2 | 116 | 7.8 |
| 40 to 49 | 8,062 | 182 | 5.8 | 64.7 | 71 | 4.8 | 5 | 12.2 | 7 | 4.4 | 99 | 6.7 |
| 50 to 59 | 8,802 | 163 | 5.2 | 69.9 | 70 | 4.7 | 1 | 2.4 | 6 | 3.8 | 86 | 5.8 |
| 60 to 69 | 8,057 | 125 | 4.0 | 73.9 | 59 | 4.0 | 2 | 4.9 | 6 | 3.8 | 58 | 3.9 |
| 70 to 79 | 7,158 | 97 | 3.1 | 77.0 | 41 | 2.8 | 1 | 2.4 | 4 | 2.5 | 51 | 3.4 |
| 80 to 89 | 6,771 | 80 | 2.5 | 79.5 | 34 | 2.3 | 2 | 4.9 | 6 | 3.8 | 38 | 2.6 |
| 90 to 99 | 6,685 | 71 | 2.2 | 81.7 | 25 | 1.7 | 1 | 2.4 | 2 | 1.3 | 43 | 2.9 |
| 100 to 109 | 6,253 | 60 | 1.9 | 83.6 | 27 | 1.8 | 1 | 2.4 | 2 | 1.3 | 30 | 2.0 |
| 110 to 119 | 6,517 | 57 | 1.8 | 85.4 | 18 | 1.2 | 2 | 4.9 | 1 | 0.6 | 36 | 2.4 |
| 120 to 129 | 7,069 | 57 | 1.8 | 87.2 | 25 | 1.7 | 0 | 3 | 1.9 | 29 | 2.0 | |
| 130 to 139 | 4,845 | 36 | 1.1 | 88.3 | 16 | 1.1 | 1 | 2.4 | 1 | 0.6 | 18 | 1.2 |
| 140 to 149 | 4,642 | 32 | 1.0 | 89.3 | 11 | 0.7 | 0 | 1 | 0.6 | 20 | 1.3 | |
| 150 to 159 | 3,079 | 20 | 0.6 | 89.9 | 6 | 0.4 | 0 | 1 | 0.6 | 13 | 0.9 | |
| 160 to 169 | 3,794 | 23 | 0.7 | 90.6 | 7 | 0.5 | 1 | 2.4 | 2 | 1.3 | 13 | 0.9 |
| 170 to 179 | 3,991 | 23 | 0.7 | 91.3 | 4 | 0.3 | 0 | 1 | 0.6 | 18 | 1.2 | |
| 180 to 189 | 2,591 | 14 | 0.4 | 91.7 | 7 | 0.5 | 0 | 0 | 7 | 0.5 | ||
| 190 to 199 | 2,342 | 12 | 0.4 | 92.1 | 8 | 0.5 | 0 | 0 | 4 | 0.3 | ||
| 200 to 299 | 28,021 | 118 | 3.7 | 95.8 | 36 | 2.4 | 1 | 2.4 | 8 | 5.1 | 73 | 4.9 |
| 300 to 399 | 16,120 | 47 | 1.5 | 97.3 | 16 | 1.1 | 0 | 4 | 2.5 | 27 | 1.8 | |
| 400 to 499 | 13,270 | 30 | 0.9 | 98.2 | 10 | 0.7 | 0 | 3 | 1.9 | 17 | 1.1 | |
| 500 to 599 | 10,724 | 20 | 0.7 | 98.9 | 10 | 0.7 | 0 | 1 | 0.6 | 9 | 0.6 | |
| 600 to 799 | 8,552 | 12 | 0.5 | 99.4 | 3 | 0.2 | 0 | 0 | 9 | 0.6 | ||
| 800 to 999 | 9,003 | 11 | 0.3 | 99.7 | 6 | 0.4 | 0 | 0 | 5 | 0.3 | ||
| 1,000 to 1,999 | 14,208 | 11 | 0.3 | 100.0 | 5 | 0.3 | 0 | 0 | 6 | 0.4 | ||
| 2,000 to 2,999 | 2,802 | 1 | 0.0 | 100.0 | 1 | 0.1 | 0 | 0 | 0 | |||
| B. Decertification elections (RD) | ||||||||||||
| Total RD elections | 18,884 | 423 | 100.0 | 115 | 100.0 | 2 | 100.0 | 18 | 100.0 | 288 | 100.0 | |
| Under 10 | 503 | 88 | 20.8 | 20.8 | 12 | 10.4 | 0 | 0 | 76 | 26.4 | ||
| 10 to 19 | 1,208 | 83 | 19.6 | 40.4 | 19 | 16.6 | 0 | 0 | 64 | 22.2 | ||
| 20 to 29 | 1,359 | 56 | 13.2 | 53.6 | 19 | 16.6 | 0 | 3 | 16.7 | 34 | 11.8 | |
| 30 to 39 | 1,297 | 38 | 9.0 | 62.6 | 9 | 7.8 | 0 | 2 | 11.0 | 27 | 9.4 | |
| 40 to 49 | 1,730 | 39 | 9.2 | 71.8 | 9 | 7.8 | 1 | 50.0 | 2 | 11.0 | 27 | 9.4 |
| 50 to 59 | 1,050 | 19 | 4.5 | 76.3 | 6 | 5.2 | 0 | 0 | 13 | 4.5 | ||
| 60 to 69 | 1,421 | 22 | 5.2 | 81.5 | 8 | 7.0 | 0 | 3 | 16.7 | 11 | 3.8 | |
| 70 to 79 | 822 | 11 | 2.6 | 84.1 | 4 | 3.5 | 0 | 4 | 22.2 | 3 | 1.1 | |
| 80 to 89 | 927 | 11 | 2.6 | 86.7 | 9 | 7.8 | 0 | 0 | 2 | 0.7 | ||
| 90 to 99 | 944 | 10 | 2.4 | 89.1 | 3 | 2.6 | 1 | 50.0 | 1 | 5.6 | 5 | 1.7 |
| 100 to 109 | 936 | 9 | 2.1 | 91.2 | 2 | 1.7 | 0 | 1 | 5.6 | 6 | 2.1 | |
| 110 to 119 | 338 | 3 | 0.7 | 91.9 | 0 | 0 | 0 | 3 | 1.1 | |||
| 120 to 129 | 380 | 3 | 0.7 | 92.6 | 1 | 0.9 | 0 | 1 | 5.6 | 1 | 0.3 | |
| 130 to 139 | 398 | 3 | 0.7 | 93.3 | 0 | 0 | 0 | 3 | 1.1 | |||
| 140 to 149 | 724 | 5 | 1.2 | 94.5 | 3 | 2.6 | 0 | 0 | 2 | 0.7 | ||
| 150 to 159 | 159 | 1 | 0.2 | 94.7 | 0 | 0 | 0 | 1 | 0.3 | |||
| 160 to 169 | 656 | 4 | 0.9 | 95.6 | 3 | 2.6 | 0 | 0 | 1 | 0.3 | ||
| 170 to 199 | 1,581 | 9 | 2.1 | 97.7 | 3 | 2.6 | 0 | 1 | 5.6 | 5 | 1.7 | |
| 200 to 299 | 1,323 | 6 | 1.6 | 99.3 | 3 | 2.6 | 0 | 0 | 3 | 1.1 | ||
| 300 to 499 | 1,128 | 3 | 0.7 | 100.0 | 2 | 1.7 | 0 | 0 | 1 | 0.3 | ||
248 of 248 figures sit in a row or column sum that works out.
Reader’s notes
p. 163. The crop is cut off at the bottom: it ends with the "2,000 to 2,999" row of panel A and shows no closing rule, no section B (decertification elections), and no printed footnotes, even though the caption carries a superscript 1 footnote marker. The footnote text itself is therefore not on this image and `footnotes` is empty. Thirteen columns: stub, "Number eligible to vote", "Total elections", "Percent of total", "Cumulative percent of total", then Number/Percent-by-size-class pairs for AFL-CIO unions, other national unions and other local unions under the spanner "Elections in which representation rights were won by", then a Number/Percent pair under "Elections in which no representative was chosen". Dash rules ("----") appear in the cumulative-percent cell of the "Total RC and RM elections" row and in many "Percent by size class" cells where the count is 0; per instructions these are transcribed as empty cells, while the printed zeros beside them are kept as "0". Arithmetic cross-checks (not applied to the cells, which are as printed): the "Number eligible to vote", "Total elections" and all four count columns each sum exactly to the printed totals (223,239; 3,162; 1,477; 41; 158; 1,486), and the cumulative-percent column matches the running sum of "Percent of total" throughout, which gives high confidence in the digits and their column placement. Two printed percentages differ slightly from a direct recomputation but are internally consistent with the rest of the printed column, so they are almost certainly as the source intends: "Under 10" AFL-CIO percent by size class reads 24.9 (366/1,477 = 24.8, but 24.9 makes the column sum to exactly 100.0), and "600 to 799" percent of total reads 0.5 (12/3,162 = 0.4, but 0.5 matches the jump in cumulative percent from 98.9 to 99.4). No cells were illegible.
p. 164. 13 columns. Panel B of Table 17 only (the crop is the "—Continued" page); the caption carries a raised 1 but no footnote text is printed within the crop, so `footnotes` is empty. Dash rules ("----") printed in place of a percentage (the Cumulative column of the "Total RD elections" row, and the many "Percent by size class" cells opposite a 0 count) are transcribed as empty cells per instruction. Possible misprint, transcribed as printed: in the "Other local unions — Percent by size class" column, rows "30 to 39" and "40 to 49" both read 11.0 where 2 of 18 would be 11.1 (the other entries in that column — 16.7, 22.2, 5.6 — follow the 1/18 = 5.6 pattern exactly). Internal checks pass: the body columns sum to the printed totals (Total elections 423, AFL-CIO 115, other national 2, other local 18, no representative 288) and the cumulative percent reaches 100.0 at "300 to 499", so no body rows are cut off at the bottom of the crop.
Source image
Source data: U.S. NLRB Annual Reports (public domain). Reconstruction by NLRB Stats Archive. Read by claude-opus-5 (effort max, prompt extract_v1) from the 300-dpi scan; stitched by page. Updated October 2026.