NLRB Stats Archive › Annual Reports › FY1999 › Industrial Distribution of Representation Elections Held in Cases Closed, Fiscal Year 1999
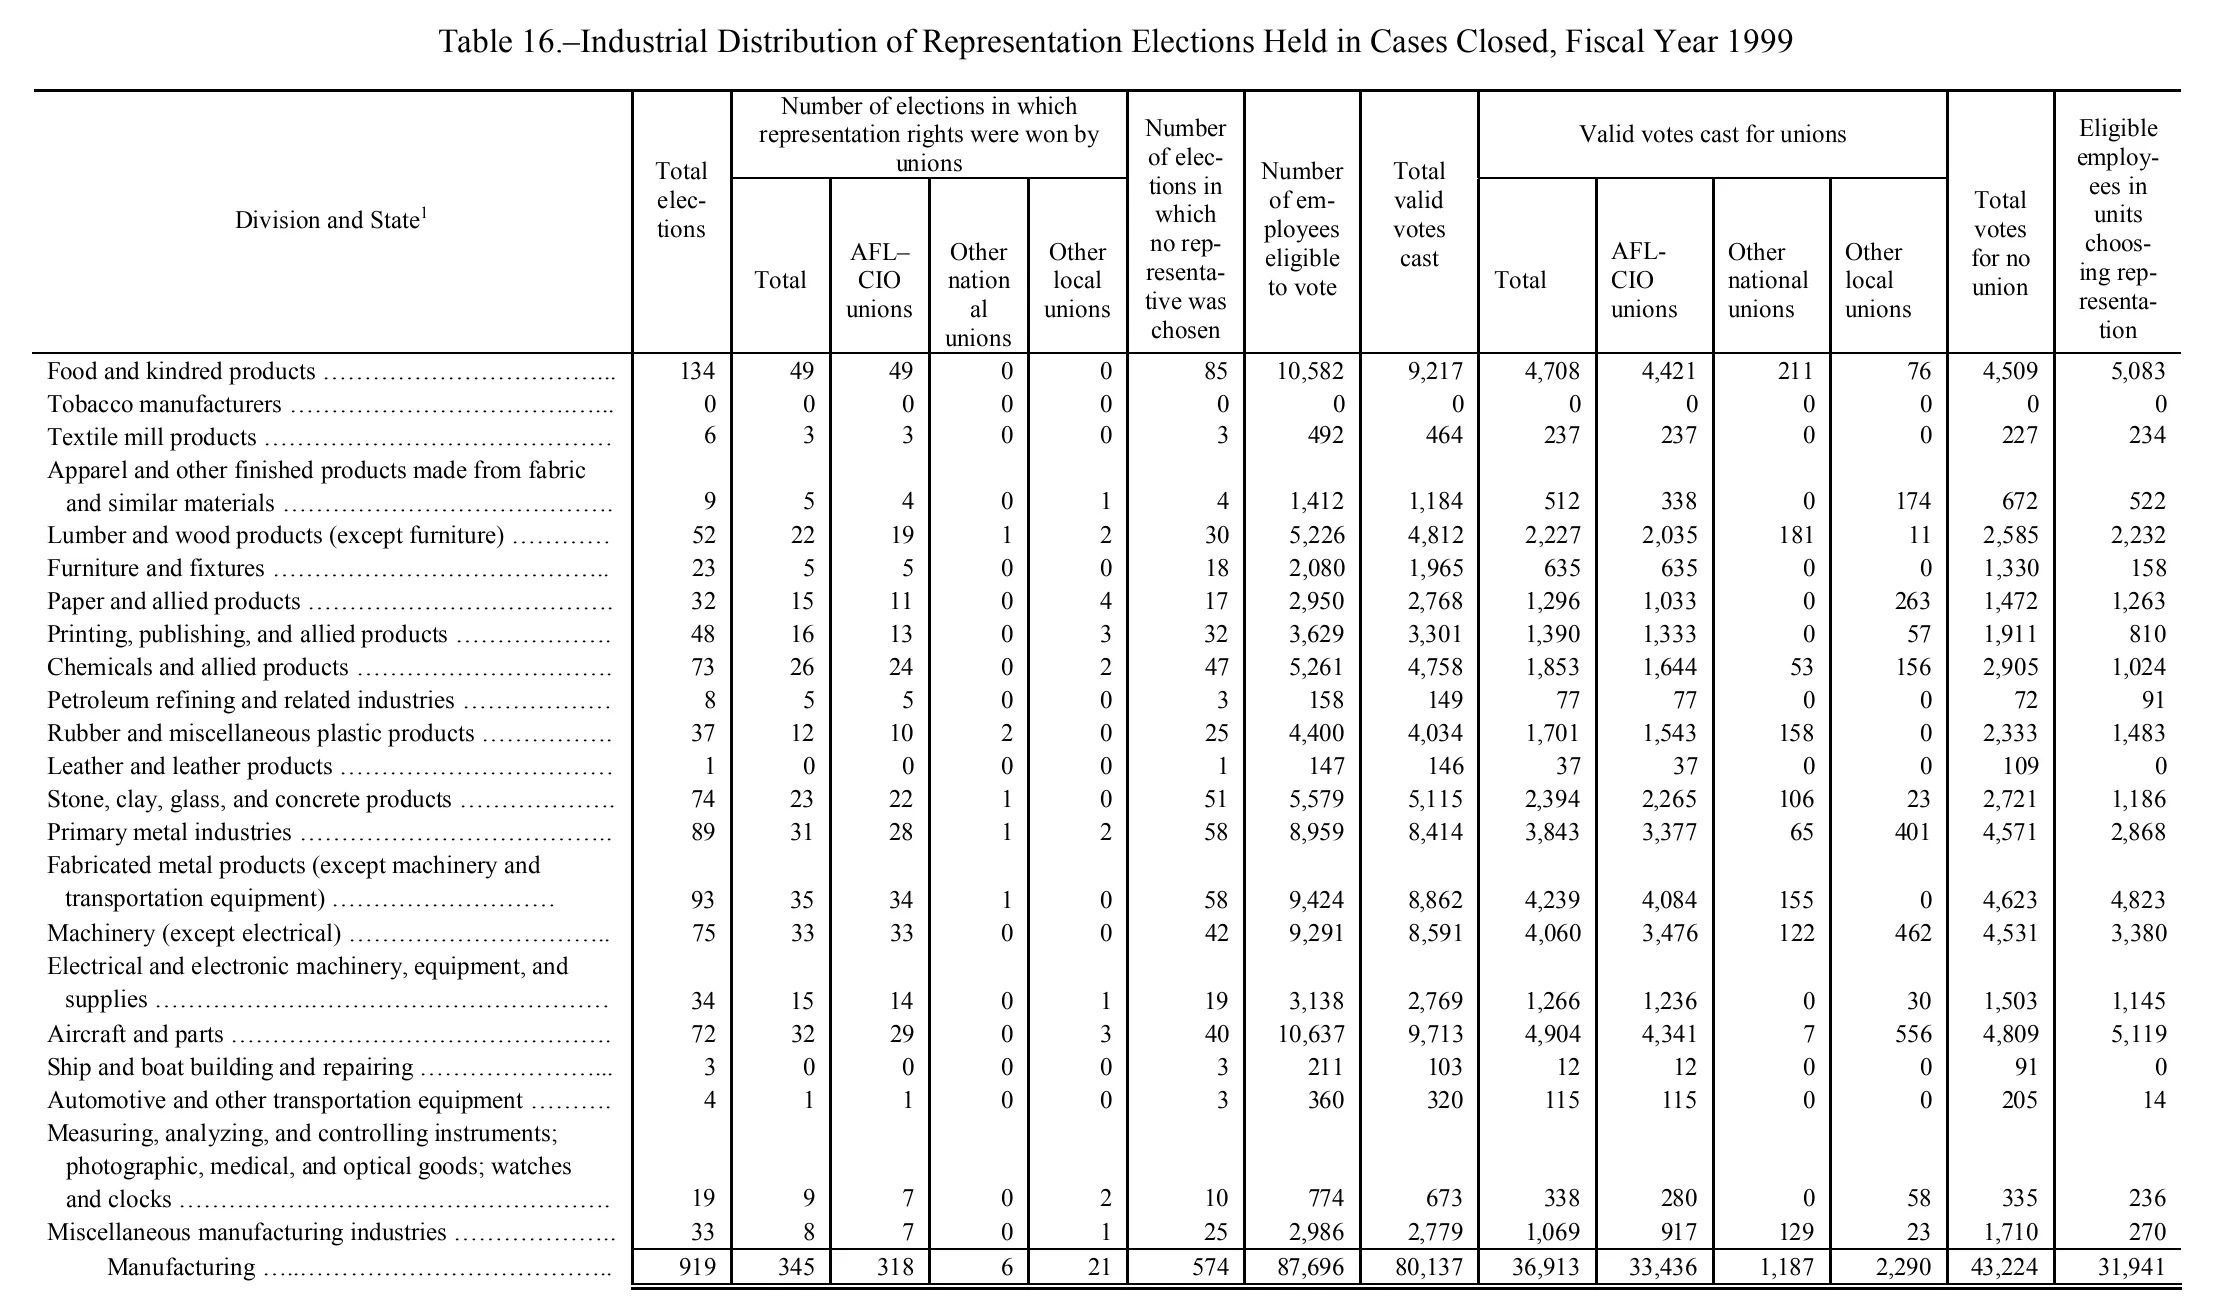
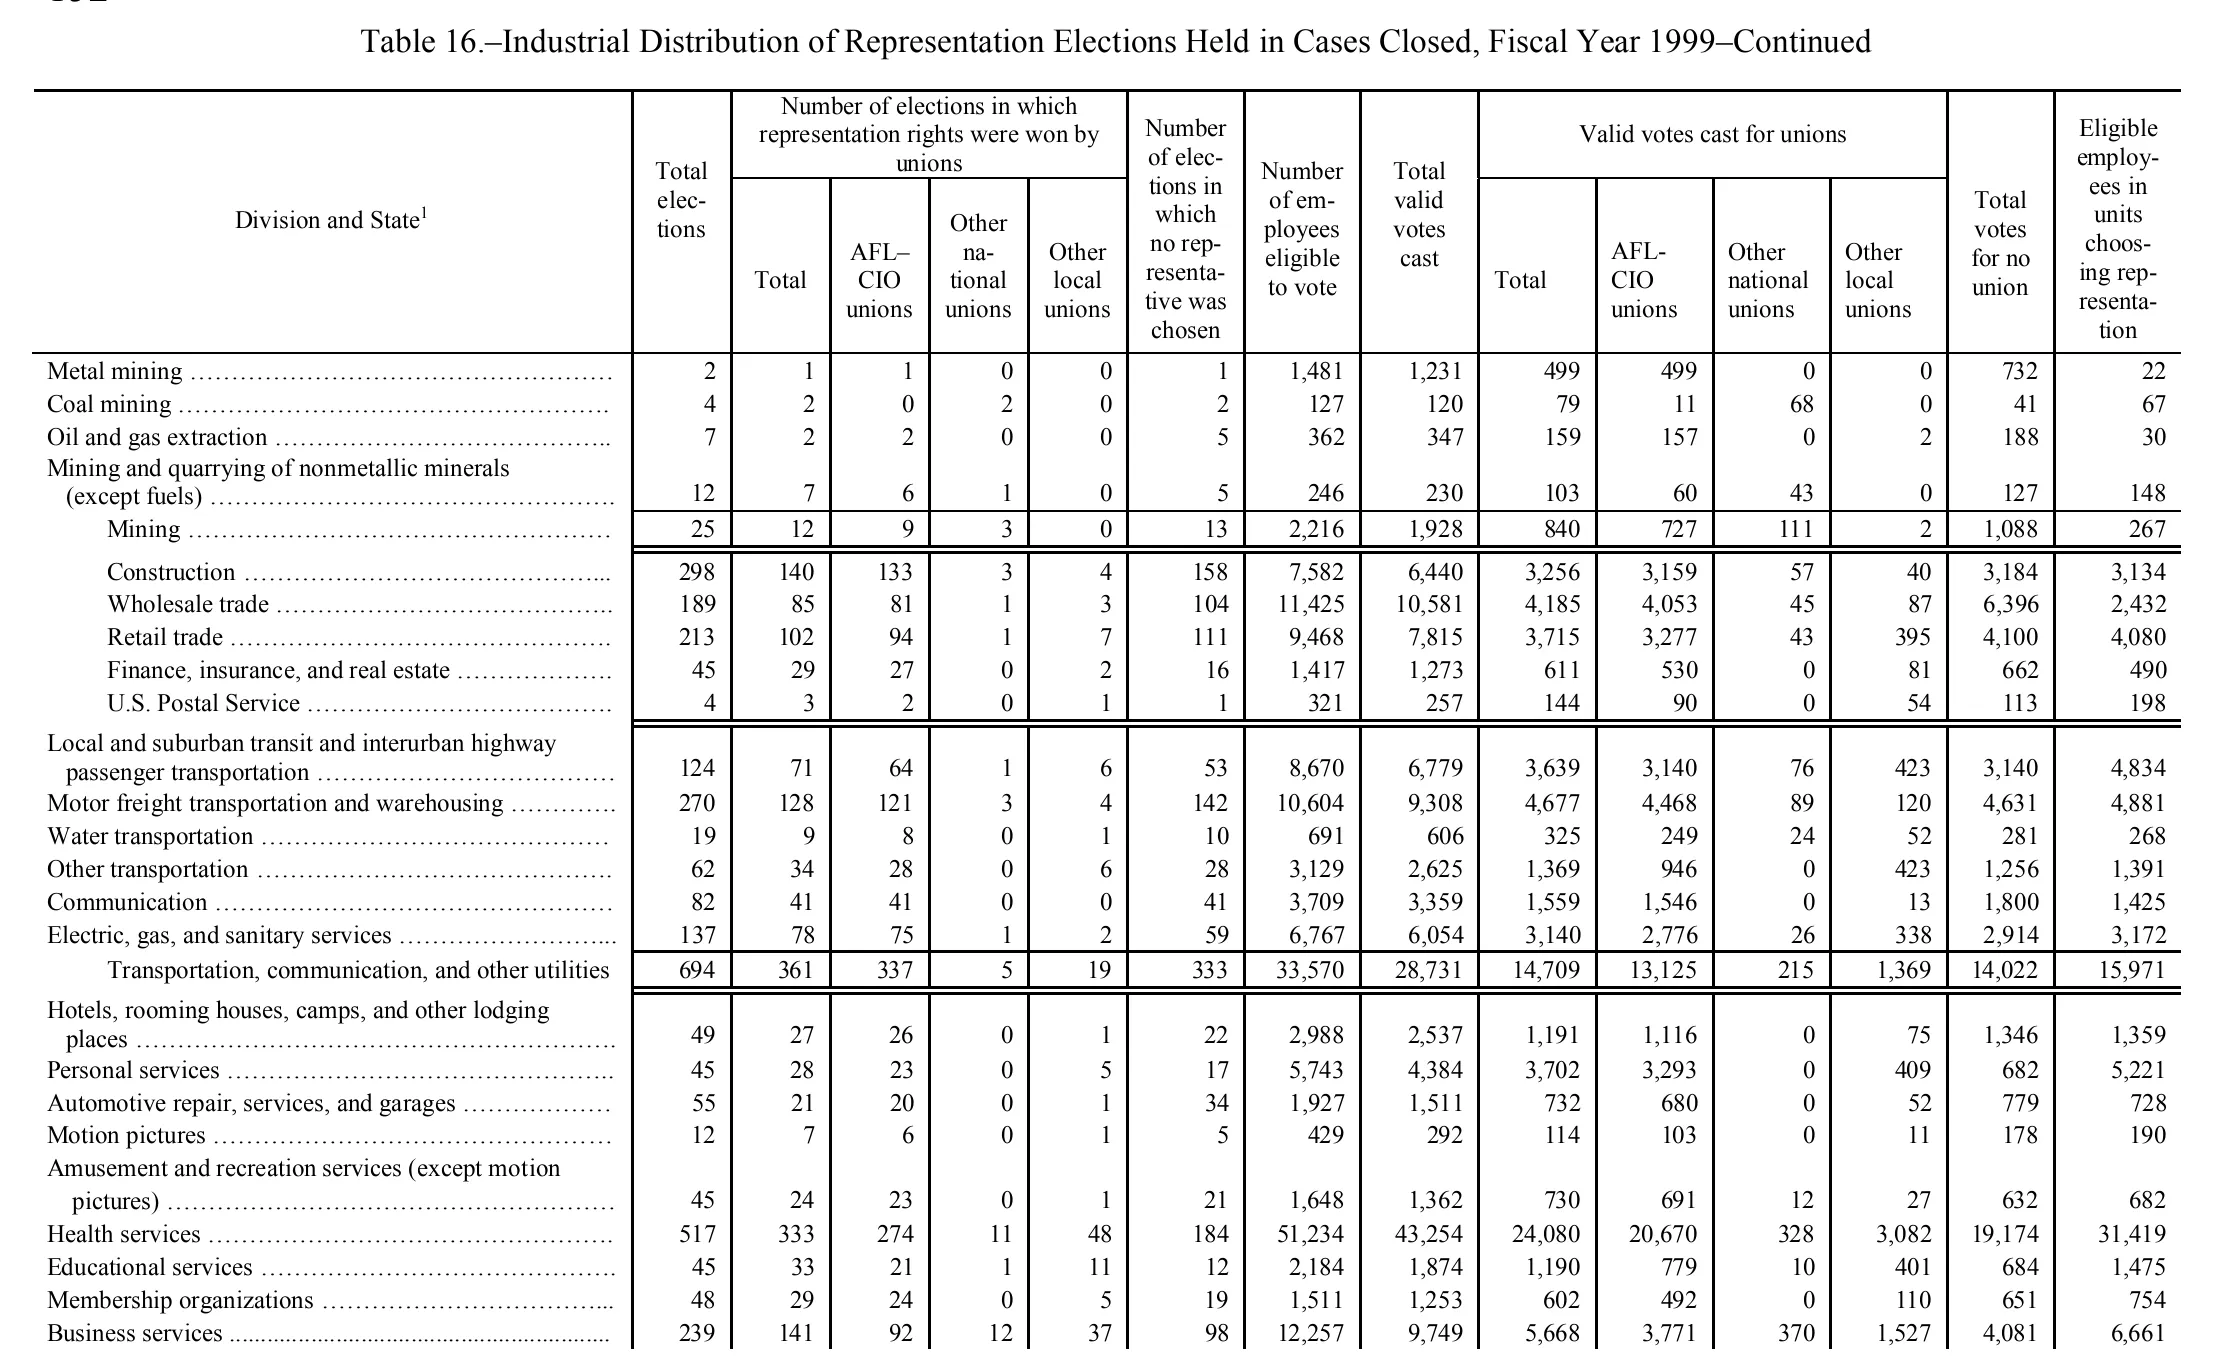
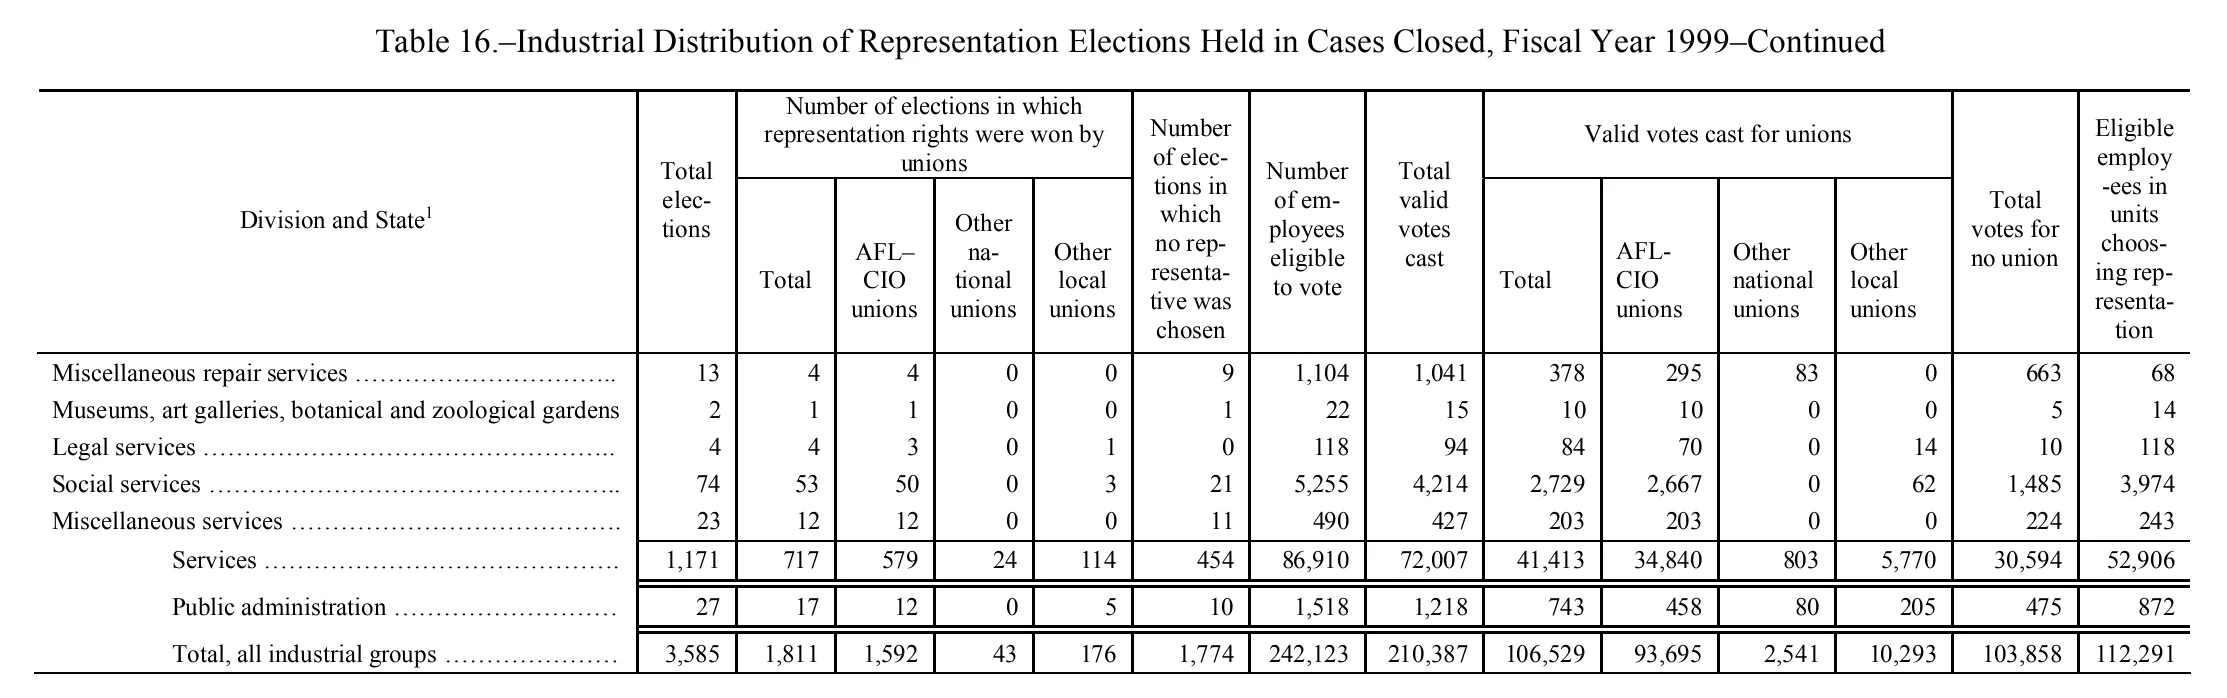
Industrial Distribution of Representation Elections Held in Cases Closed, Fiscal Year 1999
Stitched from pp. 160–162.
| Division and State | Total elections | Number of elections in which representation rights were won by unions | Number of elections in which no representative was chosen | Number of employees eligible to vote | Total valid votes cast | Valid votes cast for unions | Total votes for no union | Eligible employees in units choosing representation | ||||||
|---|---|---|---|---|---|---|---|---|---|---|---|---|---|---|
| Division and State | Total elections | Total | AFL–CIO unions | Other national unions | Other local unions | Number of elections in which no representative was chosen | Number of employees eligible to vote | Total valid votes cast | Total | AFL-CIO unions | Other national unions | Other local unions | Total votes for no union | Eligible employees in units choosing representation |
| Food and kindred products | 134 | 49 | 49 | 0 | 0 | 85 | 10,582 | 9,217 | 4,708 | 4,421 | 211 | 76 | 4,509 | 5,083 |
| Tobacco manufacturers | 0 | 0 | 0 | 0 | 0 | 0 | 0 | 0 | 0 | 0 | 0 | 0 | 0 | 0 |
| Textile mill products | 6 | 3 | 3 | 0 | 0 | 3 | 492 | 464 | 237 | 237 | 0 | 0 | 227 | 234 |
| Apparel and other finished products made from fabric and similar materials | 9 | 5 | 4 | 0 | 1 | 4 | 1,412 | 1,184 | 512 | 338 | 0 | 174 | 672 | 522 |
| Lumber and wood products (except furniture) | 52 | 22 | 19 | 1 | 2 | 30 | 5,226 | 4,812 | 2,227 | 2,035 | 181 | 11 | 2,585 | 2,232 |
| Furniture and fixtures | 23 | 5 | 5 | 0 | 0 | 18 | 2,080 | 1,965 | 635 | 635 | 0 | 0 | 1,330 | 158 |
| Paper and allied products | 32 | 15 | 11 | 0 | 4 | 17 | 2,950 | 2,768 | 1,296 | 1,033 | 0 | 263 | 1,472 | 1,263 |
| Printing, publishing, and allied products | 48 | 16 | 13 | 0 | 3 | 32 | 3,629 | 3,301 | 1,390 | 1,333 | 0 | 57 | 1,911 | 810 |
| Chemicals and allied products | 73 | 26 | 24 | 0 | 2 | 47 | 5,261 | 4,758 | 1,853 | 1,644 | 53 | 156 | 2,905 | 1,024 |
| Petroleum refining and related industries | 8 | 5 | 5 | 0 | 0 | 3 | 158 | 149 | 77 | 77 | 0 | 0 | 72 | 91 |
| Rubber and miscellaneous plastic products | 37 | 12 | 10 | 2 | 0 | 25 | 4,400 | 4,034 | 1,701 | 1,543 | 158 | 0 | 2,333 | 1,483 |
| Leather and leather products | 1 | 0 | 0 | 0 | 0 | 1 | 147 | 146 | 37 | 37 | 0 | 0 | 109 | 0 |
| Stone, clay, glass, and concrete products | 74 | 23 | 22 | 1 | 0 | 51 | 5,579 | 5,115 | 2,394 | 2,265 | 106 | 23 | 2,721 | 1,186 |
| Primary metal industries | 89 | 31 | 28 | 1 | 2 | 58 | 8,959 | 8,414 | 3,843 | 3,377 | 65 | 401 | 4,571 | 2,868 |
| Fabricated metal products (except machinery and transportation equipment) | 93 | 35 | 34 | 1 | 0 | 58 | 9,424 | 8,862 | 4,239 | 4,084 | 155 | 0 | 4,623 | 4,823 |
| Machinery (except electrical) | 75 | 33 | 33 | 0 | 0 | 42 | 9,291 | 8,591 | 4,060 | 3,476 | 122 | 462 | 4,531 | 3,380 |
| Electrical and electronic machinery, equipment, and supplies | 34 | 15 | 14 | 0 | 1 | 19 | 3,138 | 2,769 | 1,266 | 1,236 | 0 | 30 | 1,503 | 1,145 |
| Aircraft and parts | 72 | 32 | 29 | 0 | 3 | 40 | 10,637 | 9,713 | 4,904 | 4,341 | 7 | 556 | 4,809 | 5,119 |
| Ship and boat building and repairing | 3 | 0 | 0 | 0 | 0 | 3 | 211 | 103 | 12 | 12 | 0 | 0 | 91 | 0 |
| Automotive and other transportation equipment | 4 | 1 | 1 | 0 | 0 | 3 | 360 | 320 | 115 | 115 | 0 | 0 | 205 | 14 |
| Measuring, analyzing, and controlling instruments; photographic, medical, and optical goods; watches and clocks | 19 | 9 | 7 | 0 | 2 | 10 | 774 | 673 | 338 | 280 | 0 | 58 | 335 | 236 |
| Miscellaneous manufacturing industries | 33 | 8 | 7 | 0 | 1 | 25 | 2,986 | 2,779 | 1,069 | 917 | 129 | 23 | 1,710 | 270 |
| Manufacturing | 919 | 345 | 318 | 6 | 21 | 574 | 87,696 | 80,137 | 36,913 | 33,436 | 1,187 | 2,290 | 43,224 | 31,941 |
| Metal mining | 2 | 1 | 1 | 0 | 0 | 1 | 1,481 | 1,231 | 499 | 499 | 0 | 0 | 732 | 22 |
| Coal mining | 4 | 2 | 0 | 2 | 0 | 2 | 127 | 120 | 79 | 11 | 68 | 0 | 41 | 67 |
| Oil and gas extraction | 7 | 2 | 2 | 0 | 0 | 5 | 362 | 347 | 159 | 157 | 0 | 2 | 188 | 30 |
| Mining and quarrying of nonmetallic minerals (except fuels) | 12 | 7 | 6 | 1 | 0 | 5 | 246 | 230 | 103 | 60 | 43 | 0 | 127 | 148 |
| Mining | 25 | 12 | 9 | 3 | 0 | 13 | 2,216 | 1,928 | 840 | 727 | 111 | 2 | 1,088 | 267 |
| Construction | 298 | 140 | 133 | 3 | 4 | 158 | 7,582 | 6,440 | 3,256 | 3,159 | 57 | 40 | 3,184 | 3,134 |
| Wholesale trade | 189 | 85 | 81 | 1 | 3 | 104 | 11,425 | 10,581 | 4,185 | 4,053 | 45 | 87 | 6,396 | 2,432 |
| Retail trade | 213 | 102 | 94 | 1 | 7 | 111 | 9,468 | 7,815 | 3,715 | 3,277 | 43 | 395 | 4,100 | 4,080 |
| Finance, insurance, and real estate | 45 | 29 | 27 | 0 | 2 | 16 | 1,417 | 1,273 | 611 | 530 | 0 | 81 | 662 | 490 |
| U.S. Postal Service | 4 | 3 | 2 | 0 | 1 | 1 | 321 | 257 | 144 | 90 | 0 | 54 | 113 | 198 |
| Local and suburban transit and interurban highway passenger transportation | 124 | 71 | 64 | 1 | 6 | 53 | 8,670 | 6,779 | 3,639 | 3,140 | 76 | 423 | 3,140 | 4,834 |
| Motor freight transportation and warehousing | 270 | 128 | 121 | 3 | 4 | 142 | 10,604 | 9,308 | 4,677 | 4,468 | 89 | 120 | 4,631 | 4,881 |
| Water transportation | 19 | 9 | 8 | 0 | 1 | 10 | 691 | 606 | 325 | 249 | 24 | 52 | 281 | 268 |
| Other transportation | 62 | 34 | 28 | 0 | 6 | 28 | 3,129 | 2,625 | 1,369 | 946 | 0 | 423 | 1,256 | 1,391 |
| Communication | 82 | 41 | 41 | 0 | 0 | 41 | 3,709 | 3,359 | 1,559 | 1,546 | 0 | 13 | 1,800 | 1,425 |
| Electric, gas, and sanitary services | 137 | 78 | 75 | 1 | 2 | 59 | 6,767 | 6,054 | 3,140 | 2,776 | 26 | 338 | 2,914 | 3,172 |
| Transportation, communication, and other utilities | 694 | 361 | 337 | 5 | 19 | 333 | 33,570 | 28,731 | 14,709 | 13,125 | 215 | 1,369 | 14,022 | 15,971 |
| Hotels, rooming houses, camps, and other lodging places | 49 | 27 | 26 | 0 | 1 | 22 | 2,988 | 2,537 | 1,191 | 1,116 | 0 | 75 | 1,346 | 1,359 |
| Personal services | 45 | 28 | 23 | 0 | 5 | 17 | 5,743 | 4,384 | 3,702 | 3,293 | 0 | 409 | 682 | 5,221 |
| Automotive repair, services, and garages | 55 | 21 | 20 | 0 | 1 | 34 | 1,927 | 1,511 | 732 | 680 | 0 | 52 | 779 | 728 |
| Motion pictures | 12 | 7 | 6 | 0 | 1 | 5 | 429 | 292 | 114 | 103 | 0 | 11 | 178 | 190 |
| Amusement and recreation services (except motion pictures) | 45 | 24 | 23 | 0 | 1 | 21 | 1,648 | 1,362 | 730 | 691 | 12 | 27 | 632 | 682 |
| Health services | 517 | 333 | 274 | 11 | 48 | 184 | 51,234 | 43,254 | 24,080 | 20,670 | 328 | 3,082 | 19,174 | 31,419 |
| Educational services | 45 | 33 | 21 | 1 | 11 | 12 | 2,184 | 1,874 | 1,190 | 779 | 10 | 401 | 684 | 1,475 |
| Membership organizations | 48 | 29 | 24 | 0 | 5 | 19 | 1,511 | 1,253 | 602 | 492 | 0 | 110 | 651 | 754 |
| Business services | 239 | 141 | 92 | 12 | 37 | 98 | 12,257 | 9,749 | 5,668 | 3,771 | 370 | 1,527 | 4,081 | 6,661 |
| Miscellaneous repair services | 13 | 4 | 4 | 0 | 0 | 9 | 1,104 | 1,041 | 378 | 295 | 83 | 0 | 663 | 68 |
| Museums, art galleries, botanical and zoological gardens | 2 | 1 | 1 | 0 | 0 | 1 | 22 | 15 | 10 | 10 | 0 | 0 | 5 | 14 |
| Legal services | 4 | 4 | 3 | 0 | 1 | 0 | 118 | 94 | 84 | 70 | 0 | 14 | 10 | 118 |
| Social services | 74 | 53 | 50 | 0 | 3 | 21 | 5,255 | 4,214 | 2,729 | 2,667 | 0 | 62 | 1,485 | 3,974 |
| Miscellaneous services | 23 | 12 | 12 | 0 | 0 | 11 | 490 | 427 | 203 | 203 | 0 | 0 | 224 | 243 |
| Services | 1,171 | 717 | 579 | 24 | 114 | 454 | 86,910 | 72,007 | 41,413 | 34,840 | 803 | 5,770 | 30,594 | 52,906 |
| Public administration | 27 | 17 | 12 | 0 | 5 | 10 | 1,518 | 1,218 | 743 | 458 | 80 | 205 | 475 | 872 |
| Total, all industrial groups | 3,585 | 1,811 | 1,592 | 43 | 176 | 1,774 | 242,123 | 210,387 | 106,529 | 93,695 | 2,541 | 10,293 | 103,858 | 112,291 |
681 of 681 figures sit in a row or column sum that works out.
Reader’s notes
p. 160. The crop shows only the first page of this table: it ends with the indented "Manufacturing" subtotal row below a double rule, and the table continues (nonmanufacturing industries, divisions and states) on following pages. No footnote text is printed on this crop, although the stub heading carries a raised "1" marker (transcribed as "Division and State^1"); the footnote itself must appear at the end of the table on a later page. Column structure: 15 columns. Two spanner headings cover four columns each — "Number of elections in which representation rights were won by unions" over Total / AFL–CIO unions / Other national unions / Other local unions, and "Valid votes cast for unions" over the same four sub-headings. All other headings are tall single-level headings and are repeated in both header rows. The two "AFL-CIO" sub-headings are typeset differently: the one under the elections spanner uses an en dash ("AFL–CIO") while the one under the votes spanner uses a hyphen ("AFL-CIO"); both are transcribed as printed. The "Other national unions" headings are broken across lines as "Other / nation / al / unions" without a hyphen and have been joined. Arithmetic check: all 14 numeric columns of the 22 industry rows sum exactly to the printed "Manufacturing" subtotal (919; 345; 318; 6; 21; 574; 87,696; 80,137; 36,913; 33,436; 1,187; 2,290; 43,224; 31,941), so no misprints or misplaced digits are suspected. No cells were illegible.
p. 161. The crop is a continuation page ("—Continued"); the table body is cut off at the bottom after "Business services", and no footnote text is printed on this image (the stub heading carries marker 1, whose text appears elsewhere). 15 columns: stub, "Total elections", the four-column "won by unions" group, "no representative was chosen", "employees eligible to vote", "Total valid votes cast", the four-column "Valid votes cast for unions" group, "Total votes for no union", and "Eligible employees in units choosing representation". Suspected misprint: the stub heading reads "Division and State" even though this is the industrial-distribution table (Table 16) whose stub holds industry names; the heading appears to have been carried over from the preceding geographic table. Transcribed as printed. The stub heading's "AFL-CIO unions" is printed with a line-break hyphen ("AFL– / CIO unions") in the first group and as "AFL- / CIO unions" in the second; both are rendered here as "AFL-CIO unions". "Mining" and "Transportation, communication, and other utilities" are indented group subtotal rows set off by rules; they are transcribed in row order as printed. Arithmetic cross-checks all balance: in every row the AFL-CIO/other-national/other-local components sum to their group totals, won + no-representative = total elections, and union votes + no-union votes = total valid votes cast; both subtotal rows equal the sum of their member rows in all 14 numeric columns. No value required correction.
p. 162. Continuation page of Table 16; the column headings are reprinted in full on this crop, so they are transcribed. 15 columns: stub, "Total elections", the four-column "won by unions" block, "no representative chosen", "employees eligible to vote", "total valid votes cast", the four-column "Valid votes cast for unions" block, "Total votes for no union", and "Eligible employees in units choosing representation". The stub heading carries a superscript 1 footnote marker, but no footnote text appears on this crop (it is presumably printed on the first page of the table). The first "AFL-CIO unions" heading is set with an en dash ("AFL–CIO") and the second with a hyphen; both are transcribed as "AFL-CIO unions". The "Services", "Public administration", and "Total, all industrial groups" rows are indented subtotal/total lines set off by rules. All internal arithmetic checks (component columns summing to their block totals, and wins + no-representative = total elections) are consistent as transcribed. No cells were illegible.
Source image
Source data: U.S. NLRB Annual Reports (public domain). Reconstruction by NLRB Stats Archive. Read by claude-opus-5 (effort max, prompt extract_v1) from the 300-dpi scan; stitched by page. Updated October 2026.