NLRB Stats Archive › Annual Reports › FY1999 › Standard Federal Administrative Regional Distribution of Cases Received, Fiscal Year 1999
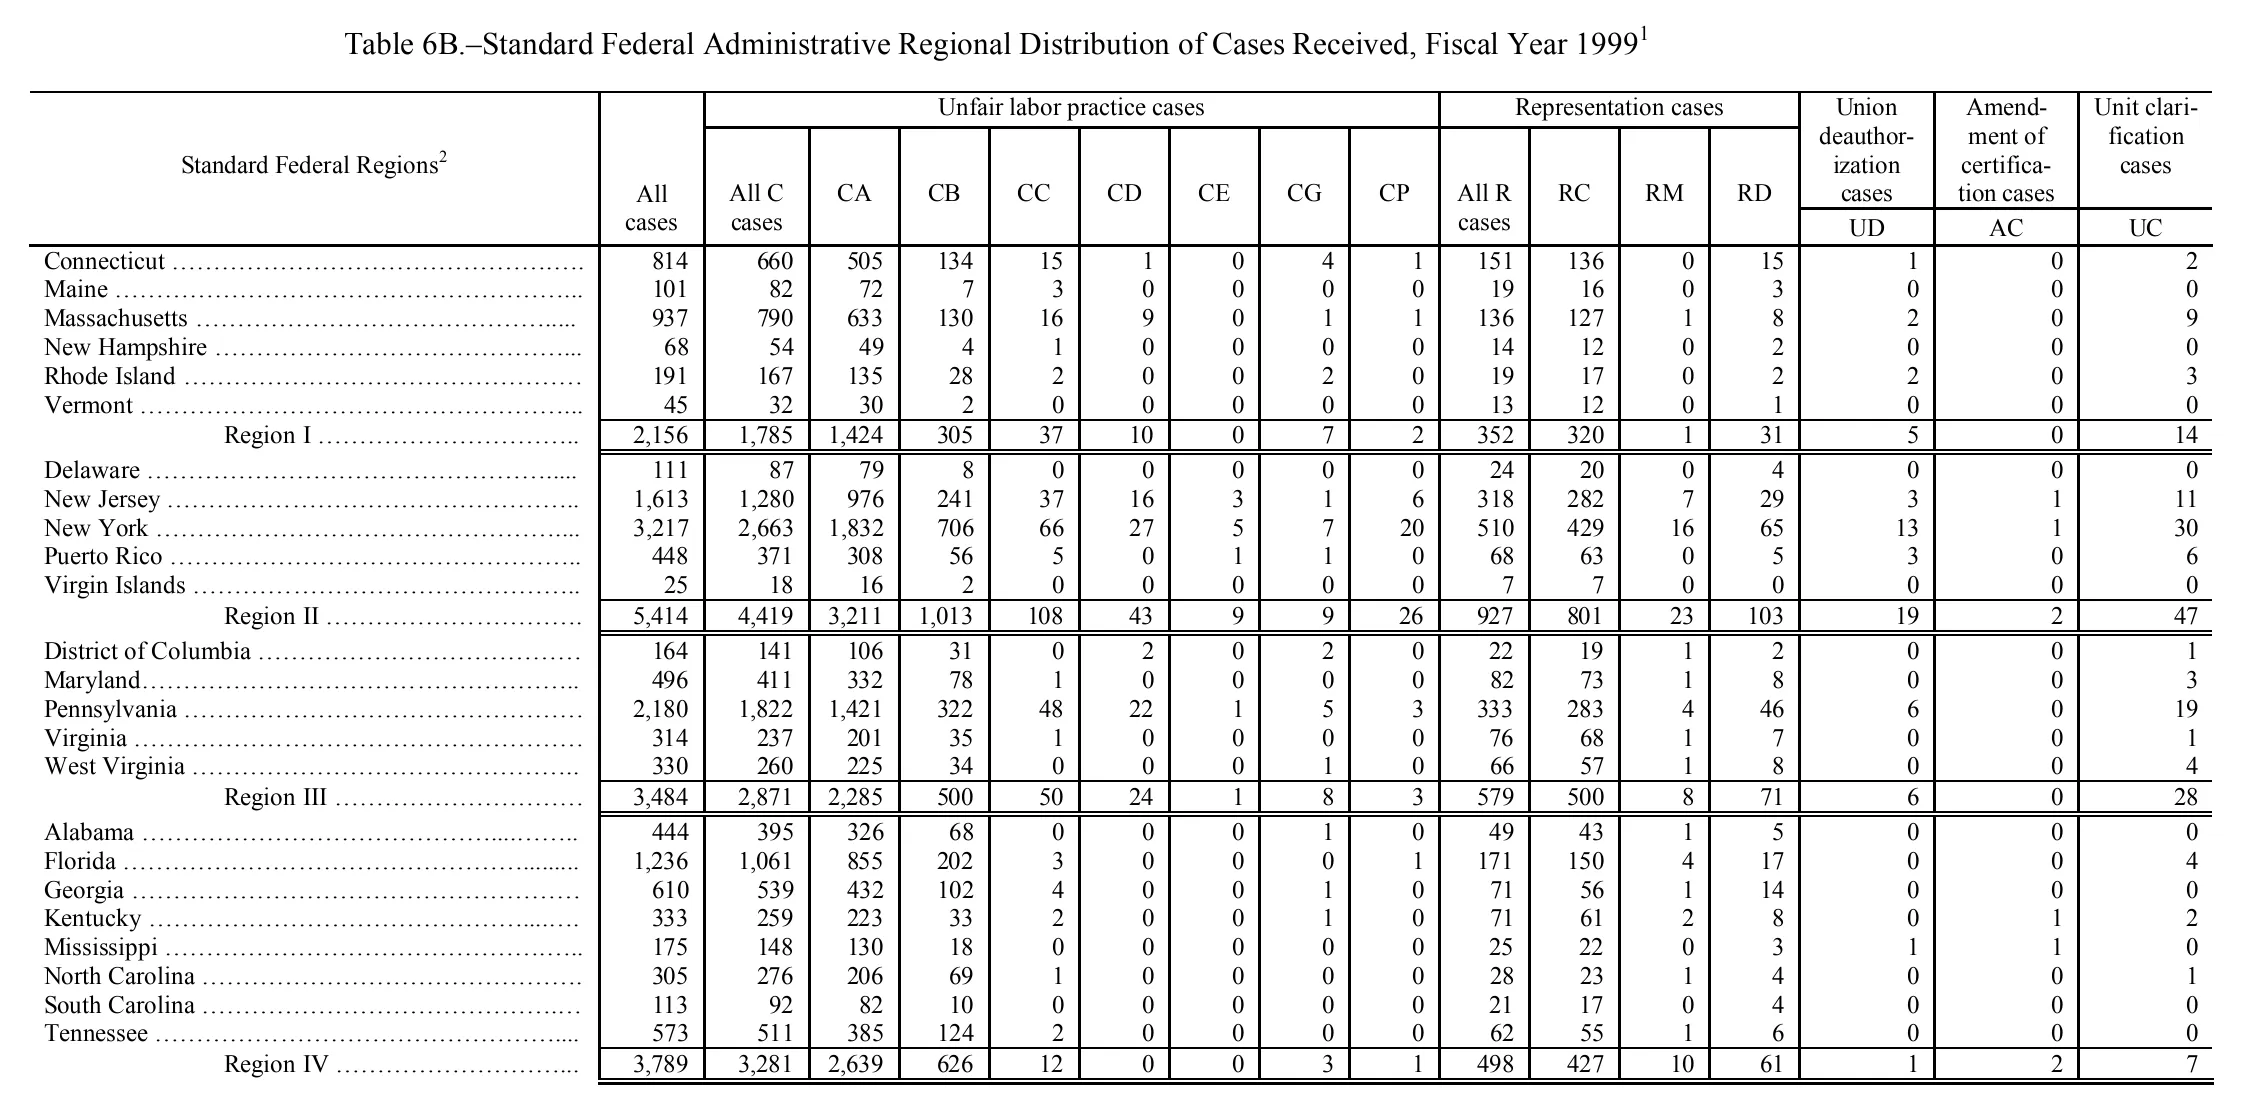
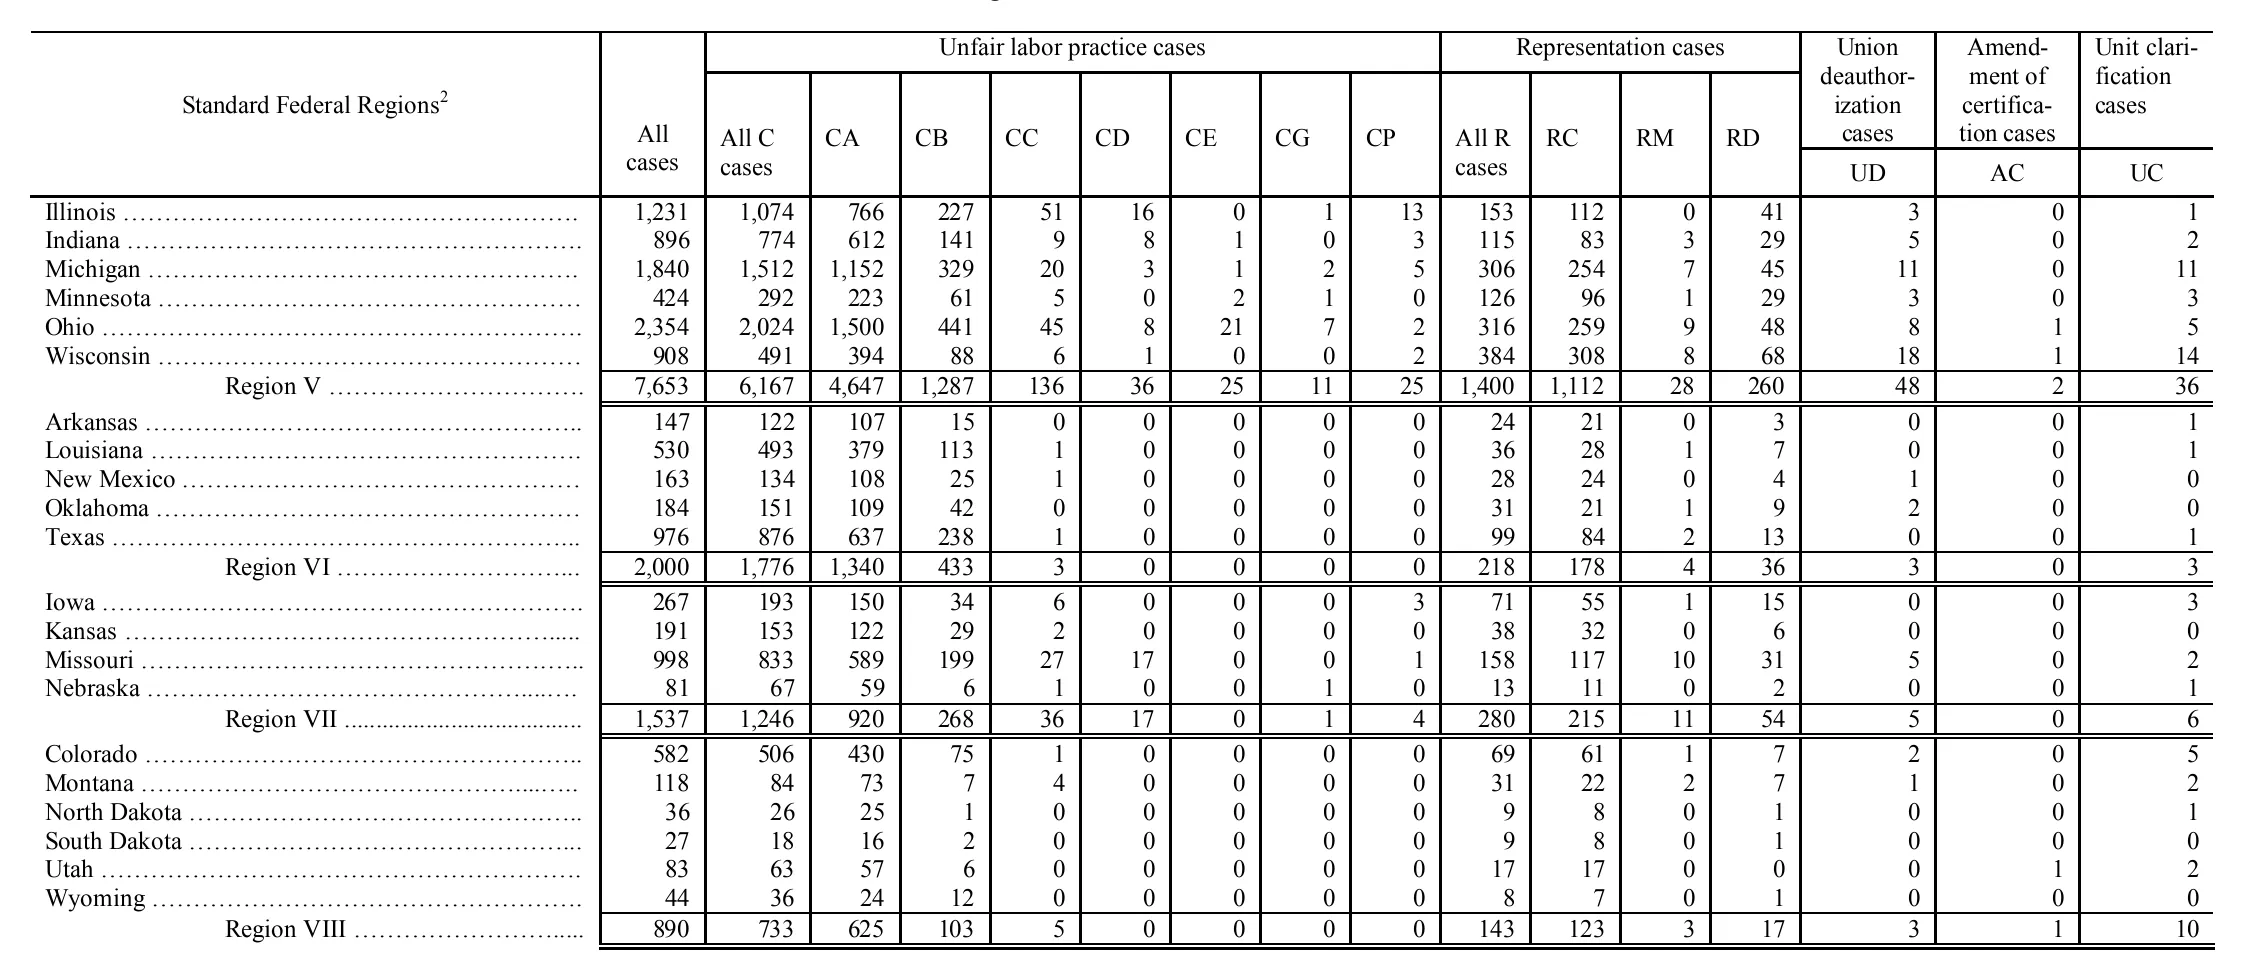
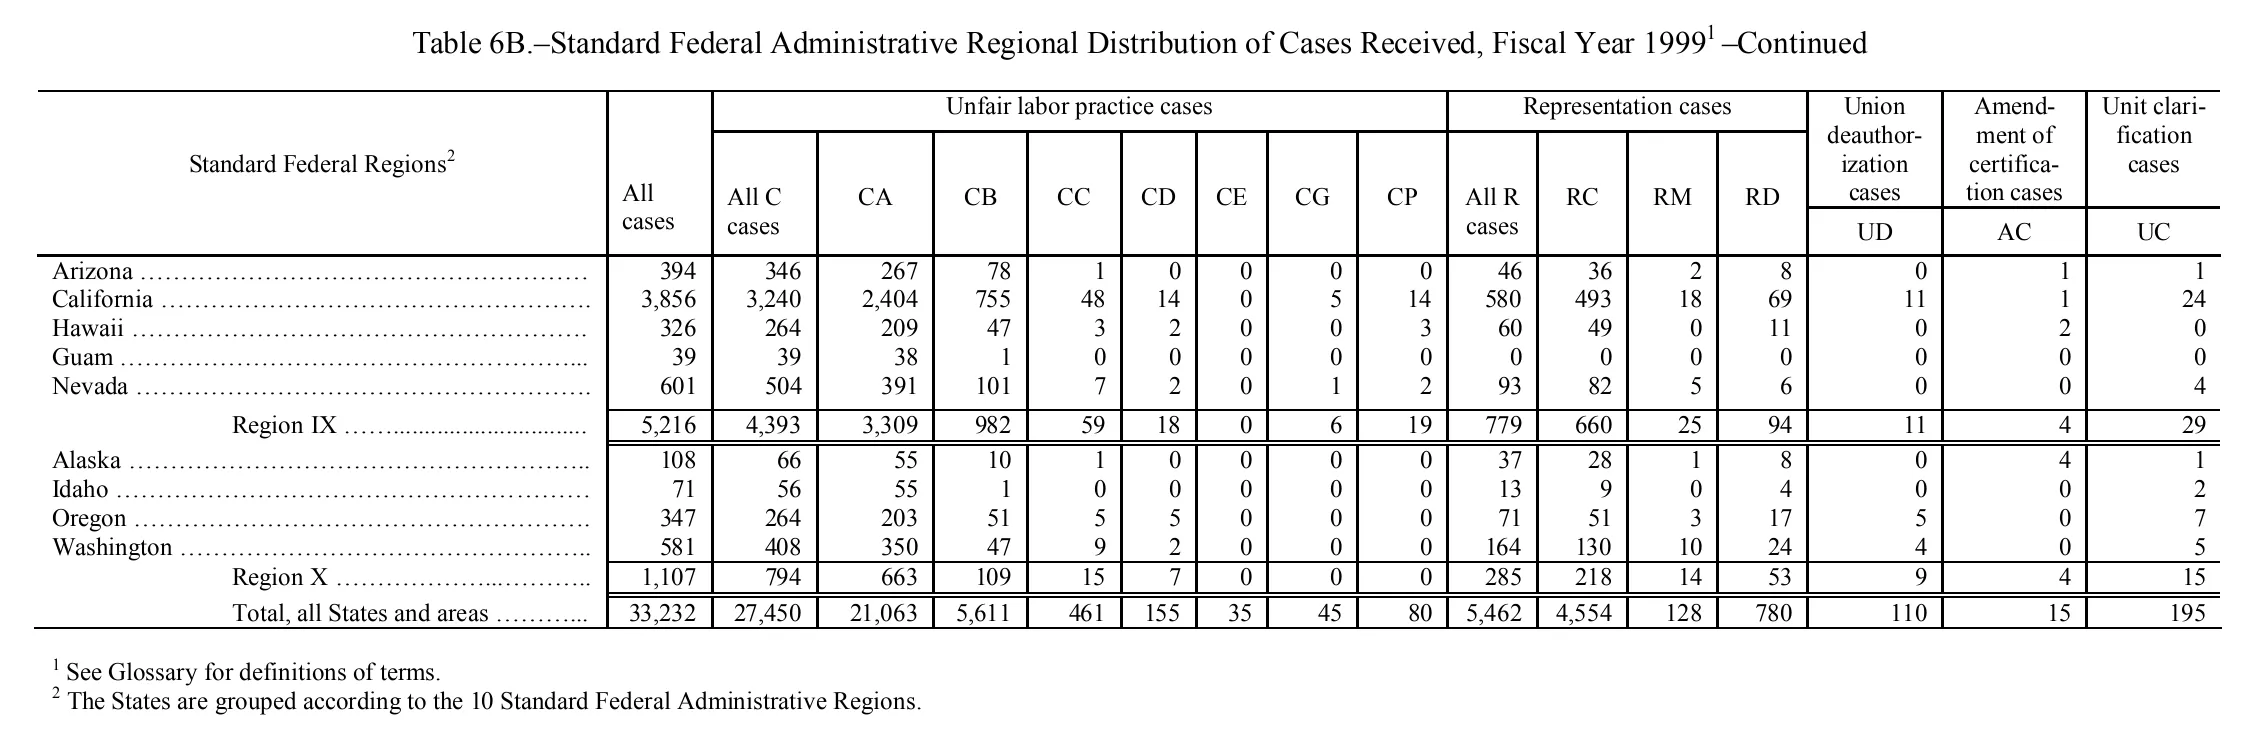
Standard Federal Administrative Regional Distribution of Cases Received, Fiscal Year 1999
Stitched from pp. 124–126.
| Standard Federal Regions | All cases | Unfair labor practice cases | Representation cases | Union deauthorization cases | Amendment of certification cases | Unit clarification cases | ||||||||||
|---|---|---|---|---|---|---|---|---|---|---|---|---|---|---|---|---|
| Standard Federal Regions | All cases | All C cases | CA | CB | CC | CD | CE | CG | CP | All R cases | RC | RM | RD | Union deauthorization cases | Amendment of certification cases | Unit clarification cases |
| Standard Federal Regions | All cases | All C cases | CA | CB | CC | CD | CE | CG | CP | All R cases | RC | RM | RD | UD | AC | UC |
| Connecticut | 814 | 660 | 505 | 134 | 15 | 1 | 0 | 4 | 1 | 151 | 136 | 0 | 15 | 1 | 0 | 2 |
| Maine | 101 | 82 | 72 | 7 | 3 | 0 | 0 | 0 | 0 | 19 | 16 | 0 | 3 | 0 | 0 | 0 |
| Massachusetts | 937 | 790 | 633 | 130 | 16 | 9 | 0 | 1 | 1 | 136 | 127 | 1 | 8 | 2 | 0 | 9 |
| New Hampshire | 68 | 54 | 49 | 4 | 1 | 0 | 0 | 0 | 0 | 14 | 12 | 0 | 2 | 0 | 0 | 0 |
| Rhode Island | 191 | 167 | 135 | 28 | 2 | 0 | 0 | 2 | 0 | 19 | 17 | 0 | 2 | 2 | 0 | 3 |
| Vermont | 45 | 32 | 30 | 2 | 0 | 0 | 0 | 0 | 0 | 13 | 12 | 0 | 1 | 0 | 0 | 0 |
| Region I | 2,156 | 1,785 | 1,424 | 305 | 37 | 10 | 0 | 7 | 2 | 352 | 320 | 1 | 31 | 5 | 0 | 14 |
| Delaware | 111 | 87 | 79 | 8 | 0 | 0 | 0 | 0 | 0 | 24 | 20 | 0 | 4 | 0 | 0 | 0 |
| New Jersey | 1,613 | 1,280 | 976 | 241 | 37 | 16 | 3 | 1 | 6 | 318 | 282 | 7 | 29 | 3 | 1 | 11 |
| New York | 3,217 | 2,663 | 1,832 | 706 | 66 | 27 | 5 | 7 | 20 | 510 | 429 | 16 | 65 | 13 | 1 | 30 |
| Puerto Rico | 448 | 371 | 308 | 56 | 5 | 0 | 1 | 1 | 0 | 68 | 63 | 0 | 5 | 3 | 0 | 6 |
| Virgin Islands | 25 | 18 | 16 | 2 | 0 | 0 | 0 | 0 | 0 | 7 | 7 | 0 | 0 | 0 | 0 | 0 |
| Region II | 5,414 | 4,419 | 3,211 | 1,013 | 108 | 43 | 9 | 9 | 26 | 927 | 801 | 23 | 103 | 19 | 2 | 47 |
| District of Columbia | 164 | 141 | 106 | 31 | 0 | 2 | 0 | 2 | 0 | 22 | 19 | 1 | 2 | 0 | 0 | 1 |
| Maryland | 496 | 411 | 332 | 78 | 1 | 0 | 0 | 0 | 0 | 82 | 73 | 1 | 8 | 0 | 0 | 3 |
| Pennsylvania | 2,180 | 1,822 | 1,421 | 322 | 48 | 22 | 1 | 5 | 3 | 333 | 283 | 4 | 46 | 6 | 0 | 19 |
| Virginia | 314 | 237 | 201 | 35 | 1 | 0 | 0 | 0 | 0 | 76 | 68 | 1 | 7 | 0 | 0 | 1 |
| West Virginia | 330 | 260 | 225 | 34 | 0 | 0 | 0 | 1 | 0 | 66 | 57 | 1 | 8 | 0 | 0 | 4 |
| Region III | 3,484 | 2,871 | 2,285 | 500 | 50 | 24 | 1 | 8 | 3 | 579 | 500 | 8 | 71 | 6 | 0 | 28 |
| Alabama | 444 | 395 | 326 | 68 | 0 | 0 | 0 | 1 | 0 | 49 | 43 | 1 | 5 | 0 | 0 | 0 |
| Florida | 1,236 | 1,061 | 855 | 202 | 3 | 0 | 0 | 0 | 1 | 171 | 150 | 4 | 17 | 0 | 0 | 4 |
| Georgia | 610 | 539 | 432 | 102 | 4 | 0 | 0 | 1 | 0 | 71 | 56 | 1 | 14 | 0 | 0 | 0 |
| Kentucky | 333 | 259 | 223 | 33 | 2 | 0 | 0 | 1 | 0 | 71 | 61 | 2 | 8 | 0 | 1 | 2 |
| Mississippi | 175 | 148 | 130 | 18 | 0 | 0 | 0 | 0 | 0 | 25 | 22 | 0 | 3 | 1 | 1 | 0 |
| North Carolina | 305 | 276 | 206 | 69 | 1 | 0 | 0 | 0 | 0 | 28 | 23 | 1 | 4 | 0 | 0 | 1 |
| South Carolina | 113 | 92 | 82 | 10 | 0 | 0 | 0 | 0 | 0 | 21 | 17 | 0 | 4 | 0 | 0 | 0 |
| Tennessee | 573 | 511 | 385 | 124 | 2 | 0 | 0 | 0 | 0 | 62 | 55 | 1 | 6 | 0 | 0 | 0 |
| Region IV | 3,789 | 3,281 | 2,639 | 626 | 12 | 0 | 0 | 3 | 1 | 498 | 427 | 10 | 61 | 1 | 2 | 7 |
| Illinois | 1,231 | 1,074 | 766 | 227 | 51 | 16 | 0 | 1 | 13 | 153 | 112 | 0 | 41 | 3 | 0 | 1 |
| Indiana | 896 | 774 | 612 | 141 | 9 | 8 | 1 | 0 | 3 | 115 | 83 | 3 | 29 | 5 | 0 | 2 |
| Michigan | 1,840 | 1,512 | 1,152 | 329 | 20 | 3 | 1 | 2 | 5 | 306 | 254 | 7 | 45 | 11 | 0 | 11 |
| Minnesota | 424 | 292 | 223 | 61 | 5 | 0 | 2 | 1 | 0 | 126 | 96 | 1 | 29 | 3 | 0 | 3 |
| Ohio | 2,354 | 2,024 | 1,500 | 441 | 45 | 8 | 21 | 7 | 2 | 316 | 259 | 9 | 48 | 8 | 1 | 5 |
| Wisconsin | 908 | 491 | 394 | 88 | 6 | 1 | 0 | 0 | 2 | 384 | 308 | 8 | 68 | 18 | 1 | 14 |
| Region V | 7,653 | 6,167 | 4,647 | 1,287 | 136 | 36 | 25 | 11 | 25 | 1,400 | 1,112 | 28 | 260 | 48 | 2 | 36 |
| Arkansas | 147 | 122 | 107 | 15 | 0 | 0 | 0 | 0 | 0 | 24 | 21 | 0 | 3 | 0 | 0 | 1 |
| Louisiana | 530 | 493 | 379 | 113 | 1 | 0 | 0 | 0 | 0 | 36 | 28 | 1 | 7 | 0 | 0 | 1 |
| New Mexico | 163 | 134 | 108 | 25 | 1 | 0 | 0 | 0 | 0 | 28 | 24 | 0 | 4 | 1 | 0 | 0 |
| Oklahoma | 184 | 151 | 109 | 42 | 0 | 0 | 0 | 0 | 0 | 31 | 21 | 1 | 9 | 2 | 0 | 0 |
| Texas | 976 | 876 | 637 | 238 | 1 | 0 | 0 | 0 | 0 | 99 | 84 | 2 | 13 | 0 | 0 | 1 |
| Region VI | 2,000 | 1,776 | 1,340 | 433 | 3 | 0 | 0 | 0 | 0 | 218 | 178 | 4 | 36 | 3 | 0 | 3 |
| Iowa | 267 | 193 | 150 | 34 | 6 | 0 | 0 | 0 | 3 | 71 | 55 | 1 | 15 | 0 | 0 | 3 |
| Kansas | 191 | 153 | 122 | 29 | 2 | 0 | 0 | 0 | 0 | 38 | 32 | 0 | 6 | 0 | 0 | 0 |
| Missouri | 998 | 833 | 589 | 199 | 27 | 17 | 0 | 0 | 1 | 158 | 117 | 10 | 31 | 5 | 0 | 2 |
| Nebraska | 81 | 67 | 59 | 6 | 1 | 0 | 0 | 1 | 0 | 13 | 11 | 0 | 2 | 0 | 0 | 1 |
| Region VII | 1,537 | 1,246 | 920 | 268 | 36 | 17 | 0 | 1 | 4 | 280 | 215 | 11 | 54 | 5 | 0 | 6 |
| Colorado | 582 | 506 | 430 | 75 | 1 | 0 | 0 | 0 | 0 | 69 | 61 | 1 | 7 | 2 | 0 | 5 |
| Montana | 118 | 84 | 73 | 7 | 4 | 0 | 0 | 0 | 0 | 31 | 22 | 2 | 7 | 1 | 0 | 2 |
| North Dakota | 36 | 26 | 25 | 1 | 0 | 0 | 0 | 0 | 0 | 9 | 8 | 0 | 1 | 0 | 0 | 1 |
| South Dakota | 27 | 18 | 16 | 2 | 0 | 0 | 0 | 0 | 0 | 9 | 8 | 0 | 1 | 0 | 0 | 0 |
| Utah | 83 | 63 | 57 | 6 | 0 | 0 | 0 | 0 | 0 | 17 | 17 | 0 | 0 | 0 | 1 | 2 |
| Wyoming | 44 | 36 | 24 | 12 | 0 | 0 | 0 | 0 | 0 | 8 | 7 | 0 | 1 | 0 | 0 | 0 |
| Region VIII | 890 | 733 | 625 | 103 | 5 | 0 | 0 | 0 | 0 | 143 | 123 | 3 | 17 | 3 | 1 | 10 |
| Arizona | 394 | 346 | 267 | 78 | 1 | 0 | 0 | 0 | 0 | 46 | 36 | 2 | 8 | 0 | 1 | 1 |
| California | 3,856 | 3,240 | 2,404 | 755 | 48 | 14 | 0 | 5 | 14 | 580 | 493 | 18 | 69 | 11 | 1 | 24 |
| Hawaii | 326 | 264 | 209 | 47 | 3 | 2 | 0 | 0 | 3 | 60 | 49 | 0 | 11 | 0 | 2 | 0 |
| Guam | 39 | 39 | 38 | 1 | 0 | 0 | 0 | 0 | 0 | 0 | 0 | 0 | 0 | 0 | 0 | 0 |
| Nevada | 601 | 504 | 391 | 101 | 7 | 2 | 0 | 1 | 2 | 93 | 82 | 5 | 6 | 0 | 0 | 4 |
| Region IX | 5,216 | 4,393 | 3,309 | 982 | 59 | 18 | 0 | 6 | 19 | 779 | 660 | 25 | 94 | 11 | 4 | 29 |
| Alaska | 108 | 66 | 55 | 10 | 1 | 0 | 0 | 0 | 0 | 37 | 28 | 1 | 8 | 0 | 4 | 1 |
| Idaho | 71 | 56 | 55 | 1 | 0 | 0 | 0 | 0 | 0 | 13 | 9 | 0 | 4 | 0 | 0 | 2 |
| Oregon | 347 | 264 | 203 | 51 | 5 | 5 | 0 | 0 | 0 | 71 | 51 | 3 | 17 | 5 | 0 | 7 |
| Washington | 581 | 408 | 350 | 47 | 9 | 2 | 0 | 0 | 0 | 164 | 130 | 10 | 24 | 4 | 0 | 5 |
| Region X | 1,107 | 794 | 663 | 109 | 15 | 7 | 0 | 0 | 0 | 285 | 218 | 14 | 53 | 9 | 4 | 15 |
| Total, all States and areas | 33,232 | 27,450 | 21,063 | 5,611 | 461 | 155 | 35 | 45 | 80 | 5,462 | 4,554 | 128 | 780 | 110 | 15 | 195 |
- 1 See Glossary for definitions of terms.
- 2 The States are grouped according to the 10 Standard Federal Administrative Regions.
729 of 729 figures sit in a row or column sum that works out.
Reader’s notes
p. 124. 17 columns: stub, "All cases", eight unfair-labor-practice columns (All C cases, CA, CB, CC, CD, CE, CG, CP), four representation columns (All R cases, RC, RM, RD), and three single columns (UD, AC, UC). The three rightmost columns carry a two-line heading (name over abbreviation), so the header has three levels; "All cases" and the level-2 column names span down to the body rule and are repeated in level 3, and the stub heading "Standard Federal Regions^2" is repeated in all three levels. The crop ends after the "Region IV" subtotal; the table continues (Regions V and beyond) on the following page, and no footnote text is printed on this image. Footnote marker 1 appears in the caption (excluded) and marker 2 on the stub heading, but the corresponding footnote texts are not on this crop. Every state row and every regional subtotal was checked against its printed components (CA+CB+CC+CD+CE+CG+CP = All C cases; RC+RM+RD = All R cases; All C + All R + UD + AC + UC = All cases; and each Region row equals the column sum of its states). All agree exactly as printed; no misprints detected and no doubtful cells.
p. 125. 17 columns: stub, "All cases", eight unfair-labor-practice columns (All C cases, CA, CB, CC, CD, CE, CG, CP), four representation columns (All R cases, RC, RM, RD), and UD, AC, UC. The header is three levels deep: "Unfair labor practice cases" and "Representation cases" span their groups at the top level, while "All cases" and the three right-hand headings ("Union deauthorization cases", "Amendment of certification cases", "Unit clarification cases") are tall headings repeated down the levels they span; UD/AC/UC sit in a third level under the last three. The crop is a continuation page covering only Regions V through VIII; earlier regions and any grand-total row fall outside it. The stub heading carries a superscript 2 marker ("Standard Federal Regions^2"), but no footnote text is printed on this crop, so `footnotes` is empty. All values were cross-checked arithmetically: every state row's C columns sum to its "All C cases", its R columns sum to "All R cases", and C + R + UD + AC + UC equals "All cases"; each Region subtotal equals the sum of its member states in every column. No discrepancies found, so no suspected misprints. No illegible or doubtful cells.
p. 126. The page is a "—Continued" portion of Table 6B: it carries the full column headings but the body starts mid-table with the States of Region IX; Regions I–VIII appear on the preceding pages. Seventeen printed columns: stub, "All cases", eight unfair-labor-practice columns (All C cases, CA, CB, CC, CD, CE, CG, CP), four representation columns (All R cases, RC, RM, RD), and the UD, AC and UC columns, whose code letters are printed on a third heading level under the tall spanning headings "Union deauthorization cases", "Amendment of certification cases" and "Unit clarification cases". The stub heading carries footnote marker 2 and the caption carries marker 1. All cells are clearly legible; every row and both region subtotals and the grand total add up internally (e.g. Region IX = 5,216 and 27,450 + 5,462 + 110 + 15 + 195 = 33,232), so no misprints are suspected.
Source image
Source data: U.S. NLRB Annual Reports (public domain). Reconstruction by NLRB Stats Archive. Read by claude-opus-5 (effort max, prompt extract_v1) from the 300-dpi scan; stitched by page. Updated October 2026.