NLRB Stats Archive › Annual Reports › FY1998 › Distribution of Unfair Labor Practice Situations Received, by Number of Employees in Establishments, Fiscal Year 1998
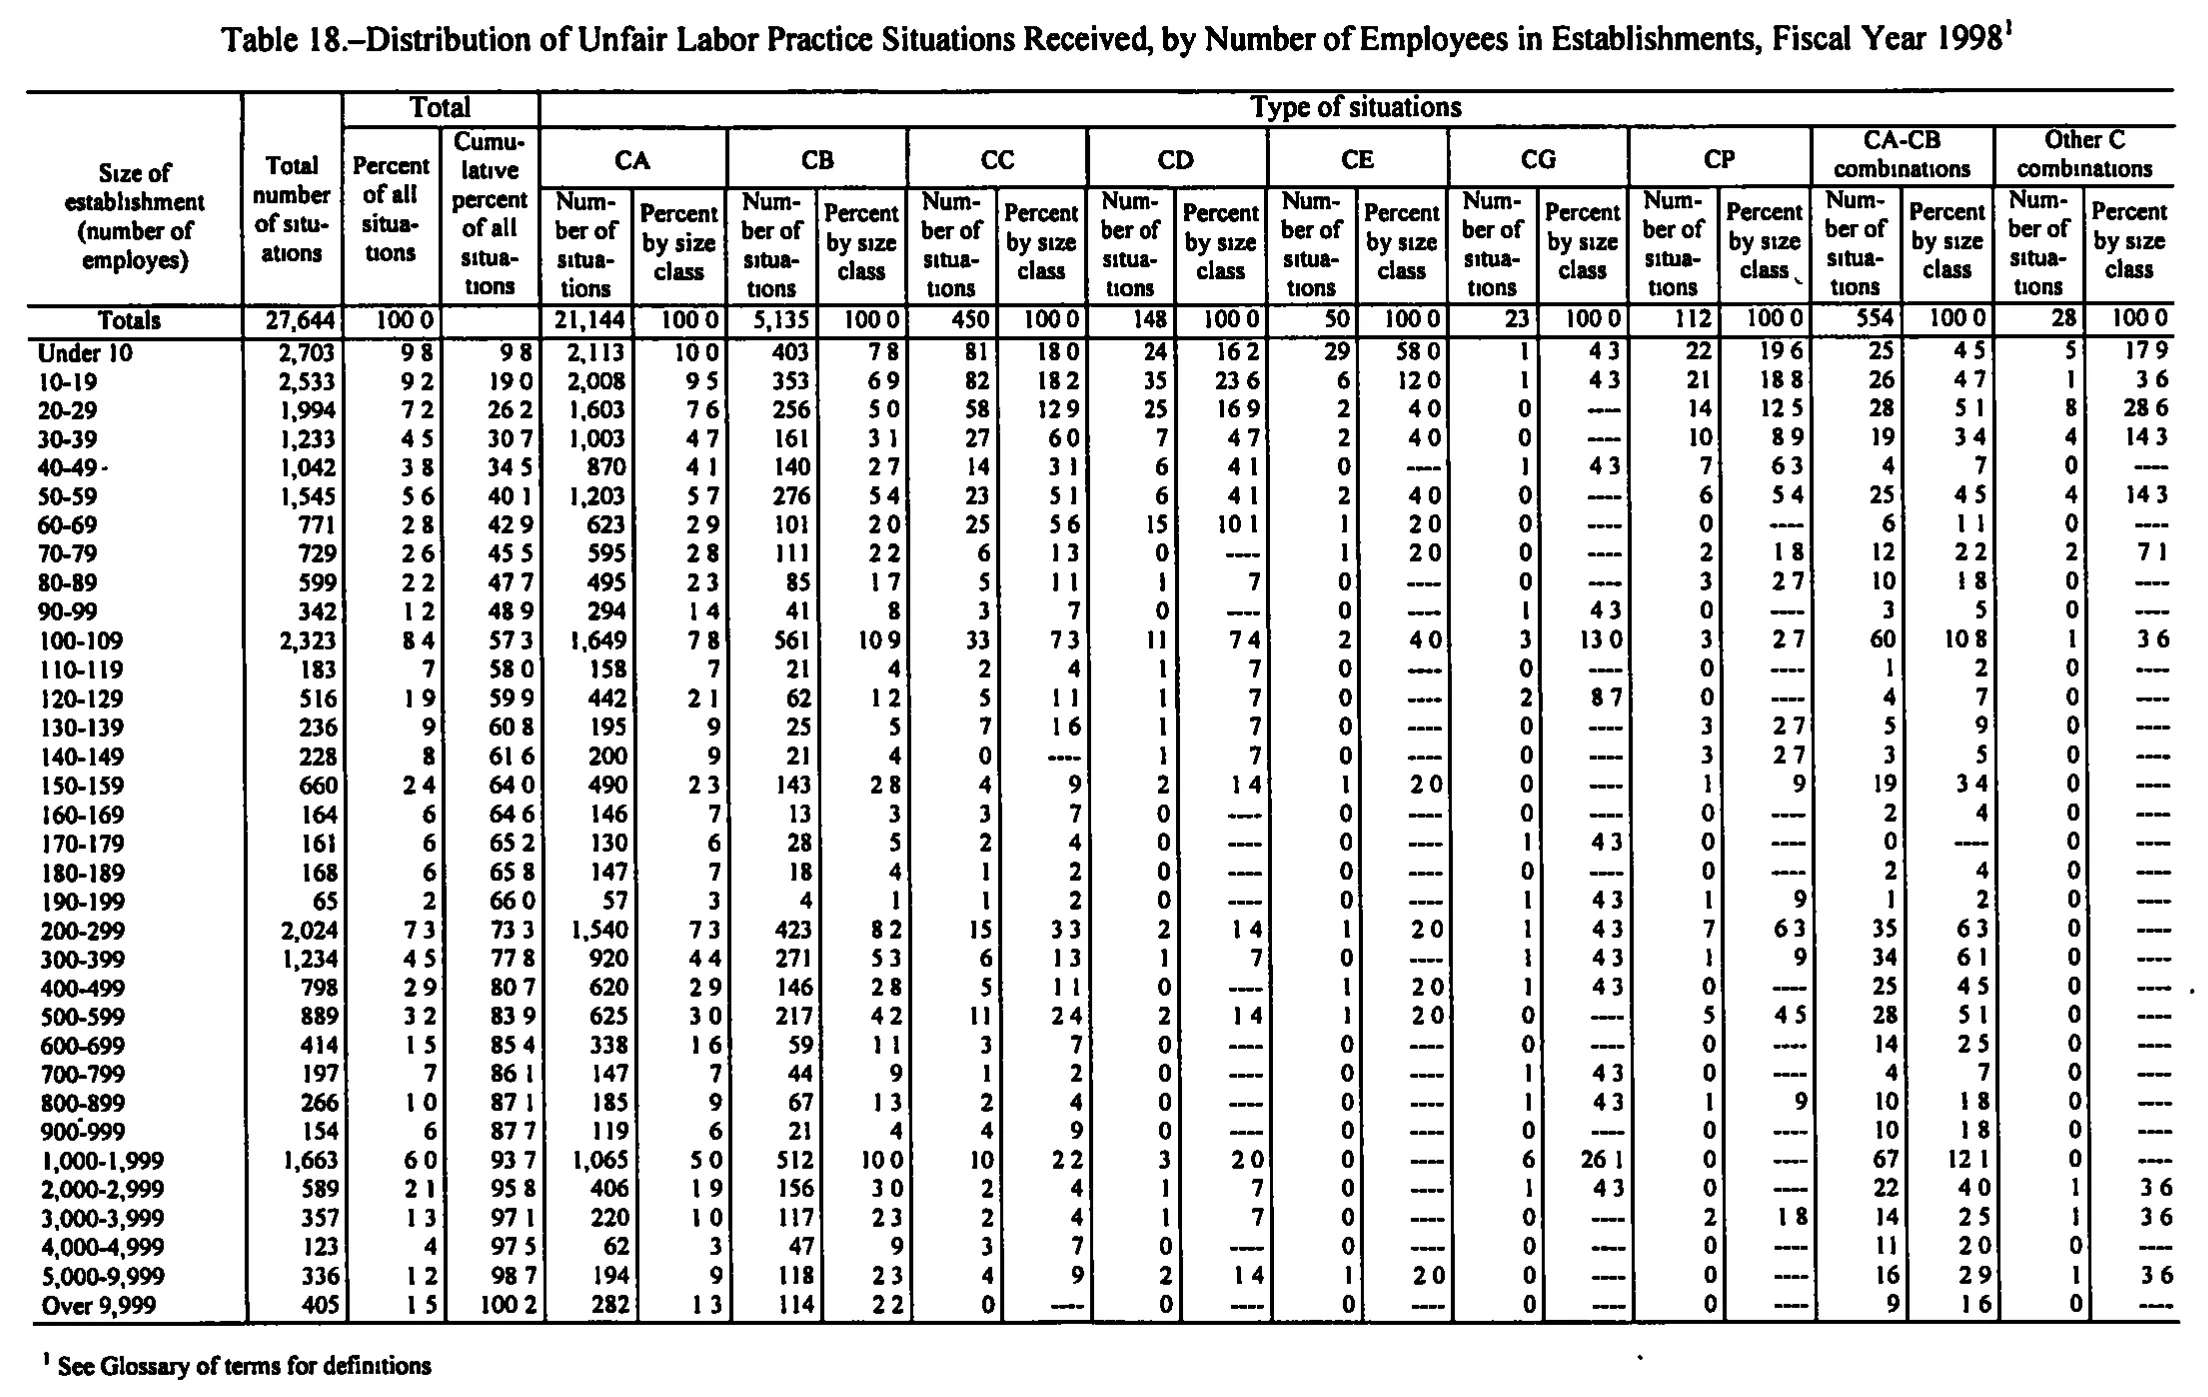
Distribution of Unfair Labor Practice Situations Received, by Number of Employees in Establishments, Fiscal Year 1998
| Size of establishment (number of employes) | Total number of situations | Total | Type of situations | ||||||||||||||||||
|---|---|---|---|---|---|---|---|---|---|---|---|---|---|---|---|---|---|---|---|---|---|
| Size of establishment (number of employes) | Total number of situations | Percent of all situations | Cumulative percent of all situations | CA | CB | CC | CD | CE | CG | CP | CA-CB combinations | Other C combinations | |||||||||
| Size of establishment (number of employes) | Total number of situations | Percent of all situations | Cumulative percent of all situations | Number of situations | Percent by size class | Number of situations | Percent by size class | Number of situations | Percent by size class | Number of situations | Percent by size class | Number of situations | Percent by size class | Number of situations | Percent by size class | Number of situations | Percent by size class | Number of situations | Percent by size class | Number of situations | Percent by size class |
| Totals | 27,644 | 100.0 | 21,144 | 100.0 | 5,135 | 100.0 | 450 | 100.0 | 148 | 100.0 | 50 | 100.0 | 23 | 100.0 | 112 | 100.0 | 554 | 100.0 | 28 | 100.0 | |
| Under 10 | 2,703 | 9.8 | 9.8 | 2,113 | 10.0 | 403 | 7.8 | 81 | 18.0 | 24 | 16.2 | 29 | 58.0 | 1 | 4.3 | 22 | 19.6 | 25 | 4.5 | 5 | 17.9 |
| 10-19 | 2,533 | 9.2 | 19.0 | 2,008 | 9.5 | 353 | 6.9 | 82 | 18.2 | 35 | 23.6 | 6 | 12.0 | 1 | 4.3 | 21 | 18.8 | 26 | 4.7 | 1 | 3.6 |
| 20-29 | 1,994 | 7.2 | 26.2 | 1,603 | 7.6 | 256 | 5.0 | 58 | 12.9 | 25 | 16.9 | 2 | 4.0 | 0 | 14 | 12.5 | 28 | 5.1 | 8 | 28.6 | |
| 30-39 | 1,233 | 4.5 | 30.7 | 1,003 | 4.7 | 161 | 3.1 | 27 | 6.0 | 7 | 4.7 | 2 | 4.0 | 0 | 10 | 8.9 | 19 | 3.4 | 4 | 14.3 | |
| 40-49 | 1,042 | 3.8 | 34.5 | 870 | 4.1 | 140 | 2.7 | 14 | 3.1 | 6 | 4.1 | 0 | 1 | 4.3 | 7 | 6.3 | 4 | .7 | 0 | ||
| 50-59 | 1,545 | 5.6 | 40.1 | 1,203 | 5.7 | 276 | 5.4 | 23 | 5.1 | 6 | 4.1 | 2 | 4.0 | 0 | 6 | 5.4 | 25 | 4.5 | 4 | 14.3 | |
| 60-69 | 771 | 2.8 | 42.9 | 623 | 2.9 | 101 | 2.0 | 25 | 5.6 | 15 | 10.1 | 1 | 2.0 | 0 | 0 | 6 | 1.1 | 0 | |||
| 70-79 | 729 | 2.6 | 45.5 | 595 | 2.8 | 111 | 2.2 | 6 | 1.3 | 0 | 1 | 2.0 | 0 | 2 | 1.8 | 12 | 2.2 | 2 | 7.1 | ||
| 80-89 | 599 | 2.2 | 47.7 | 495 | 2.3 | 85 | 1.7 | 5 | 1.1 | 1 | .7 | 0 | 0 | 3 | 2.7 | 10 | 1.8 | 0 | |||
| 90-99 | 342 | 1.2 | 48.9 | 294 | 1.4 | 41 | .8 | 3 | .7 | 0 | 0 | 1 | 4.3 | 0 | 3 | .5 | 0 | ||||
| 100-109 | 2,323 | 8.4 | 57.3 | 1,649 | 7.8 | 561 | 10.9 | 33 | 7.3 | 11 | 7.4 | 2 | 4.0 | 3 | 13.0 | 3 | 2.7 | 60 | 10.8 | 1 | 3.6 |
| 110-119 | 183 | .7 | 58.0 | 158 | .7 | 21 | .4 | 2 | .4 | 1 | .7 | 0 | 0 | 0 | 1 | .2 | 0 | ||||
| 120-129 | 516 | 1.9 | 59.9 | 442 | 2.1 | 62 | 1.2 | 5 | 1.1 | 1 | .7 | 0 | 2 | 8.7 | 0 | 4 | .7 | 0 | |||
| 130-139 | 236 | .9 | 60.8 | 195 | .9 | 25 | .5 | 7 | 1.6 | 1 | .7 | 0 | 0 | 3 | 2.7 | 5 | .9 | 0 | |||
| 140-149 | 228 | .8 | 61.6 | 200 | .9 | 21 | .4 | 0 | 1 | .7 | 0 | 0 | 3 | 2.7 | 3 | .5 | 0 | ||||
| 150-159 | 660 | 2.4 | 64.0 | 490 | 2.3 | 143 | 2.8 | 4 | .9 | 2 | 1.4 | 1 | 2.0 | 0 | 1 | .9 | 19 | 3.4 | 0 | ||
| 160-169 | 164 | .6 | 64.6 | 146 | .7 | 13 | .3 | 3 | .7 | 0 | 0 | 0 | 0 | 2 | .4 | 0 | |||||
| 170-179 | 161 | .6 | 65.2 | 130 | .6 | 28 | .5 | 2 | .4 | 0 | 0 | 1 | 4.3 | 0 | 0 | 0 | |||||
| 180-189 | 168 | .6 | 65.8 | 147 | .7 | 18 | .4 | 1 | .2 | 0 | 0 | 0 | 0 | 2 | .4 | 0 | |||||
| 190-199 | 65 | .2 | 66.0 | 57 | .3 | 4 | .1 | 1 | .2 | 0 | 0 | 1 | 4.3 | 1 | .9 | 1 | .2 | 0 | |||
| 200-299 | 2,024 | 7.3 | 73.3 | 1,540 | 7.3 | 423 | 8.2 | 15 | 3.3 | 2 | 1.4 | 1 | 2.0 | 1 | 4.3 | 7 | 6.3 | 35 | 6.3 | 0 | |
| 300-399 | 1,234 | 4.5 | 77.8 | 920 | 4.4 | 271 | 5.3 | 6 | 1.3 | 1 | .7 | 0 | 1 | 4.3 | 1 | .9 | 34 | 6.1 | 0 | ||
| 400-499 | 798 | 2.9 | 80.7 | 620 | 2.9 | 146 | 2.8 | 5 | 1.1 | 0 | 1 | 2.0 | 1 | 4.3 | 0 | 25 | 4.5 | 0 | |||
| 500-599 | 889 | 3.2 | 83.9 | 625 | 3.0 | 217 | 4.2 | 11 | 2.4 | 2 | 1.4 | 1 | 2.0 | 0 | 5 | 4.5 | 28 | 5.1 | 0 | ||
| 600-699 | 414 | 1.5 | 85.4 | 338 | 1.6 | 59 | 1.1 | 3 | .7 | 0 | 0 | 0 | 0 | 14 | 2.5 | 0 | |||||
| 700-799 | 197 | .7 | 86.1 | 147 | .7 | 44 | .9 | 1 | .2 | 0 | 0 | 1 | 4.3 | 0 | 4 | .7 | 0 | ||||
| 800-899 | 266 | 1.0 | 87.1 | 185 | .9 | 67 | 1.3 | 2 | .4 | 0 | 0 | 1 | 4.3 | 1 | .9 | 10 | 1.8 | 0 | |||
| 900-999 | 154 | .6 | 87.7 | 119 | .6 | 21 | .4 | 4 | .9 | 0 | 0 | 0 | 0 | 10 | 1.8 | 0 | |||||
| 1,000-1,999 | 1,663 | 6.0 | 93.7 | 1,065 | 5.0 | 512 | 10.0 | 10 | 2.2 | 3 | 2.0 | 0 | 6 | 26.1 | 0 | 67 | 12.1 | 0 | |||
| 2,000-2,999 | 589 | 2.1 | 95.8 | 406 | 1.9 | 156 | 3.0 | 2 | .4 | 1 | .7 | 0 | 1 | 4.3 | 0 | 22 | 4.0 | 1 | 3.6 | ||
| 3,000-3,999 | 357 | 1.3 | 97.1 | 220 | 1.0 | 117 | 2.3 | 2 | .4 | 1 | .7 | 0 | 0 | 2 | 1.8 | 14 | 2.5 | 1 | 3.6 | ||
| 4,000-4,999 | 123 | .4 | 97.5 | 62 | .3 | 47 | .9 | 3 | .7 | 0 | 0 | 0 | 0 | 11 | 2.0 | 0 | |||||
| 5,000-9,999 | 336 | 1.2 | 98.7 | 194 | .9 | 118 | 2.3 | 4 | .9 | 2 | 1.4 | 1 | 2.0 | 0 | 0 | 16 | 2.9 | 1 | 3.6 | ||
| Over 9,999 | 405 | 1.5 | 100.2 | 282 | 1.3 | 114 | 2.2 | 0 | 0 | 0 | 0 | 0 | 9 | 1.6 | 0 | ||||||
- 1 See Glossary of terms for definitions
254 of 254 figures sit in a row or column sum that works out.
Reader’s notes
p. 191. 22 columns: stub, Total number of situations, two Total-group percent columns, then Number/Percent pairs for CA, CB, CC, CD, CE, CG, CP, CA-CB combinations, Other C combinations. Decimal points: this is a 1-bit scan in which the periods in the percent columns are largely lost, so values print on the image as e.g. "100 0", "9 8", "16 2". They are decimal percentages and have been transcribed with the decimal point restored ("100.0", "9.8", "16.2"). Values below 1 percent are printed without a leading zero and are given as ".7", ".4", etc. No digits were altered. Dash rules: cells showing a short dash rule ("----"), used for a zero-denominator percent, are given as "". The accompanying count cell in those positions is a printed "0" and is kept as "0". Arithmetic cross-checks (all consistent, no misprints found in the body): each row's nine type-of-situation counts sum exactly to its "Total number of situations"; each type column sums exactly to its printed total (CA 21,144; CB 5,135; CC 450; CD 148; CE 50; CG 23; CP 112; CA-CB 554; Other C 28), and those nine sum to the printed grand total 27,644. Cumulative percent: the last row ("Over 9,999") prints 100.2, above 100, the accumulation of rounding in the column. Transcribed as printed. Stub heading: printed as "Size of establishment (number of employes)" — the final word reads as the one-"e" form "employes" at this scan quality, but "employees" cannot be fully ruled out. Minor marks: the "40-49" row label is followed by a small stray ink mark, and a stray mark sits above the "900-999" label; neither is a footnote marker and both are omitted. A stray mark also appears in the right margin beside the "400-499" row, outside the table rules. The Totals row has no entry in the "Cumulative percent of all situations" column (blank in print).
Source image
Source data: U.S. NLRB Annual Reports (public domain). Reconstruction by NLRB Stats Archive. Read by claude-opus-5 (effort max, prompt extract_v1) from the 300-dpi scan; stitched by page. Updated October 2026.