NLRB Stats Archive › Annual Reports › FY1998 › Size of Units in Representation Elections in Cases Closed, Fiscal Year 1998
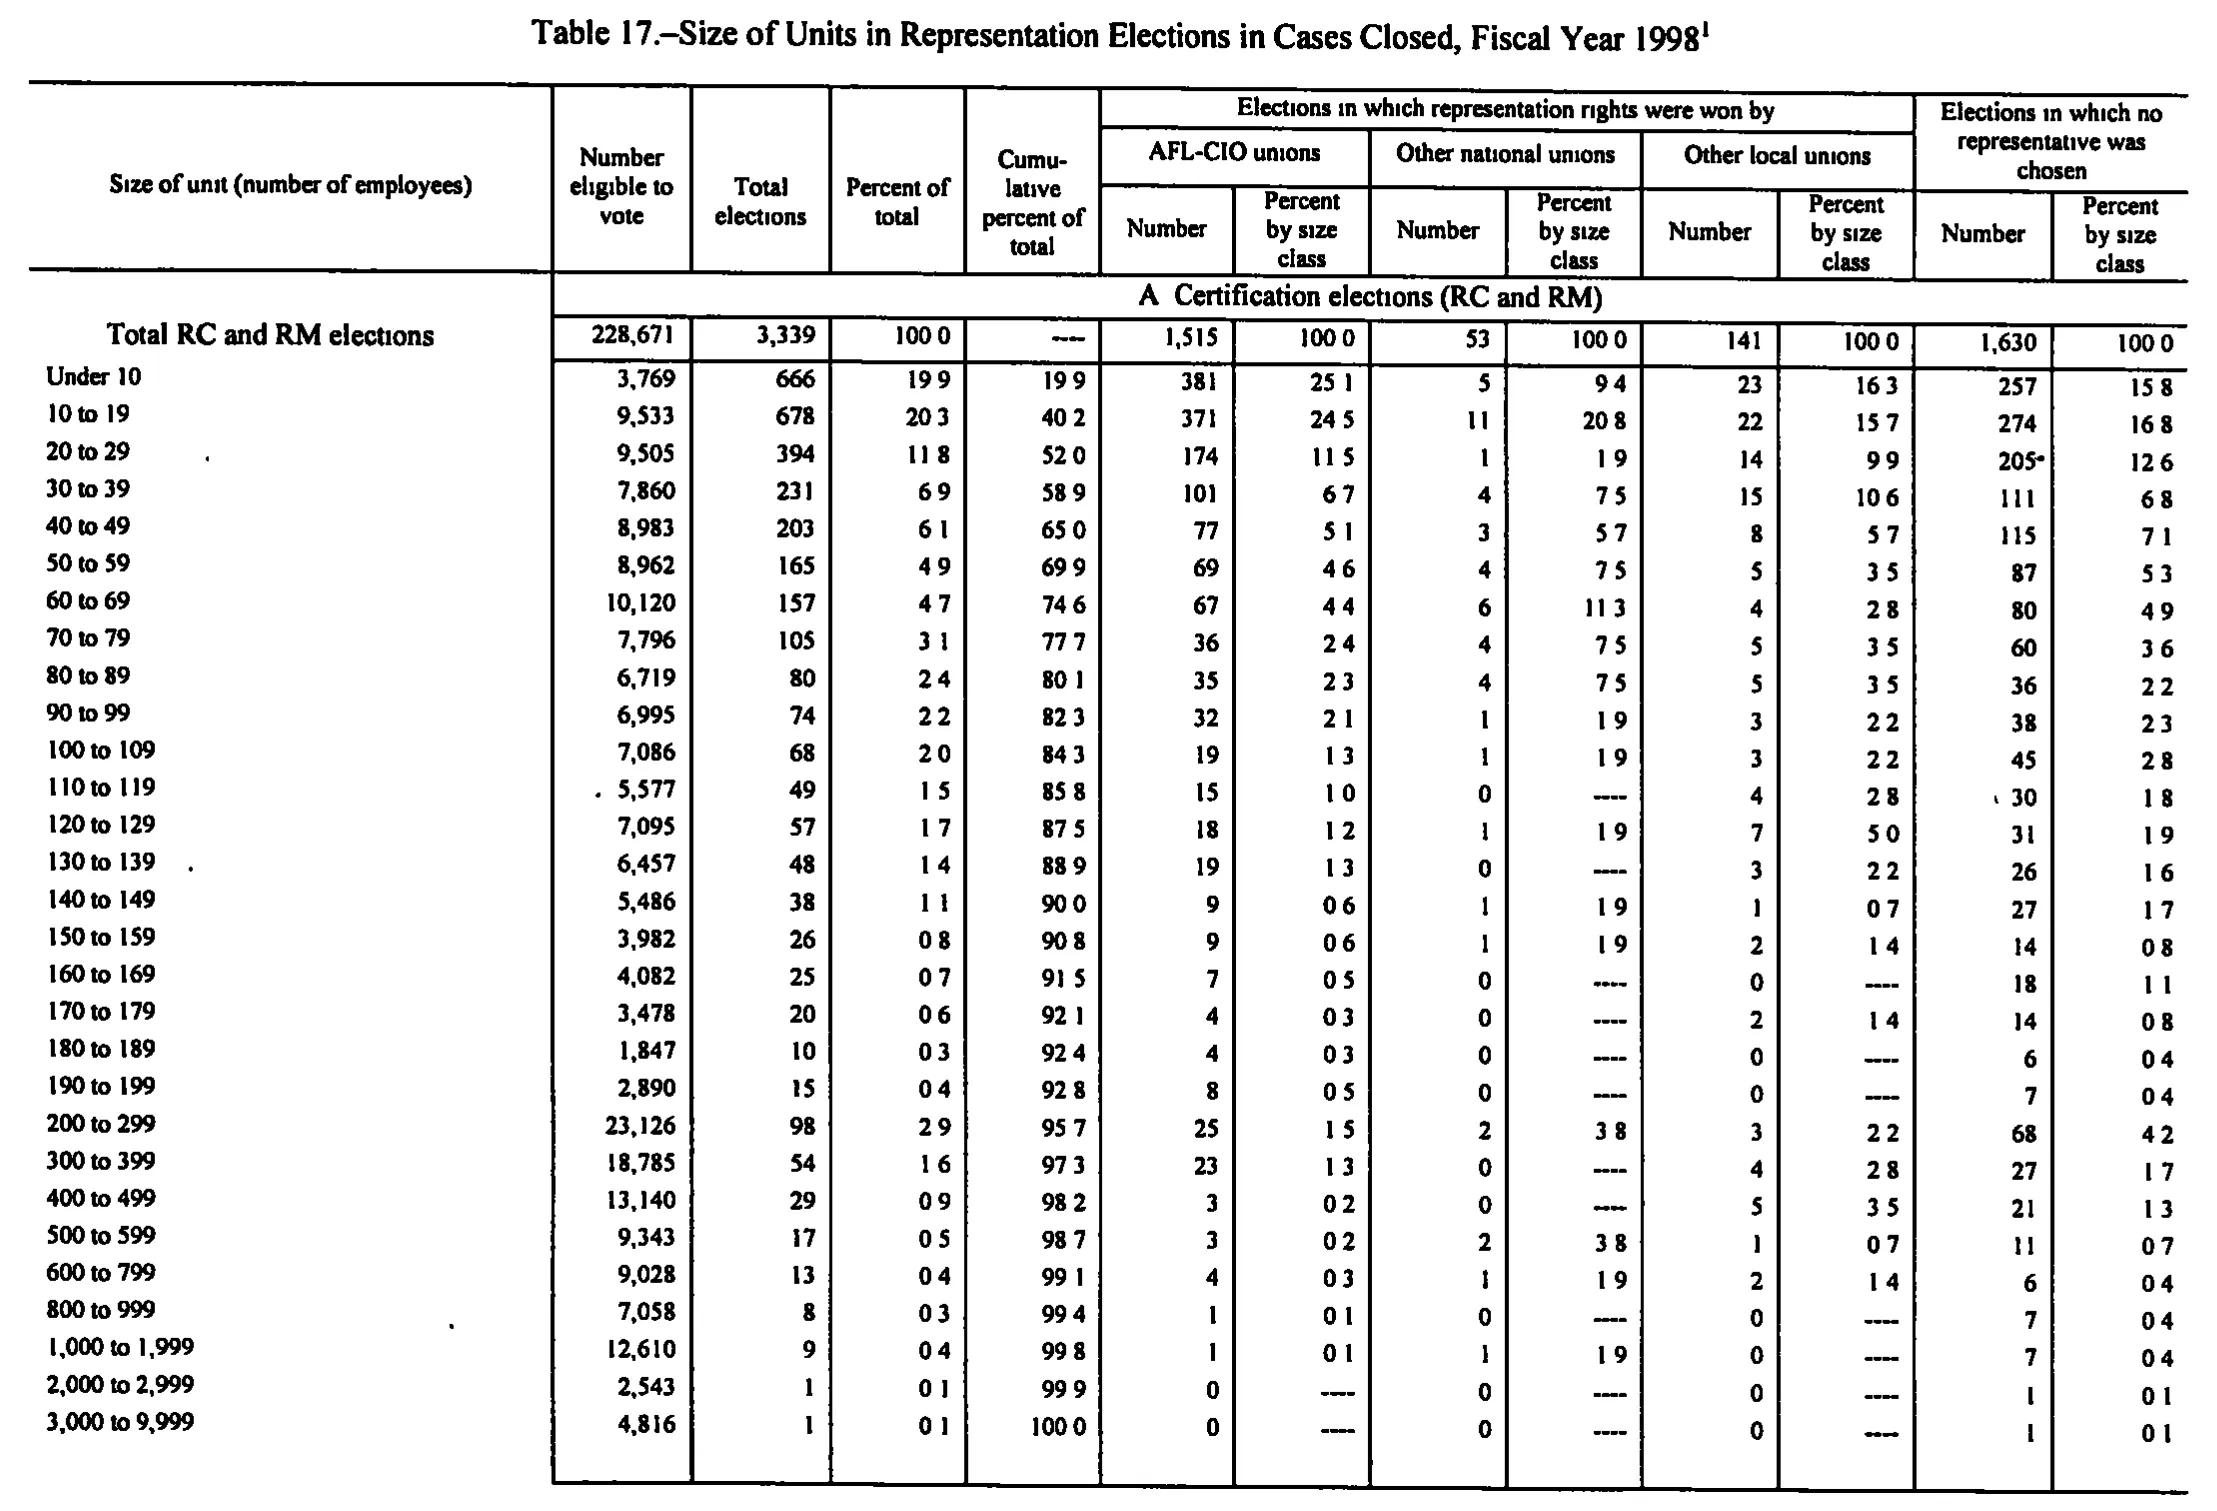
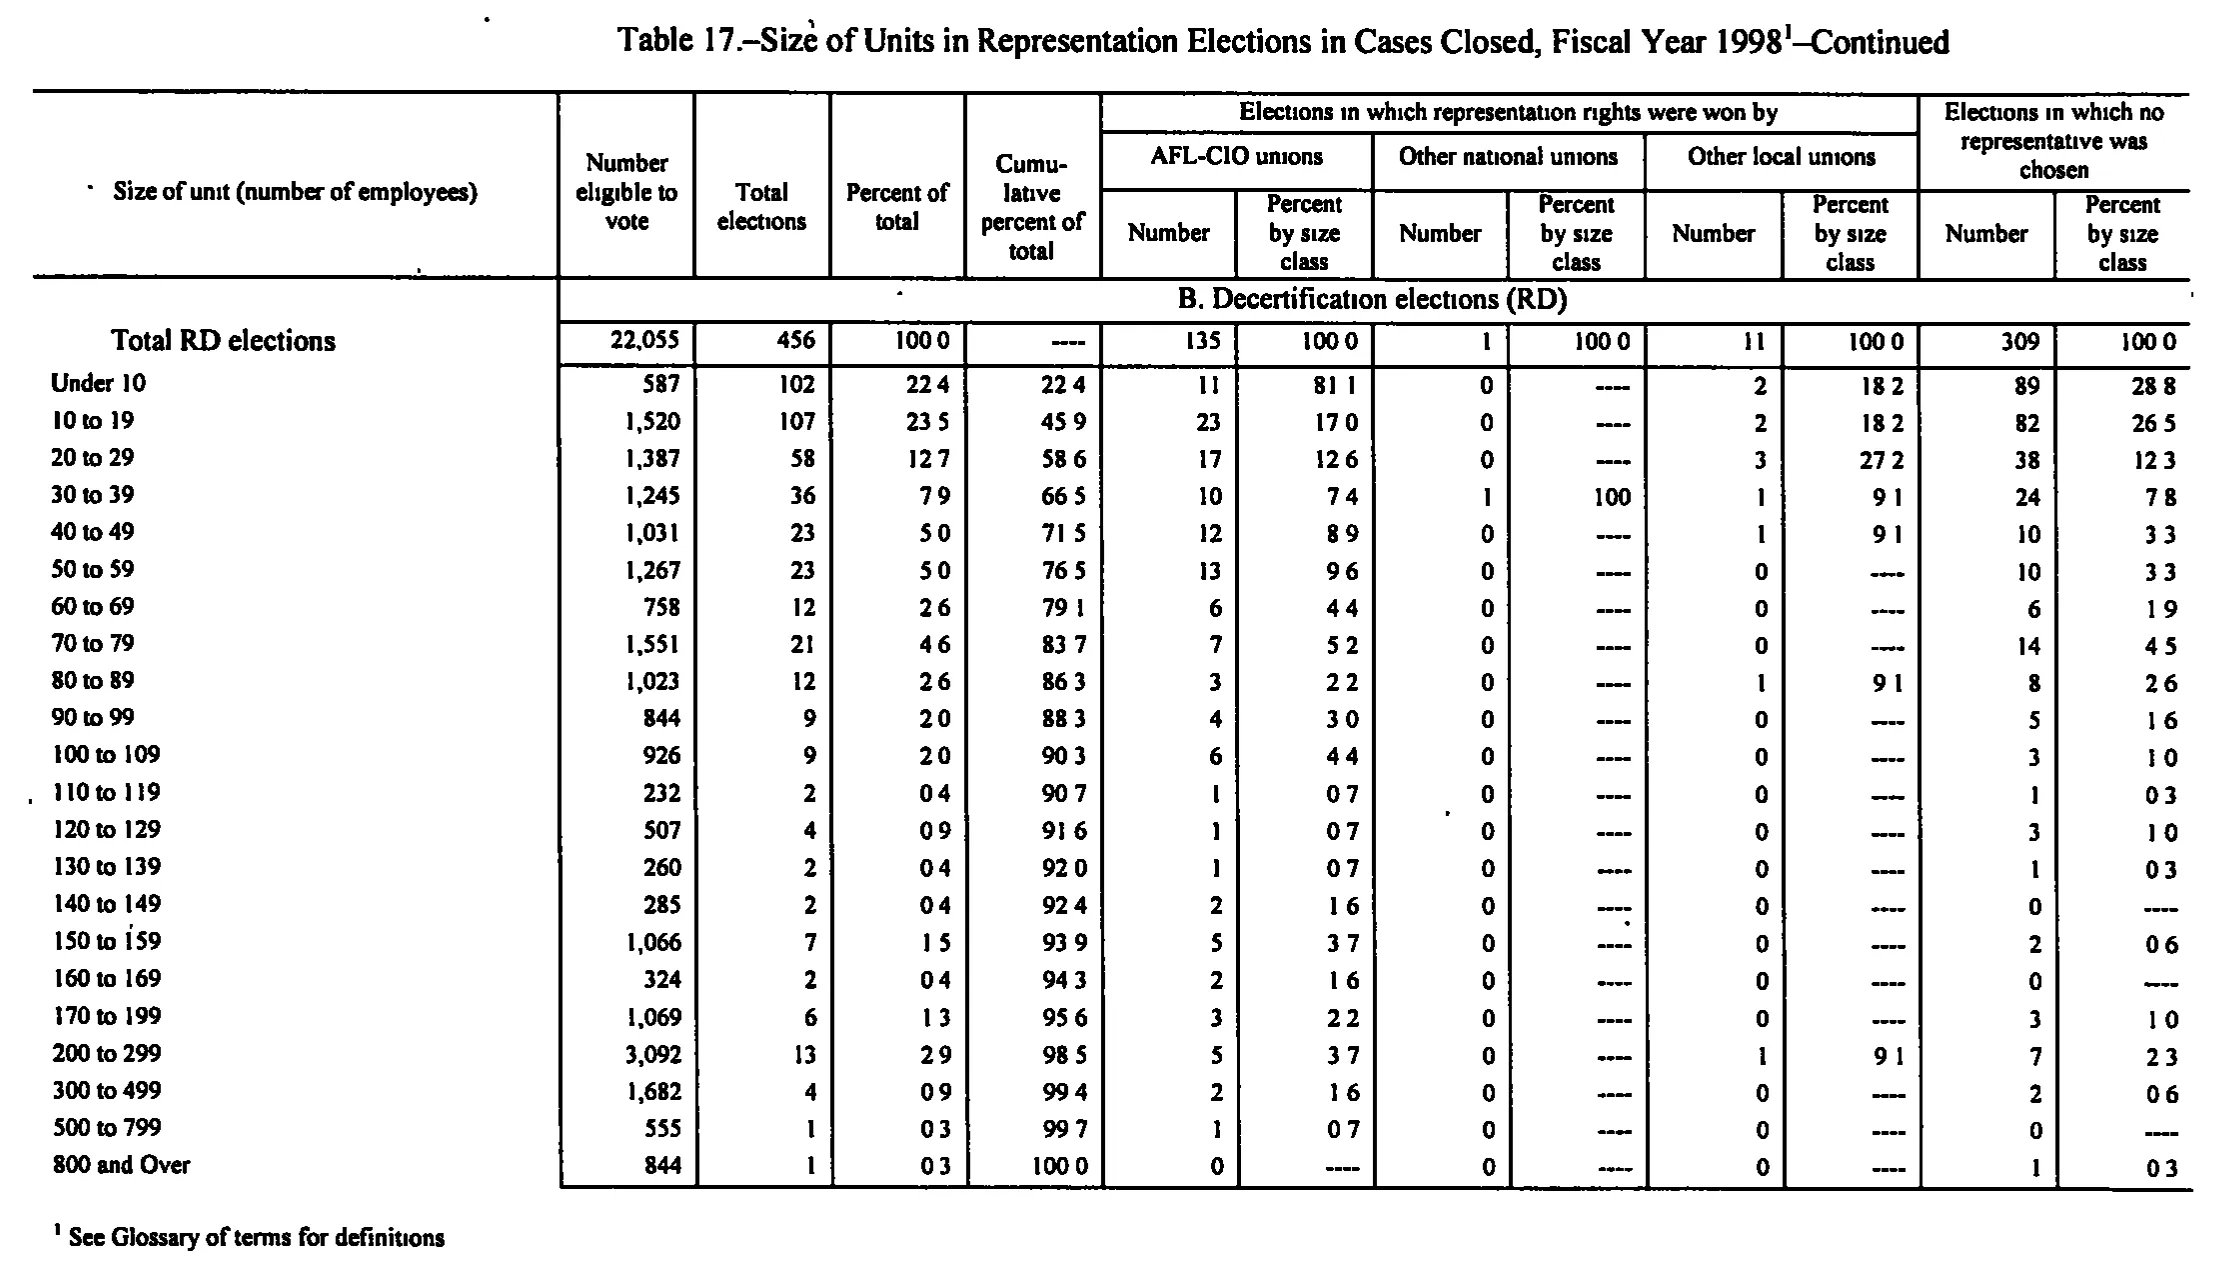
Size of Units in Representation Elections in Cases Closed, Fiscal Year 1998
Stitched from pp. 189–190.
| Size of unit (number of employees) | Number eligible to vote | Total elections | Percent of total | Cumulative percent of total | Elections in which representation rights were won by | Elections in which no representative was chosen | ||||||
|---|---|---|---|---|---|---|---|---|---|---|---|---|
| Size of unit (number of employees) | Number eligible to vote | Total elections | Percent of total | Cumulative percent of total | AFL-CIO unions | Other national unions | Other local unions | Elections in which no representative was chosen | ||||
| Size of unit (number of employees) | Number eligible to vote | Total elections | Percent of total | Cumulative percent of total | Number | Percent by size class | Number | Percent by size class | Number | Percent by size class | Number | Percent by size class |
| A. Certification elections (RC and RM) | ||||||||||||
| Total RC and RM elections | 228,671 | 3,339 | 100.0 | 1,515 | 100.0 | 53 | 100.0 | 141 | 100.0 | 1,630 | 100.0 | |
| Under 10 | 3,769 | 666 | 19.9 | 19.9 | 381 | 25.1 | 5 | 9.4 | 23 | 16.3 | 257 | 15.8 |
| 10 to 19 | 9,533 | 678 | 20.3 | 40.2 | 371 | 24.5 | 11 | 20.8 | 22 | 15.7 | 274 | 16.8 |
| 20 to 29 | 9,505 | 394 | 11.8 | 52.0 | 174 | 11.5 | 1 | 1.9 | 14 | 9.9 | 205 | 12.6 |
| 30 to 39 | 7,860 | 231 | 6.9 | 58.9 | 101 | 6.7 | 4 | 7.5 | 15 | 10.6 | 111 | 6.8 |
| 40 to 49 | 8,983 | 203 | 6.1 | 65.0 | 77 | 5.1 | 3 | 5.7 | 8 | 5.7 | 115 | 7.1 |
| 50 to 59 | 8,962 | 165 | 4.9 | 69.9 | 69 | 4.6 | 4 | 7.5 | 5 | 3.5 | 87 | 5.3 |
| 60 to 69 | 10,120 | 157 | 4.7 | 74.6 | 67 | 4.4 | 6 | 11.3 | 4 | 2.8 | 80 | 4.9 |
| 70 to 79 | 7,796 | 105 | 3.1 | 77.7 | 36 | 2.4 | 4 | 7.5 | 5 | 3.5 | 60 | 3.6 |
| 80 to 89 | 6,719 | 80 | 2.4 | 80.1 | 35 | 2.3 | 4 | 7.5 | 5 | 3.5 | 36 | 2.2 |
| 90 to 99 | 6,995 | 74 | 2.2 | 82.3 | 32 | 2.1 | 1 | 1.9 | 3 | 2.2 | 38 | 2.3 |
| 100 to 109 | 7,086 | 68 | 2.0 | 84.3 | 19 | 1.3 | 1 | 1.9 | 3 | 2.2 | 45 | 2.8 |
| 110 to 119 | 5,577 | 49 | 1.5 | 85.8 | 15 | 1.0 | 0 | 4 | 2.8 | 30 | 1.8 | |
| 120 to 129 | 7,095 | 57 | 1.7 | 87.5 | 18 | 1.2 | 1 | 1.9 | 7 | 5.0 | 31 | 1.9 |
| 130 to 139 | 6,457 | 48 | 1.4 | 88.9 | 19 | 1.3 | 0 | 3 | 2.2 | 26 | 1.6 | |
| 140 to 149 | 5,486 | 38 | 1.1 | 90.0 | 9 | 0.6 | 1 | 1.9 | 1 | 0.7 | 27 | 1.7 |
| 150 to 159 | 3,982 | 26 | 0.8 | 90.8 | 9 | 0.6 | 1 | 1.9 | 2 | 1.4 | 14 | 0.8 |
| 160 to 169 | 4,082 | 25 | 0.7 | 91.5 | 7 | 0.5 | 0 | 0 | 18 | 1.1 | ||
| 170 to 179 | 3,478 | 20 | 0.6 | 92.1 | 4 | 0.3 | 0 | 2 | 1.4 | 14 | 0.8 | |
| 180 to 189 | 1,847 | 10 | 0.3 | 92.4 | 4 | 0.3 | 0 | 0 | 6 | 0.4 | ||
| 190 to 199 | 2,890 | 15 | 0.4 | 92.8 | 8 | 0.5 | 0 | 0 | 7 | 0.4 | ||
| 200 to 299 | 23,126 | 98 | 2.9 | 95.7 | 25 | 1.5 | 2 | 3.8 | 3 | 2.2 | 68 | 4.2 |
| 300 to 399 | 18,785 | 54 | 1.6 | 97.3 | 23 | 1.3 | 0 | 4 | 2.8 | 27 | 1.7 | |
| 400 to 499 | 13,140 | 29 | 0.9 | 98.2 | 3 | 0.2 | 0 | 5 | 3.5 | 21 | 1.3 | |
| 500 to 599 | 9,343 | 17 | 0.5 | 98.7 | 3 | 0.2 | 2 | 3.8 | 1 | 0.7 | 11 | 0.7 |
| 600 to 799 | 9,028 | 13 | 0.4 | 99.1 | 4 | 0.3 | 1 | 1.9 | 2 | 1.4 | 6 | 0.4 |
| 800 to 999 | 7,058 | 8 | 0.3 | 99.4 | 1 | 0.1 | 0 | 0 | 7 | 0.4 | ||
| 1,000 to 1,999 | 12,610 | 9 | 0.4 | 99.8 | 1 | 0.1 | 1 | 1.9 | 0 | 7 | 0.4 | |
| 2,000 to 2,999 | 2,543 | 1 | 0.1 | 99.9 | 0 | 0 | 0 | 1 | 0.1 | |||
| 3,000 to 9,999 | 4,816 | 1 | 0.1 | 100.0 | 0 | 0 | 0 | 1 | 0.1 | |||
| B. Decertification elections (RD) | ||||||||||||
| Total RD elections | 22,055 | 456 | 100.0 | 135 | 100.0 | 1 | 100.0 | 11 | 100.0 | 309 | 100.0 | |
| Under 10 | 587 | 102 | 22.4 | 22.4 | 11 | 81.1 | 0 | 2 | 18.2 | 89 | 28.8 | |
| 10 to 19 | 1,520 | 107 | 23.5 | 45.9 | 23 | 17.0 | 0 | 2 | 18.2 | 82 | 26.5 | |
| 20 to 29 | 1,387 | 58 | 12.7 | 58.6 | 17 | 12.6 | 0 | 3 | 27.2 | 38 | 12.3 | |
| 30 to 39 | 1,245 | 36 | 7.9 | 66.5 | 10 | 7.4 | 1 | 100 | 1 | 9.1 | 24 | 7.8 |
| 40 to 49 | 1,031 | 23 | 5.0 | 71.5 | 12 | 8.9 | 0 | 1 | 9.1 | 10 | 3.3 | |
| 50 to 59 | 1,267 | 23 | 5.0 | 76.5 | 13 | 9.6 | 0 | 0 | 10 | 3.3 | ||
| 60 to 69 | 758 | 12 | 2.6 | 79.1 | 6 | 4.4 | 0 | 0 | 6 | 1.9 | ||
| 70 to 79 | 1,551 | 21 | 4.6 | 83.7 | 7 | 5.2 | 0 | 0 | 14 | 4.5 | ||
| 80 to 89 | 1,023 | 12 | 2.6 | 86.3 | 3 | 2.2 | 0 | 1 | 9.1 | 8 | 2.6 | |
| 90 to 99 | 844 | 9 | 2.0 | 88.3 | 4 | 3.0 | 0 | 0 | 5 | 1.6 | ||
| 100 to 109 | 926 | 9 | 2.0 | 90.3 | 6 | 4.4 | 0 | 0 | 3 | 1.0 | ||
| 110 to 119 | 232 | 2 | 0.4 | 90.7 | 1 | 0.7 | 0 | 0 | 1 | 0.3 | ||
| 120 to 129 | 507 | 4 | 0.9 | 91.6 | 1 | 0.7 | 0 | 0 | 3 | 1.0 | ||
| 130 to 139 | 260 | 2 | 0.4 | 92.0 | 1 | 0.7 | 0 | 0 | 1 | 0.3 | ||
| 140 to 149 | 285 | 2 | 0.4 | 92.4 | 2 | 1.6 | 0 | 0 | 0 | |||
| 150 to 159 | 1,066 | 7 | 1.5 | 93.9 | 5 | 3.7 | 0 | 0 | 2 | 0.6 | ||
| 160 to 169 | 324 | 2 | 0.4 | 94.3 | 2 | 1.6 | 0 | 0 | 0 | |||
| 170 to 199 | 1,069 | 6 | 1.3 | 95.6 | 3 | 2.2 | 0 | 0 | 3 | 1.0 | ||
| 200 to 299 | 3,092 | 13 | 2.9 | 98.5 | 5 | 3.7 | 0 | 1 | 9.1 | 7 | 2.3 | |
| 300 to 499 | 1,682 | 4 | 0.9 | 99.4 | 2 | 1.6 | 0 | 0 | 2 | 0.6 | ||
| 500 to 799 | 555 | 1 | 0.3 | 99.7 | 1 | 0.7 | 0 | 0 | 0 | |||
| 800 and Over | 844 | 1 | 0.3 | 100.0 | 0 | 0 | 0 | 1 | 0.3 | |||
- 1 See Glossary of terms for definitions
258 of 258 figures sit in a row or column sum that works out.
Reader’s notes
p. 189. 13 columns: stub + 4 single columns + 3 two-column union blocks under "Elections in which representation rights were won by" + a two-column block for "Elections in which no representative was chosen" (that heading is tall, spanning the top two heading levels). Decimal points: this scan drops nearly every period, so the percent columns print as "100 0", "19 9", "0 6", etc. The decimal point is clearly present in the original typesetting (666/3,339 = 19.9 percent, 5/53 = 9.4 percent, and so on), so I have written these cells with decimal points ("19.9", "0.6"). For the same reason I restored the period in the section label "A. Certification elections (RC and RM)"; on the image only "A" followed by a gap is legible. Dash rules: the cumulative-percent cell of the "Total RC and RM elections" row and every "----" in the percent-by-size-class columns (where the matching count is 0) are rendered as empty cells per the dash-rule convention. "20 to 29", column "Elections in which no representative was chosen / Number": printed as 205 with a small speck immediately after it; I read the value as 205 and treat the mark as scan dirt, not a footnote marker. Similar stray specks sit in the stub margin beside "20 to 29", "110 to 119", "130 to 139" and "800 to 999", and before the 5,577 in "110 to 119" and the 30 in "110 to 119"; none of them are footnote markers. Arithmetic check: in every data row the four count columns (AFL-CIO, other national, other local, no representative) sum exactly to the "Total elections" figure, and all five count columns plus "Number eligible to vote" sum exactly to the printed totals row (228,671 / 3,339 / 1,515 / 53 / 141 / 1,630). No misprints detected. Crop coverage: only panel A is on this page. The caption carries a superscript 1, but no footnote text is printed inside the crop, so `footnotes` is empty; the footnote text and the panel B section (decertification elections) must be on a following page.
p. 190. Decimal points: the scan has dropped nearly every decimal point in this table, so the percent cells print as e.g. \"22 4\", \"100 0\", \"9 1\". These are one-decimal percentages and I have restored the point (22.4, 100.0, 9.1). The restoration is confirmed by the cumulative column, which is the exact running sum of the one-decimal \"Percent of total\" values (22.4, 45.9, 58.6, ... 99.7, 100.0).\n\nDoubtful cell, row \"Under 10\", column \"AFL-CIO unions / Percent by size class\": the cell reads as three digits, i.e. 81.1, and its left edge aligns with the other three-digit values (17.0, 12.6) rather than the two-digit ones (7.4, 8.9). Transcribed as printed. It is almost certainly wrong or a scan artifact: the entry is 11 of the column total of 135, which is 8.1, and the column sums to exactly 100.0 only if this cell is 8.1. A stray vertical speck read as a \"1\" cannot be ruled out at this resolution.\n\nRow \"30 to 39\", column \"Other national unions / Percent by size class\": printed as \"100\" with no decimal, shorter than and right-aligned against the \"100.0\" of the Total row in the same column. Transcribed as \"100\"; it could be a \"100.0\" whose final digit failed to print.\n\nDash rules (\"----\") standing for no entry are rendered as empty cells: Total row cumulative percent; Other national percent for every size class except 30 to 39; Other local percent for the classes with 0 elections; the no-representative percent for 140 to 149, 160 to 169 and 500 to 799; and the AFL-CIO percent for 800 and Over.\n\n\"B. Decertification elections (RD)\" is a banner printed across the data columns above the Total row; it is carried as a label-only row. The crop is the continuation page of Table 17 and holds panel B only; panel A (RC/RM elections) is on the preceding page.\n\nTypesetter rounding in the source is loose in places and is left as printed: in the AFL-CIO percent column 2 of 135 prints as 1.6 (not 1.5) three times, and in the no-representative column 10 of 309 prints as 3.3 (not 3.2) twice; 3 of 11 prints as 27.2 (not 27.3). Each of those choices is what makes its column total 100.0 as printed.
Source image
Source data: U.S. NLRB Annual Reports (public domain). Reconstruction by NLRB Stats Archive. Read by claude-opus-5 (effort max, prompt extract_v1) from the 300-dpi scan; stitched by page. Updated October 2026.