NLRB Stats Archive › Annual Reports › FY1997 › Proceedings Decided by Circuit Courts of Appeals on Petitions for Enforcement and/or Review of Board Orders, Fiscal Year 1997, Compared With 5-Year Cumulative Totals, Fiscal Years 1992 Through 1996
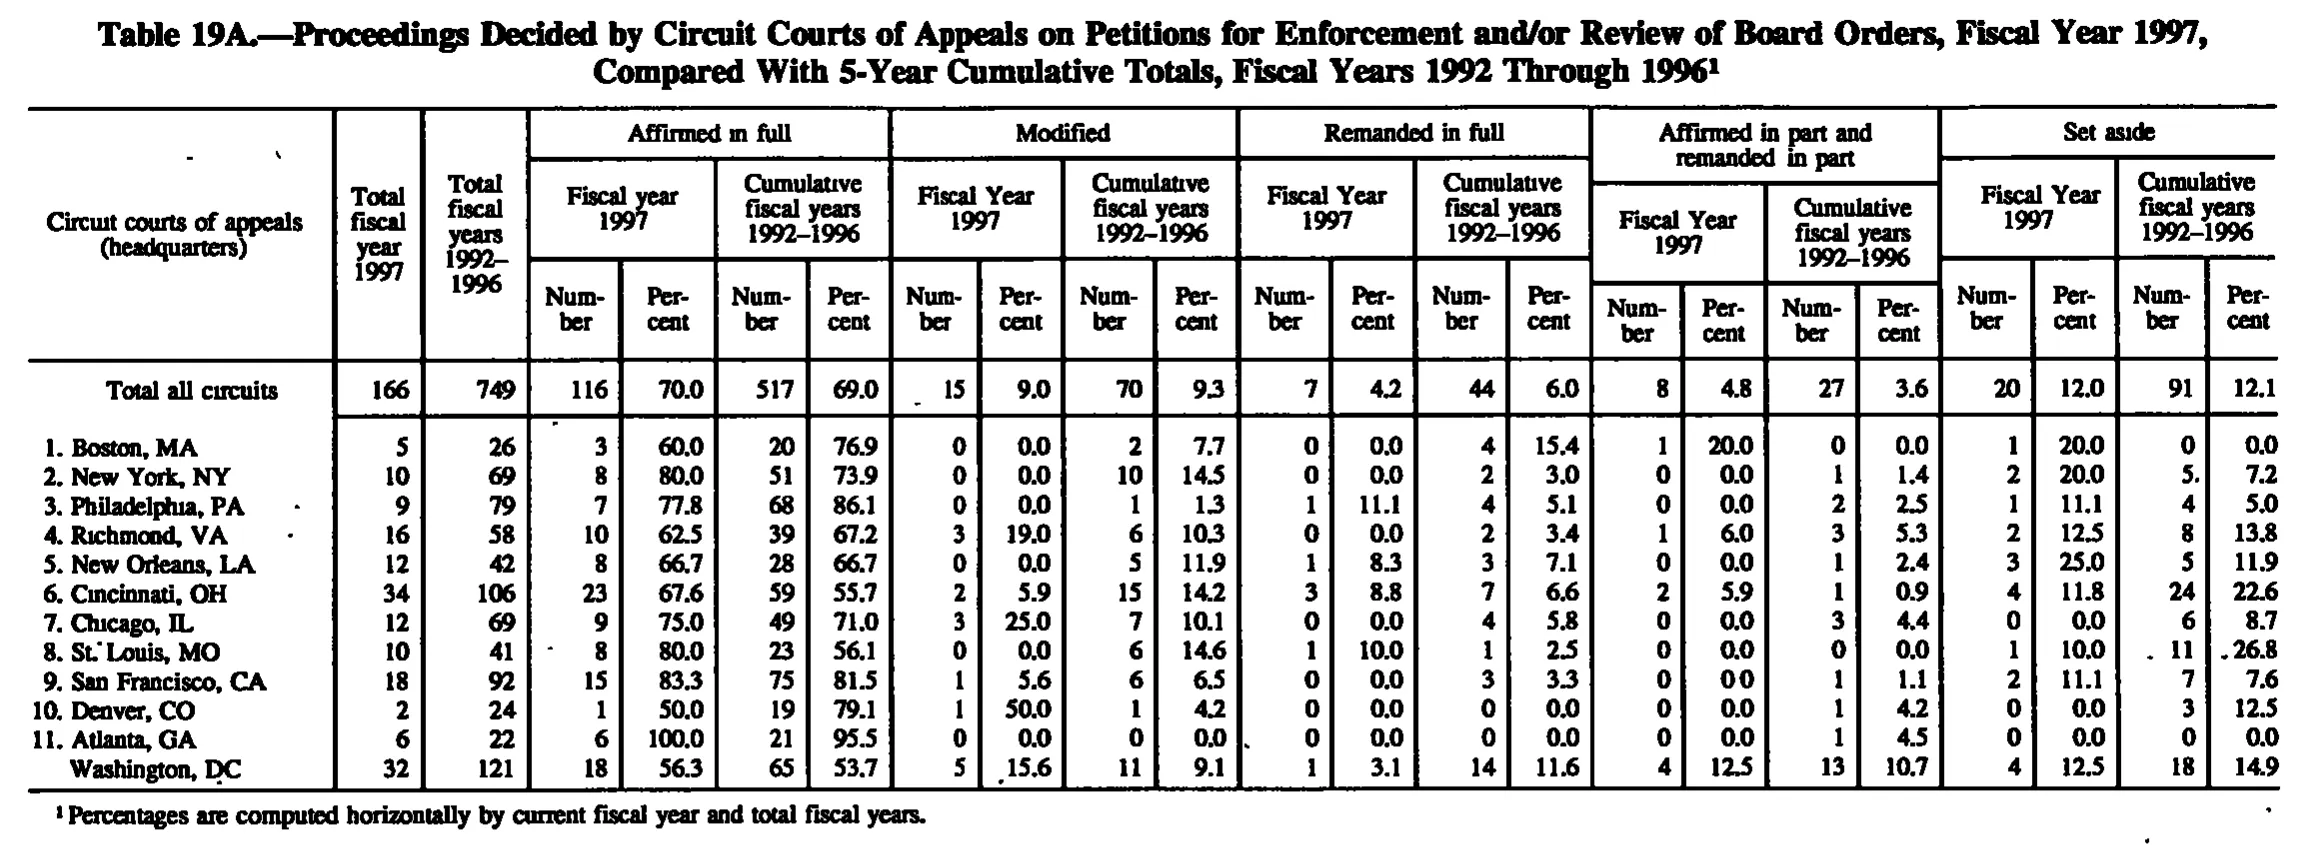
Proceedings Decided by Circuit Courts of Appeals on Petitions for Enforcement and/or Review of Board Orders, Fiscal Year 1997, Compared With 5-Year Cumulative Totals, Fiscal Years 1992 Through 1996
| Circuit courts of appeals (headquarters) | Total fiscal year 1997 | Total fiscal years 1992-1996 | Affirmed in full | Modified | Remanded in full | Affirmed in part and remanded in part | Set aside | |||||||||||||||
|---|---|---|---|---|---|---|---|---|---|---|---|---|---|---|---|---|---|---|---|---|---|---|
| Circuit courts of appeals (headquarters) | Total fiscal year 1997 | Total fiscal years 1992-1996 | Fiscal year 1997 | Cumulative fiscal years 1992-1996 | Fiscal Year 1997 | Cumulative fiscal years 1992-1996 | Fiscal Year 1997 | Cumulative fiscal years 1992-1996 | Fiscal Year 1997 | Cumulative fiscal years 1992-1996 | Fiscal Year 1997 | Cumulative fiscal years 1992-1996 | ||||||||||
| Circuit courts of appeals (headquarters) | Total fiscal year 1997 | Total fiscal years 1992-1996 | Number | Percent | Number | Percent | Number | Percent | Number | Percent | Number | Percent | Number | Percent | Number | Percent | Number | Percent | Number | Percent | Number | Percent |
| Total all circuits | 166 | 749 | 116 | 70.0 | 517 | 69.0 | 15 | 9.0 | 70 | 9.3 | 7 | 4.2 | 44 | 6.0 | 8 | 4.8 | 27 | 3.6 | 20 | 12.0 | 91 | 12.1 |
| 1. Boston, MA | 5 | 26 | 3 | 60.0 | 20 | 76.9 | 0 | 0.0 | 2 | 7.7 | 0 | 0.0 | 4 | 15.4 | 1 | 20.0 | 0 | 0.0 | 1 | 20.0 | 0 | 0.0 |
| 2. New York, NY | 10 | 69 | 8 | 80.0 | 51 | 73.9 | 0 | 0.0 | 10 | 14.5 | 0 | 0.0 | 2 | 3.0 | 0 | 0.0 | 1 | 1.4 | 2 | 20.0 | 5 | 7.2 |
| 3. Philadelphia, PA | 9 | 79 | 7 | 77.8 | 68 | 86.1 | 0 | 0.0 | 1 | 1.3 | 1 | 11.1 | 4 | 5.1 | 0 | 0.0 | 2 | 2.5 | 1 | 11.1 | 4 | 5.0 |
| 4. Richmond, VA | 16 | 58 | 10 | 62.5 | 39 | 67.2 | 3 | 19.0 | 6 | 10.3 | 0 | 0.0 | 2 | 3.4 | 1 | 6.0 | 3 | 5.3 | 2 | 12.5 | 8 | 13.8 |
| 5. New Orleans, LA | 12 | 42 | 8 | 66.7 | 28 | 66.7 | 0 | 0.0 | 5 | 11.9 | 1 | 8.3 | 3 | 7.1 | 0 | 0.0 | 1 | 2.4 | 3 | 25.0 | 5 | 11.9 |
| 6. Cincinnati, OH | 34 | 106 | 23 | 67.6 | 59 | 55.7 | 2 | 5.9 | 15 | 14.2 | 3 | 8.8 | 7 | 6.6 | 2 | 5.9 | 1 | 0.9 | 4 | 11.8 | 24 | 22.6 |
| 7. Chicago, IL | 12 | 69 | 9 | 75.0 | 49 | 71.0 | 3 | 25.0 | 7 | 10.1 | 0 | 0.0 | 4 | 5.8 | 0 | 0.0 | 3 | 4.4 | 0 | 0.0 | 6 | 8.7 |
| 8. St. Louis, MO | 10 | 41 | 8 | 80.0 | 23 | 56.1 | 0 | 0.0 | 6 | 14.6 | 1 | 10.0 | 1 | 2.5 | 0 | 0.0 | 0 | 0.0 | 1 | 10.0 | 11 | 26.8 |
| 9. San Francisco, CA | 18 | 92 | 15 | 83.3 | 75 | 81.5 | 1 | 5.6 | 6 | 6.5 | 0 | 0.0 | 3 | 3.3 | 0 | 0.0 | 1 | 1.1 | 2 | 11.1 | 7 | 7.6 |
| 10. Denver, CO | 2 | 24 | 1 | 50.0 | 19 | 79.1 | 1 | 50.0 | 1 | 4.2 | 0 | 0.0 | 0 | 0.0 | 0 | 0.0 | 1 | 4.2 | 0 | 0.0 | 3 | 12.5 |
| 11. Atlanta, GA | 6 | 22 | 6 | 100.0 | 21 | 95.5 | 0 | 0.0 | 0 | 0.0 | 0 | 0.0 | 0 | 0.0 | 0 | 0.0 | 1 | 4.5 | 0 | 0.0 | 0 | 0.0 |
| Washington, DC | 32 | 121 | 18 | 56.3 | 65 | 53.7 | 5 | 15.6 | 11 | 9.1 | 1 | 3.1 | 14 | 11.6 | 4 | 12.5 | 13 | 10.7 | 4 | 12.5 | 18 | 14.9 |
- 1 Percentages are computed horizontally by current fiscal year and total fiscal years.
125 of 125 figures sit in a row or column sum that works out.
Reader’s notes
p. 169. 23 columns: stub, two "Total" columns, then five outcome blocks (Affirmed in full; Modified; Remanded in full; Affirmed in part and remanded in part; Set aside), each with a fiscal year 1997 Number/Percent pair and a cumulative 1992-1996 Number/Percent pair. The heading over the first block is printed "Fiscal year 1997" (lowercase y) while the other four read "Fiscal Year 1997"; transcribed as printed. The last row, Washington, DC, carries no row number in the print. The printed percentages do not all match the horizontal computation described in footnote 1, and several are rounded loosely; all are transcribed exactly as printed. Examples: Total all circuits, Affirmed in full / Fiscal year 1997 / Percent reads 70.0 though 116/166 = 69.9; Total all circuits, Remanded in full / Cumulative / Percent reads 6.0 though 44/749 = 5.9; Richmond, VA, Modified / Fiscal Year 1997 / Percent reads 19.0 though 3/16 = 18.8; Richmond, VA, Affirmed in part / Fiscal Year 1997 / Percent reads 6.0 though 1/16 = 6.3; New York, NY, Remanded in full / Cumulative / Percent reads 3.0 though 2/69 = 2.9; St. Louis, MO, Remanded in full / Cumulative / Percent reads 2.5 though 1/41 = 2.4; Denver, CO, Affirmed in full / Cumulative / Percent reads 79.1 though 19/24 = 79.2. Doubtful cells, all of them one-decimal percentages where the scan is faint and my reading disagrees with the computed value by 0.1: Chicago, IL, Affirmed in part / Cumulative / Percent (read 4.4; 3/69 = 4.3) and Philadelphia, PA, Set aside / Cumulative / Percent (read 5.0; 4/79 = 5.1). Stray ink specks sit beside several figures (a dot after "5" in New York, NY, Set aside / Cumulative / Number, and dots beside the St. Louis, MO set-aside cumulative figures); these were treated as scan noise, not as characters or footnote markers. Nothing appears cut off by the crop.
Source image
Source data: U.S. NLRB Annual Reports (public domain). Reconstruction by NLRB Stats Archive. Read by claude-opus-5 (effort max, prompt extract_v1) from the 300-dpi scan; stitched by page. Updated October 2026.