NLRB Stats Archive › Annual Reports › FY1997 › Distribution of Unfair Labor Practice Situations Received, by Number of Employees in Establishments, Fiscal Year 1997
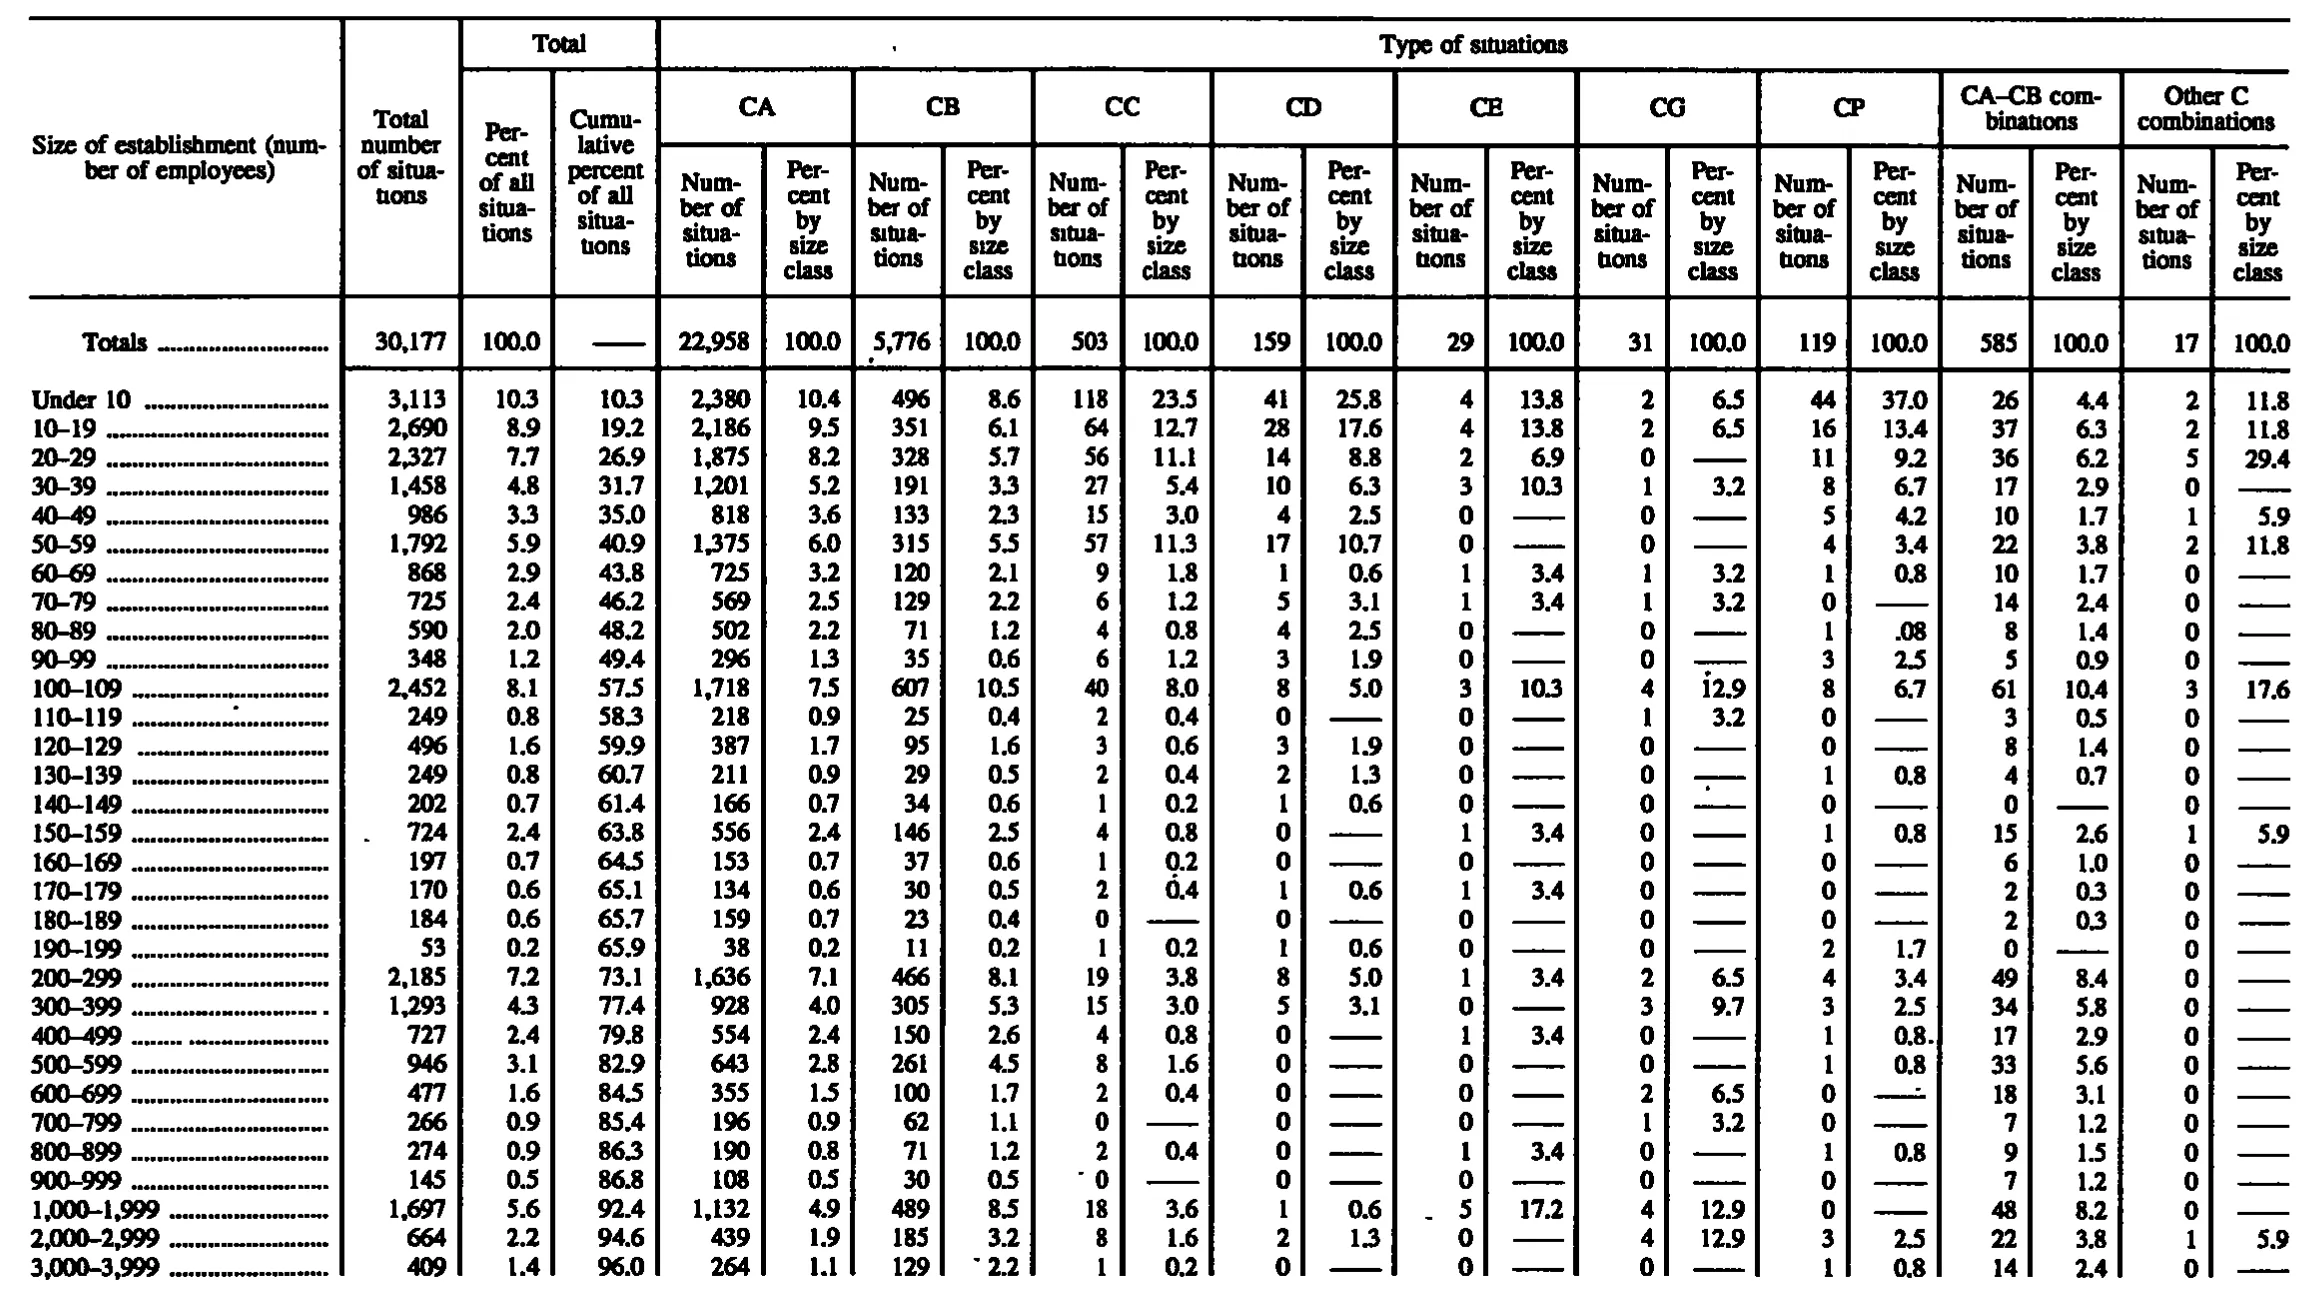
Distribution of Unfair Labor Practice Situations Received, by Number of Employees in Establishments, Fiscal Year 1997
Stitched from pp. 166–167.
| Size of establishment (number of employees) | Total number of situations | Total | Type of situations | ||||||||||||||||||
|---|---|---|---|---|---|---|---|---|---|---|---|---|---|---|---|---|---|---|---|---|---|
| Size of establishment (number of employees) | Total number of situations | Percent of all situations | Cumulative percent of all situations | CA | CB | CC | CD | CE | CG | CP | CA–CB combinations | Other C combinations | |||||||||
| Size of establishment (number of employees) | Total number of situations | Percent of all situations | Cumulative percent of all situations | Number of situations | Percent by size class | Number of situations | Percent by size class | Number of situations | Percent by size class | Number of situations | Percent by size class | Number of situations | Percent by size class | Number of situations | Percent by size class | Number of situations | Percent by size class | Number of situations | Percent by size class | Number of situations | Percent by size class |
| Totals | 30,177 | 100.0 | 22,958 | 100.0 | 5,776 | 100.0 | 503 | 100.0 | 159 | 100.0 | 29 | 100.0 | 31 | 100.0 | 119 | 100.0 | 585 | 100.0 | 17 | 100.0 | |
| Under 10 | 3,113 | 10.3 | 10.3 | 2,380 | 10.4 | 496 | 8.6 | 118 | 23.5 | 41 | 25.8 | 4 | 13.8 | 2 | 6.5 | 44 | 37.0 | 26 | 4.4 | 2 | 11.8 |
| 10–19 | 2,690 | 8.9 | 19.2 | 2,186 | 9.5 | 351 | 6.1 | 64 | 12.7 | 28 | 17.6 | 4 | 13.8 | 2 | 6.5 | 16 | 13.4 | 37 | 6.3 | 2 | 11.8 |
| 20–29 | 2,327 | 7.7 | 26.9 | 1,875 | 8.2 | 328 | 5.7 | 56 | 11.1 | 14 | 8.8 | 2 | 6.9 | 0 | 11 | 9.2 | 36 | 6.2 | 5 | 29.4 | |
| 30–39 | 1,458 | 4.8 | 31.7 | 1,201 | 5.2 | 191 | 3.3 | 27 | 5.4 | 10 | 6.3 | 3 | 10.3 | 1 | 3.2 | 8 | 6.7 | 17 | 2.9 | 0 | |
| 40–49 | 986 | 3.3 | 35.0 | 818 | 3.6 | 133 | 2.3 | 15 | 3.0 | 4 | 2.5 | 0 | 0 | 5 | 4.2 | 10 | 1.7 | 1 | 5.9 | ||
| 50–59 | 1,792 | 5.9 | 40.9 | 1,375 | 6.0 | 315 | 5.5 | 57 | 11.3 | 17 | 10.7 | 0 | 0 | 4 | 3.4 | 22 | 3.8 | 2 | 11.8 | ||
| 60–69 | 868 | 2.9 | 43.8 | 725 | 3.2 | 120 | 2.1 | 9 | 1.8 | 1 | 0.6 | 1 | 3.4 | 1 | 3.2 | 1 | 0.8 | 10 | 1.7 | 0 | |
| 70–79 | 725 | 2.4 | 46.2 | 569 | 2.5 | 129 | 2.2 | 6 | 1.2 | 5 | 3.1 | 1 | 3.4 | 1 | 3.2 | 0 | 14 | 2.4 | 0 | ||
| 80–89 | 590 | 2.0 | 48.2 | 502 | 2.2 | 71 | 1.2 | 4 | 0.8 | 4 | 2.5 | 0 | 0 | 1 | .08 | 8 | 1.4 | 0 | |||
| 90–99 | 348 | 1.2 | 49.4 | 296 | 1.3 | 35 | 0.6 | 6 | 1.2 | 3 | 1.9 | 0 | 0 | 3 | 2.5 | 5 | 0.9 | 0 | |||
| 100–109 | 2,452 | 8.1 | 57.5 | 1,718 | 7.5 | 607 | 10.5 | 40 | 8.0 | 8 | 5.0 | 3 | 10.3 | 4 | 12.9 | 8 | 6.7 | 61 | 10.4 | 3 | 17.6 |
| 110–119 | 249 | 0.8 | 58.3 | 218 | 0.9 | 25 | 0.4 | 2 | 0.4 | 0 | 0 | 1 | 3.2 | 0 | 3 | 0.5 | 0 | ||||
| 120–129 | 496 | 1.6 | 59.9 | 387 | 1.7 | 95 | 1.6 | 3 | 0.6 | 3 | 1.9 | 0 | 0 | 0 | 8 | 1.4 | 0 | ||||
| 130–139 | 249 | 0.8 | 60.7 | 211 | 0.9 | 29 | 0.5 | 2 | 0.4 | 2 | 1.3 | 0 | 0 | 1 | 0.8 | 4 | 0.7 | 0 | |||
| 140–149 | 202 | 0.7 | 61.4 | 166 | 0.7 | 34 | 0.6 | 1 | 0.2 | 1 | 0.6 | 0 | 0 | 0 | 0 | 0 | |||||
| 150–159 | 724 | 2.4 | 63.8 | 556 | 2.4 | 146 | 2.5 | 4 | 0.8 | 0 | 1 | 3.4 | 0 | 1 | 0.8 | 15 | 2.6 | 1 | 5.9 | ||
| 160–169 | 197 | 0.7 | 64.5 | 153 | 0.7 | 37 | 0.6 | 1 | 0.2 | 0 | 0 | 0 | 0 | 6 | 1.0 | 0 | |||||
| 170–179 | 170 | 0.6 | 65.1 | 134 | 0.6 | 30 | 0.5 | 2 | 0.4 | 1 | 0.6 | 1 | 3.4 | 0 | 0 | 2 | 0.3 | 0 | |||
| 180–189 | 184 | 0.6 | 65.7 | 159 | 0.7 | 23 | 0.4 | 0 | 0 | 0 | 0 | 0 | 2 | 0.3 | 0 | ||||||
| 190–199 | 53 | 0.2 | 65.9 | 38 | 0.2 | 11 | 0.2 | 1 | 0.2 | 1 | 0.6 | 0 | 0 | 2 | 1.7 | 0 | 0 | ||||
| 200–299 | 2,185 | 7.2 | 73.1 | 1,636 | 7.1 | 466 | 8.1 | 19 | 3.8 | 8 | 5.0 | 1 | 3.4 | 2 | 6.5 | 4 | 3.4 | 49 | 8.4 | 0 | |
| 300–399 | 1,293 | 4.3 | 77.4 | 928 | 4.0 | 305 | 5.3 | 15 | 3.0 | 5 | 3.1 | 0 | 3 | 9.7 | 3 | 2.5 | 34 | 5.8 | 0 | ||
| 400–499 | 727 | 2.4 | 79.8 | 554 | 2.4 | 150 | 2.6 | 4 | 0.8 | 0 | 1 | 3.4 | 0 | 1 | 0.8 | 17 | 2.9 | 0 | |||
| 500–599 | 946 | 3.1 | 82.9 | 643 | 2.8 | 261 | 4.5 | 8 | 1.6 | 0 | 0 | 0 | 1 | 0.8 | 33 | 5.6 | 0 | ||||
| 600–699 | 477 | 1.6 | 84.5 | 355 | 1.5 | 100 | 1.7 | 2 | 0.4 | 0 | 0 | 2 | 6.5 | 0 | 18 | 3.1 | 0 | ||||
| 700–799 | 266 | 0.9 | 85.4 | 196 | 0.9 | 62 | 1.1 | 0 | 0 | 0 | 1 | 3.2 | 0 | 7 | 1.2 | 0 | |||||
| 800–899 | 274 | 0.9 | 86.3 | 190 | 0.8 | 71 | 1.2 | 2 | 0.4 | 0 | 1 | 3.4 | 0 | 1 | 0.8 | 9 | 1.5 | 0 | |||
| 900–999 | 145 | 0.5 | 86.8 | 108 | 0.5 | 30 | 0.5 | 0 | 0 | 0 | 0 | 0 | 7 | 1.2 | 0 | ||||||
| 1,000–1,999 | 1,697 | 5.6 | 92.4 | 1,132 | 4.9 | 489 | 8.5 | 18 | 3.6 | 1 | 0.6 | 5 | 17.2 | 4 | 12.9 | 0 | 48 | 8.2 | 0 | ||
| 2,000–2,999 | 664 | 2.2 | 94.6 | 439 | 1.9 | 185 | 3.2 | 8 | 1.6 | 2 | 1.3 | 0 | 4 | 12.9 | 3 | 2.5 | 22 | 3.8 | 1 | 5.9 | |
| 3,000–3,999 | 409 | 1.4 | 96.0 | 264 | 1.1 | 129 | 2.2 | 1 | 0.2 | 0 | 0 | 0 | 1 | 0.8 | 14 | 2.4 | 0 | ||||
| 4,000-4,999 | 175 | 0.6 | 96.6 | 116 | 0.5 | 50 | 0.9 | 3 | 0.6 | 0 | 0 | 1 | 3.2 | 0 | 5 | 0.9 | 0 | ||||
| 5,000-9,999 | 499 | 1.7 | 98.3 | 320 | 1.4 | 152 | 2.6 | 4 | 0.8 | 0 | 1 | 3.4 | 1 | 3.2 | 0 | 21 | 5.6 | 0 | |||
| Over 9,999 | 547 | 1.8 | 100.1 | 410 | 1.8 | 120 | 2.1 | 1 | 0.2 | 0 | 0 | 1 | 3.2 | 0 | 15 | 2.6 | 0 | ||||
- 1 See Glossary of terms for definitions.
253 of 253 figures sit in a row or column sum that works out.
Reader’s notes
p. 166. The crop is cut off at the bottom: the body ends mid-table at "3,000–3,999", which is the last row fully visible, and the table plainly continues onto further size classes (and possibly footnotes) that are not on this image. No footnotes are visible within the crop. 22 columns: stub, "Total number of situations", two columns under "Total" (percent, cumulative percent), then nine two-column pairs (Number of situations / Percent by size class) under "Type of situations" for CA, CB, CC, CD, CE, CG, CP, CA–CB combinations, Other C combinations. Cells printed as a dash rule ("——"), used throughout the percent columns where the count is 0, are transcribed as "". The "Totals" row's cumulative-percent cell is also a dash rule and is given as "". Doubtful / apparently misprinted cells: - Row "80–89", CP "Percent by size class": printed as ".08" (a leading decimal point with two digits). Every neighbouring value in that column is of the form "0.8"/"2.5" etc., so this is almost certainly a typesetting error for "0.8". Transcribed exactly as printed. - Row "140–149", CG "Percent by size class": the cell holds only a faint centred dot rather than a clean dash rule; read as an eroded dash rule (count in that cell is 0) and transcribed as "". - Row "400–499", CP "Percent by size class": the glyphs read "0.8" followed by a small speck that may be a stray mark or a broken period; transcribed as "0.8". - Row "900–999", CC "Number of situations": a stray dot sits just left of the "0"; read as a printing speck, not a footnote marker or digit, so the cell is "0". - Row "1,000–1,999", CE "Number of situations": a short stray dash precedes the "5"; read as a speck, cell is "5". - A small isolated dot appears in the header band above the CA/CB area, inside the "Type of situations" span; it is a printing artifact, not a footnote marker, and is not transcribed. Arithmetic was not checked or corrected; all values are as printed.
p. 167. Orientation: the table is printed sideways (landscape) on the page and the supplied crop is still rotated 90 degrees, so all text had to be read rotated; this is the only difficulty, the content itself is legible. Scope of the crop: this is the tail of a table continued from the preceding page. Only the last three size classes are present; the caption, the earlier size-class rows and any total row are not on this image. The column headings are printed here (repeated for the continuation), so they are transcribed. Arithmetic checks (support for the column/row assignment): the nine type-of-situation counts sum exactly to the "Total number of situations" in every row (116+50+3+0+0+1+0+5+0 = 175; 320+152+4+0+1+1+0+21+0 = 499; 410+120+1+0+0+1+0+15+0 = 547), and the cumulative percents accumulate as printed (96.6 + 1.7 = 98.3; 98.3 + 1.8 = 100.1). Doubtful cell: "CA-CB combinations / Percent by size class" for row "5,000-9,999" is transcribed as printed, 5.6, but it is inconsistent with its own column. The other two rows (5 -> 0.9 and 15 -> 2.6) imply a CA-CB column base of about 570 situations, under which 21 should be about 3.7. Either the source misprints this figure or the leading digit is a 3 degraded in the scan; I read it as a 5. Every other "Percent by size class" column is internally consistent (CA base ~22,900; CB ~5,700; CC ~500; CE ~29; CG ~31). As-printed oddity: the cumulative percent for "Over 9,999" is 100.1, i.e. above 100; not corrected. Dashes: the CD, CP and "Other C combinations" percent columns, and the CE percent column in rows 1 and 3, carry only an em-dash rule; these are given as empty cells per the transcription rule. The counts beside them are printed zeros and are kept as 0. Header structure uncertainty: "Type of situations" is clearly a top-level spanner over the nine type groups. I could not resolve with certainty whether the boxed "Total" spans all three total columns or only "Percent of all situations" and "Cumulative percent of all situations", leaving "Total number of situations" as a standalone full-height heading; I have shown it spanning all three. The column labels themselves are not in doubt. Footnote markers: small specks sit after "Total" and after "Other C combinations" in the headings, and before the row-3 values in the CC, CG and CA-CB columns. The row-3 specks fall along one scan line and are plainly dirt, so I have treated all of them as artifacts rather than as raised footnote markers; no marker is legibly attached to any value or heading on this crop, even though a footnote 1 is printed below. Footnote text: the footnote line is clipped by the bottom edge of the crop. I read it as "See Glossary of terms for definitions", but the word order after "Glossary" and the terminal punctuation are uncertain, and the line may continue below the crop.
Source image

Source data: U.S. NLRB Annual Reports (public domain). Reconstruction by NLRB Stats Archive. Read by claude-opus-5 (effort max, prompt extract_v1) from the 300-dpi scan; stitched by page. Updated October 2026.