NLRB Stats Archive › Annual Reports › FY1997 › Representation elections in cases closed — by industry
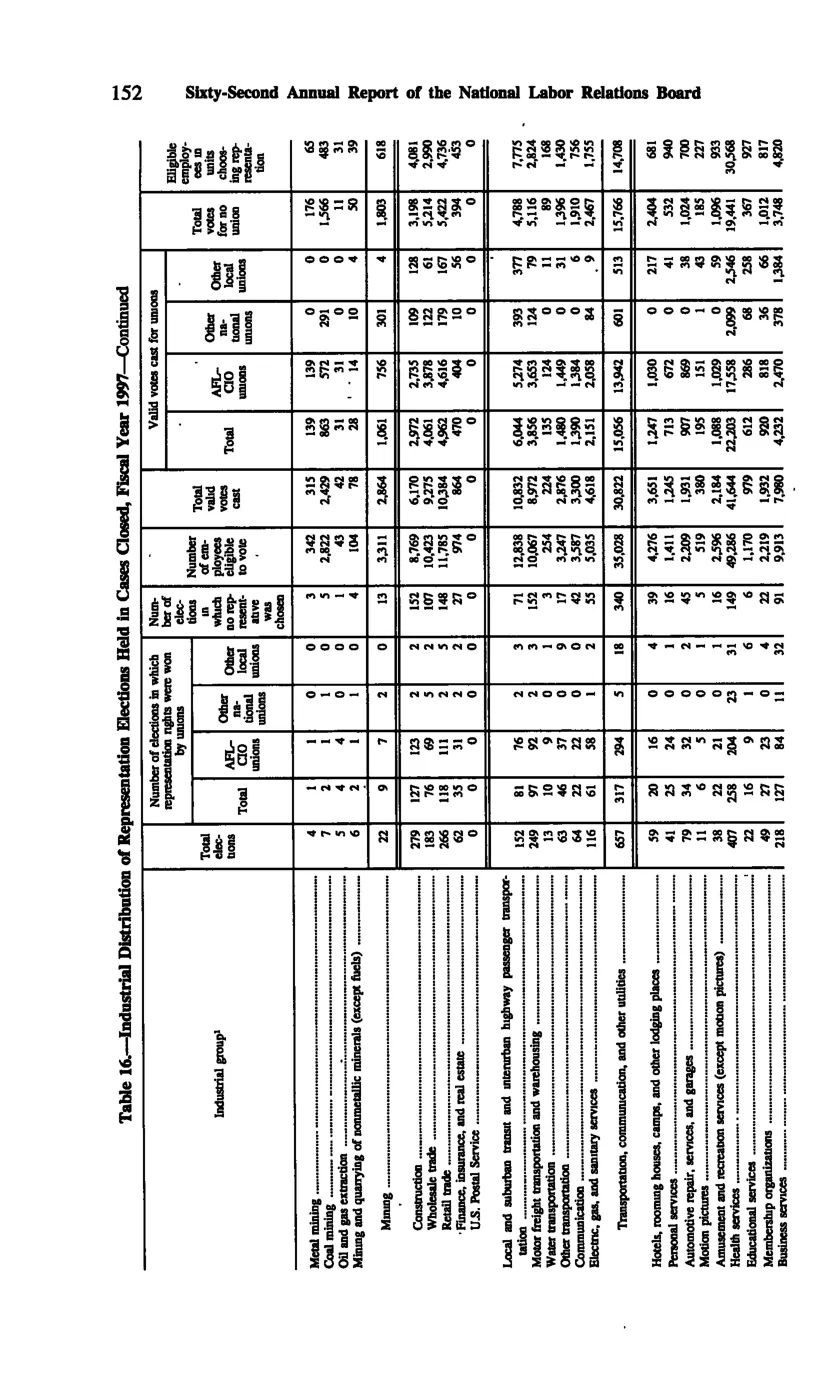
Representation elections in cases closed — by industry
| Industrial group | Total elec- tions | Number of elections in which representatives were chosen | Number of elec- tions in which no rep- resenta- tive was chosen | Number of em- ployees eligible to vote | Total valid votes cast | Valid votes cast for unions | Total valid votes for no union | Eligible employees in units choos- ing rep- resenta- tion | ||||||
|---|---|---|---|---|---|---|---|---|---|---|---|---|---|---|
| Industrial group | Total | Total | AFL-CIO unions | Other national unions | Other local unions | Number of elec- tions in which no rep- resenta- tive was chosen | Number of em- ployees eligible to vote | Total valid votes cast | Total | AFL-CIO unions | Other national unions | Other local unions | Total valid votes for no union | Eligible employees in units choos- ing rep- resenta- tion |
| Mining (subtotal) | 22 | 9 | 7 | 2 | 0 | 13 | 3,311 | 2,864 | 1,061 | 756 | 301 | 4 | 1,803 | 618 |
| Transportation, communication, and other utilities (subtotal) | 677 | 377 | 323 | 39 | 15 | 300 | 35,028 | 30,021 | 15,056 | 13,942 | 601 | 513 | 15,726 | 14,708 |
| Services (subtotal) | 1,218 | 527 | 461 | 23 | 43 | 63,235 |
Source image
Source data: U.S. NLRB Annual Reports (public domain). Reconstruction by NLRB Stats Archive. Updated June 2026.