NLRB Stats Archive › Annual Reports › FY1997 › Analysis of Methods of Disposition of Representation and Union Deauthorization Cases Closed, Fiscal Year 1997
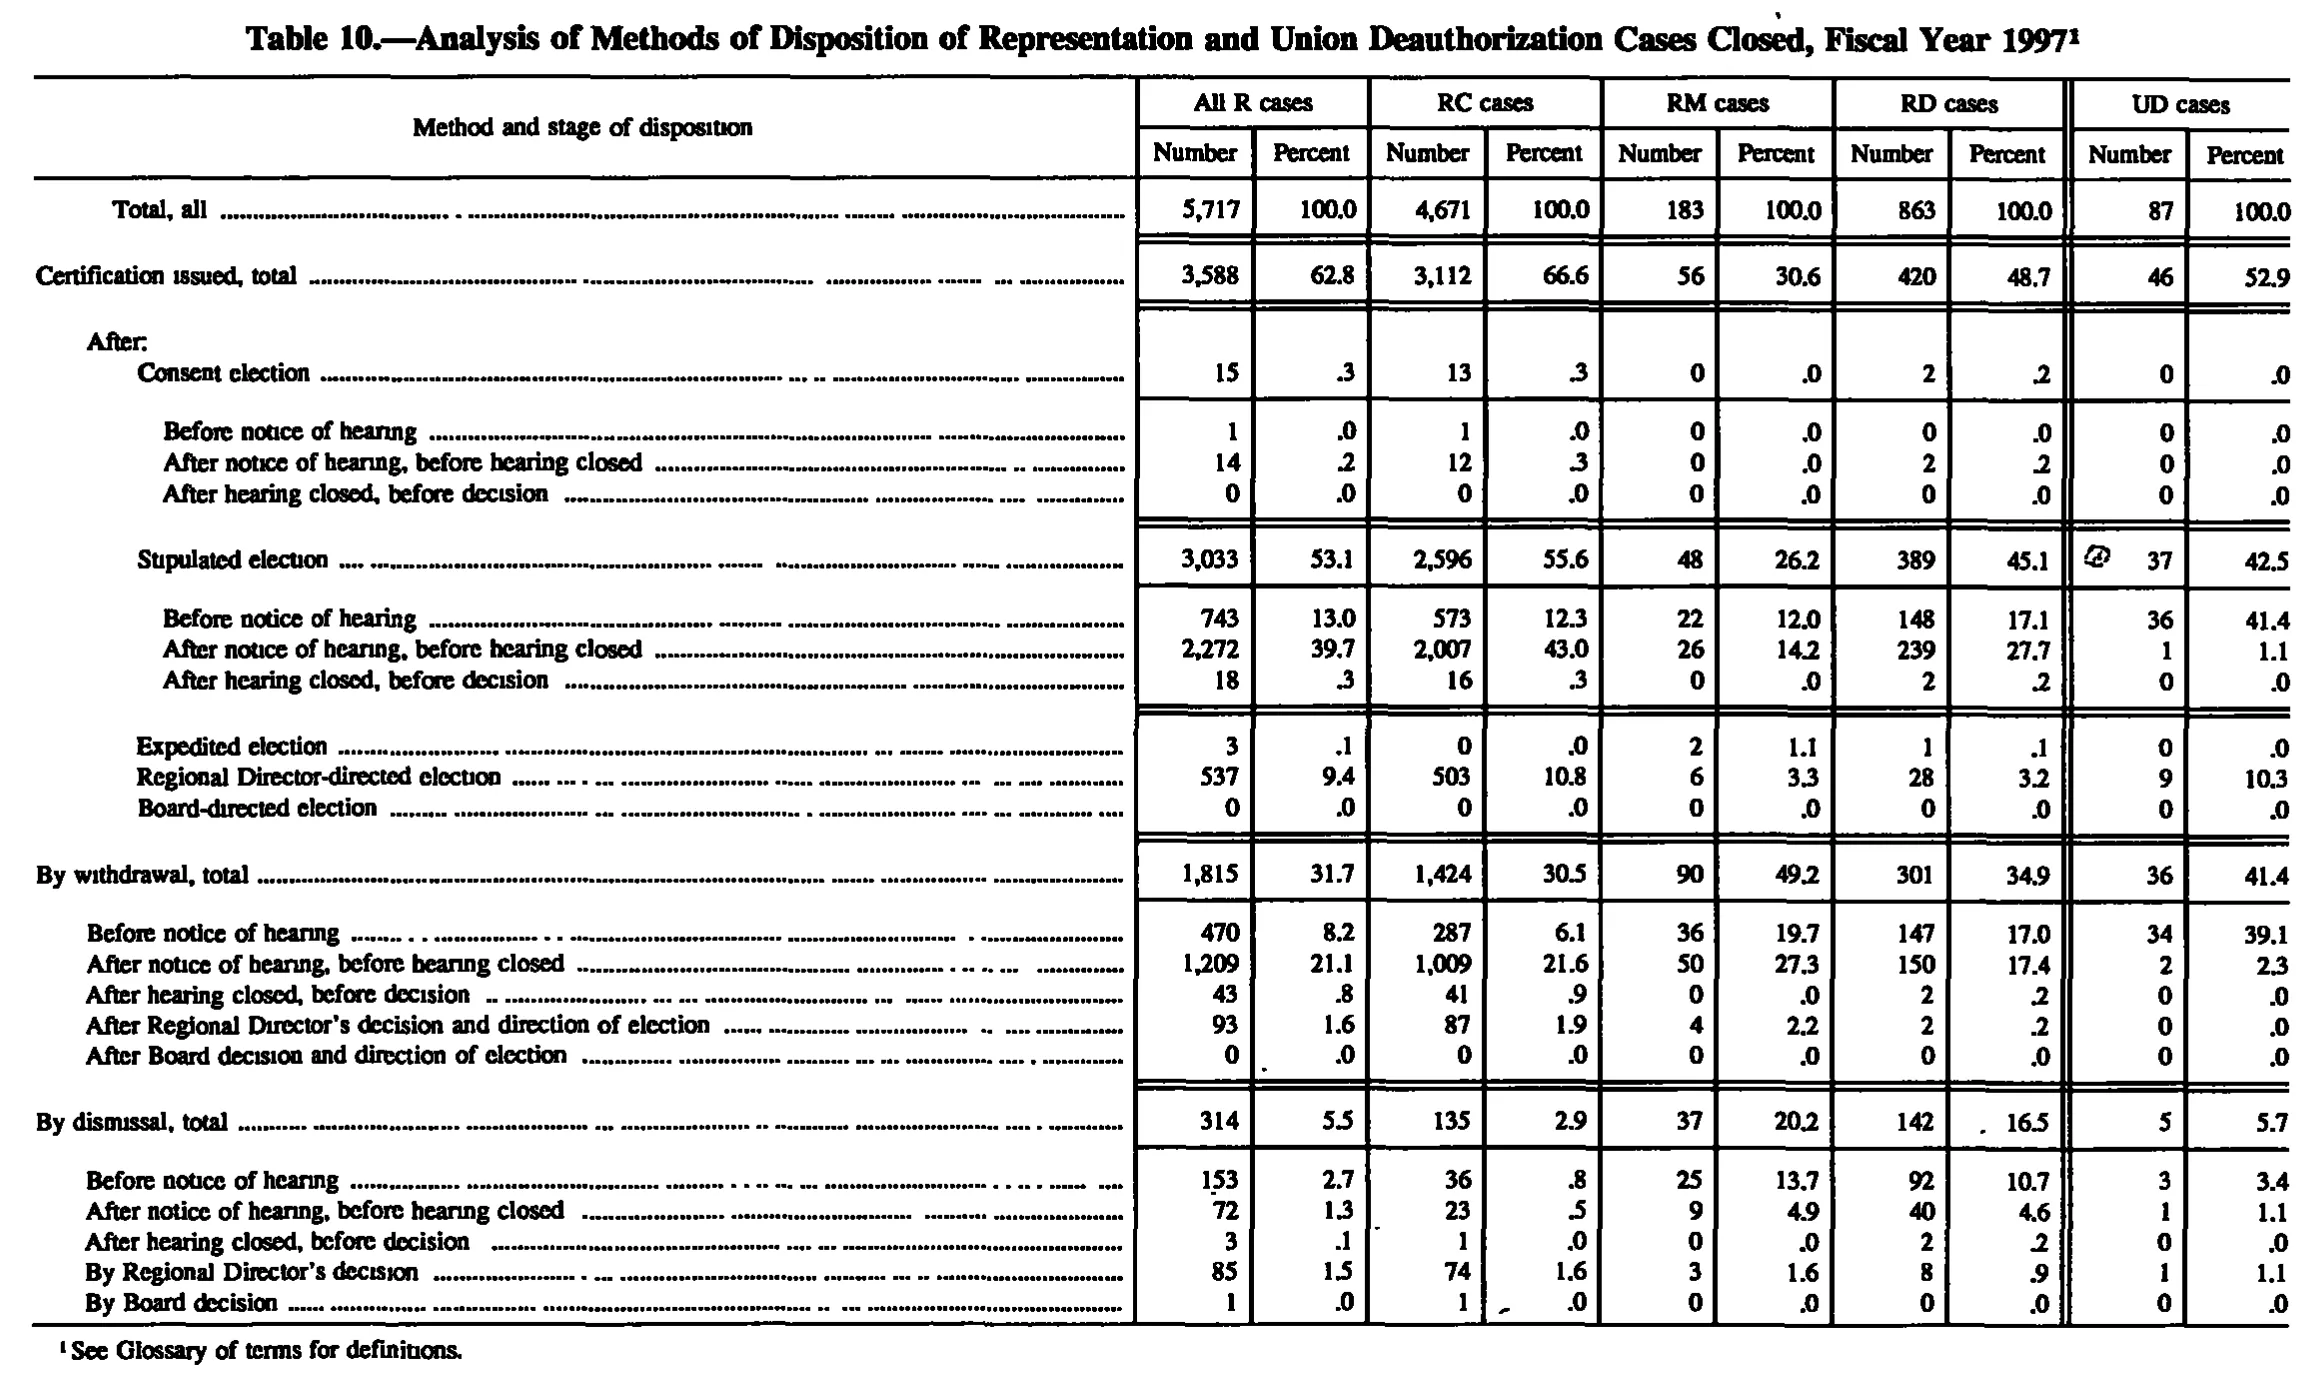
Analysis of Methods of Disposition of Representation and Union Deauthorization Cases Closed, Fiscal Year 1997
| Method and stage of disposition | All R cases | RC cases | RM cases | RD cases | UD cases | |||||
|---|---|---|---|---|---|---|---|---|---|---|
| Method and stage of disposition | Number | Percent | Number | Percent | Number | Percent | Number | Percent | Number | Percent |
| Total, all | 5,717 | 100.0 | 4,671 | 100.0 | 183 | 100.0 | 863 | 100.0 | 87 | 100.0 |
| Certification issued, total | 3,588 | 62.8 | 3,112 | 66.6 | 56 | 30.6 | 420 | 48.7 | 46 | 52.9 |
| After: | ||||||||||
| Consent election | 15 | .3 | 13 | .3 | 0 | .0 | 2 | .2 | 0 | .0 |
| Before notice of hearing | 1 | .0 | 1 | .0 | 0 | .0 | 0 | .0 | 0 | .0 |
| After notice of hearing, before hearing closed | 14 | .2 | 12 | .3 | 0 | .0 | 2 | .2 | 0 | .0 |
| After hearing closed, before decision | 0 | .0 | 0 | .0 | 0 | .0 | 0 | .0 | 0 | .0 |
| Stipulated election | 3,033 | 53.1 | 2,596 | 55.6 | 48 | 26.2 | 389 | 45.1 | 37 | 42.5 |
| Before notice of hearing | 743 | 13.0 | 573 | 12.3 | 22 | 12.0 | 148 | 17.1 | 36 | 41.4 |
| After notice of hearing, before hearing closed | 2,272 | 39.7 | 2,007 | 43.0 | 26 | 14.2 | 239 | 27.7 | 1 | 1.1 |
| After hearing closed, before decision | 18 | .3 | 16 | .3 | 0 | .0 | 2 | .2 | 0 | .0 |
| Expedited election | 3 | .1 | 0 | .0 | 2 | 1.1 | 1 | .1 | 0 | .0 |
| Regional Director-directed election | 537 | 9.4 | 503 | 10.8 | 6 | 3.3 | 28 | 3.2 | 9 | 10.3 |
| Board-directed election | 0 | .0 | 0 | .0 | 0 | .0 | 0 | .0 | 0 | .0 |
| By withdrawal, total | 1,815 | 31.7 | 1,424 | 30.5 | 90 | 49.2 | 301 | 34.9 | 36 | 41.4 |
| Before notice of hearing | 470 | 8.2 | 287 | 6.1 | 36 | 19.7 | 147 | 17.0 | 34 | 39.1 |
| After notice of hearing, before hearing closed | 1,209 | 21.1 | 1,009 | 21.6 | 50 | 27.3 | 150 | 17.4 | 2 | 2.3 |
| After hearing closed, before decision | 43 | .8 | 41 | .9 | 0 | .0 | 2 | .2 | 0 | .0 |
| After Regional Director's decision and direction of election | 93 | 1.6 | 87 | 1.9 | 4 | 2.2 | 2 | .2 | 0 | .0 |
| After Board decision and direction of election | 0 | .0 | 0 | .0 | 0 | .0 | 0 | .0 | 0 | .0 |
| By dismissal, total | 314 | 5.5 | 135 | 2.9 | 37 | 20.2 | 142 | 16.5 | 5 | 5.7 |
| Before notice of hearing | 153 | 2.7 | 36 | .8 | 25 | 13.7 | 92 | 10.7 | 3 | 3.4 |
| After notice of hearing, before hearing closed | 72 | 1.3 | 23 | .5 | 9 | 4.9 | 40 | 4.6 | 1 | 1.1 |
| After hearing closed, before decision | 3 | .1 | 1 | .0 | 0 | .0 | 2 | .2 | 0 | .0 |
| By Regional Director's decision | 85 | 1.5 | 74 | 1.6 | 3 | 1.6 | 8 | .9 | 1 | 1.1 |
| By Board decision | 1 | .0 | 1 | .0 | 0 | .0 | 0 | .0 | 0 | .0 |
- 1 See Glossary of terms for definitions.
88 of 91 figures sit in a row or column sum that works out.
Reader’s notes
p. 138. The table has 11 columns: the stub plus Number/Percent pairs for All R, RC, RM, RD and UD cases. The row "After:" is a section label printed above the certification sub-items and carries no values. Row "Stipulated election", column "UD cases / Number": a small circled mark sits in the left part of the cell, before the figure 37. It is not a raised footnote marker in the usual style of this report, no footnote 2 is printed under the table, and the surrounding arithmetic confirms 37 is the whole value (the certification sub-items 0 + 37 + 0 + 9 + 0 = 46, the printed UD certification total, and 37/87 = 42.5, the printed percent). I read it as a stray ink blot or an editorial mark on the scan and transcribed the cell as 37 alone. Minor scanning artifacts that I did not carry into cells: a stray dot before 16.5 in row "By dismissal, total" (RD cases / Percent), a stray dot after 0 in row "After Board decision and direction of election" (All R cases / Percent), and a faint mark after 1 in row "By Board decision" (RC cases / Number). All arithmetic in the table is internally consistent as transcribed. The three case-type totals sum to the All R total (4,671 + 183 + 863 = 5,717); the three method totals sum to "Total, all" in every column; and every set of sub-items sums to its section total in every column. No printed figure appears to be a misprint.
Source image
Source data: U.S. NLRB Annual Reports (public domain). Reconstruction by NLRB Stats Archive. Read by claude-opus-5 (effort max, prompt extract_v1) from the 300-dpi scan; stitched by page. Updated October 2026.