NLRB Stats Archive › Annual Reports › FY1996 › Proceedings Decided by Circuit Courts of Appeals on Petitions for Enforcement and/or Review of Board Orders, Fiscal Year 1996, Compared With 5-Year Cumulative Totals, Fiscal Years 1991 Through 1995
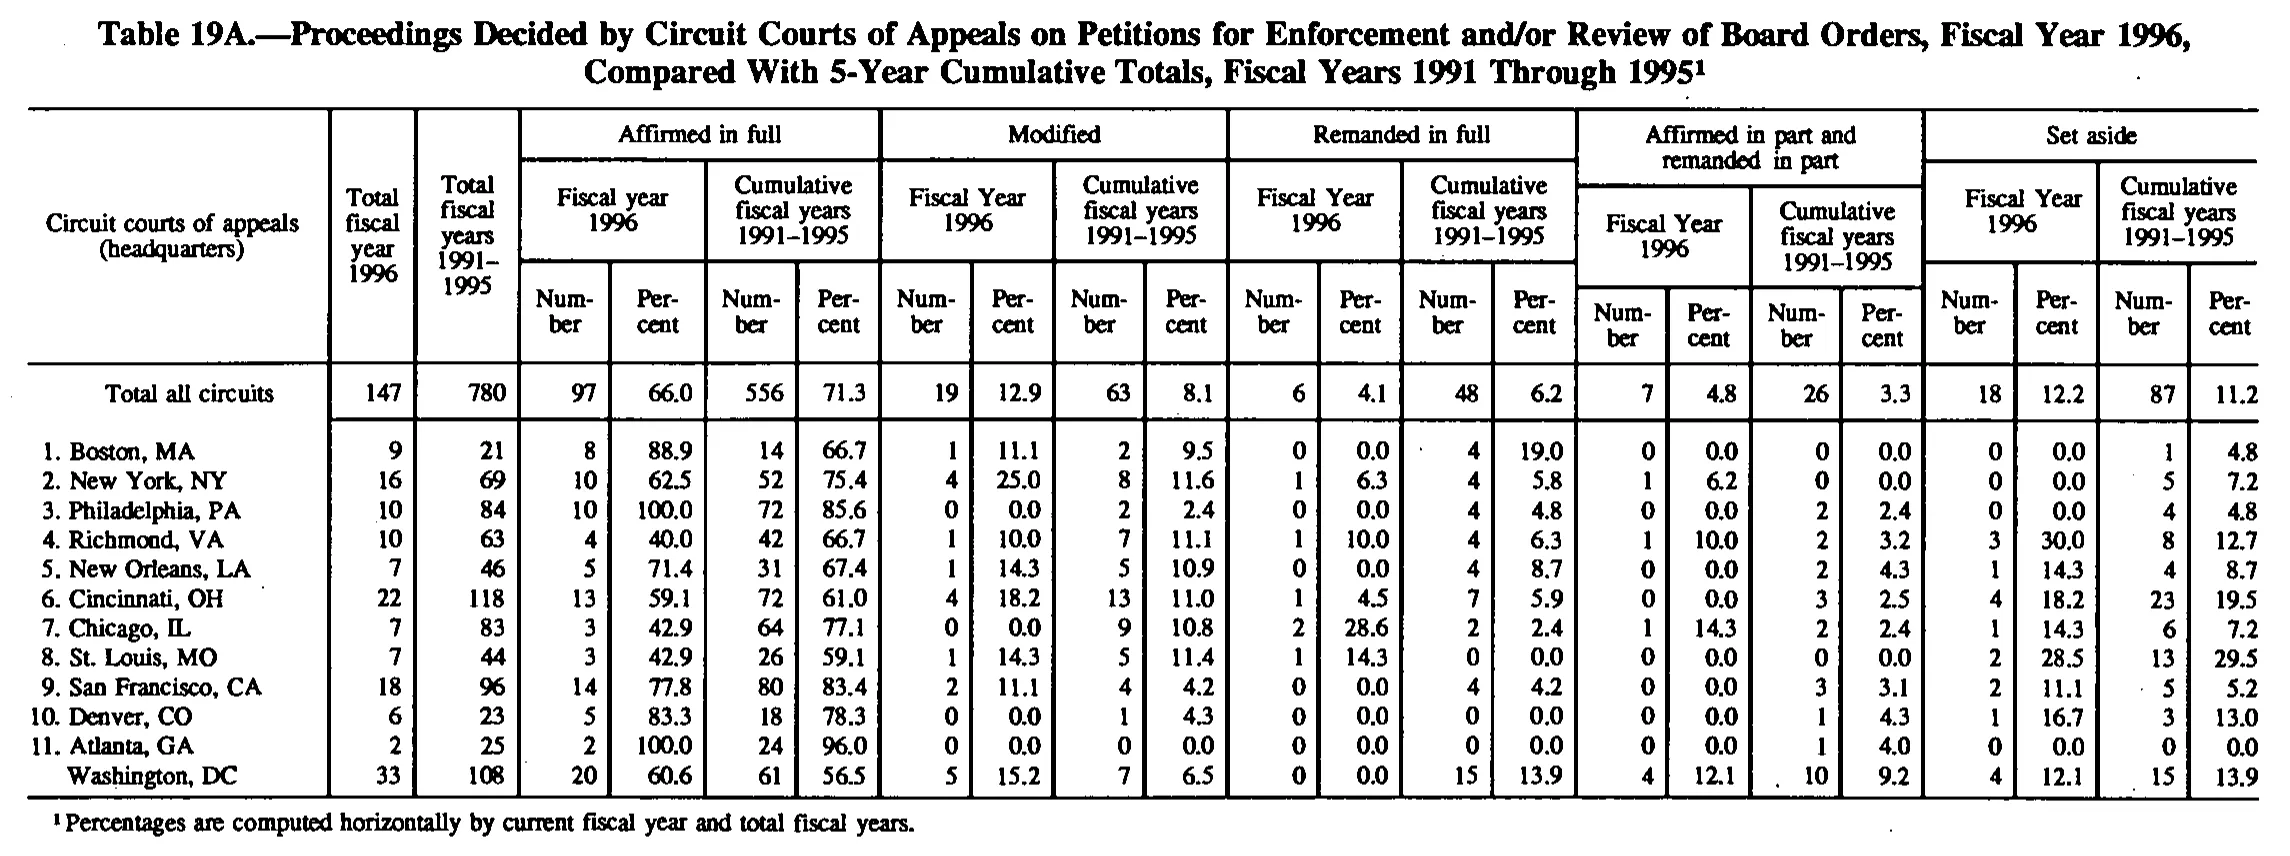
Proceedings Decided by Circuit Courts of Appeals on Petitions for Enforcement and/or Review of Board Orders, Fiscal Year 1996, Compared With 5-Year Cumulative Totals, Fiscal Years 1991 Through 1995
| Circuit courts of appeals (headquarters) | Total fiscal year 1996 | Total fiscal years 1991–1995 | Affirmed in full | Modified | Remanded in full | Affirmed in part and remanded in part | Set aside | |||||||||||||||
|---|---|---|---|---|---|---|---|---|---|---|---|---|---|---|---|---|---|---|---|---|---|---|
| Circuit courts of appeals (headquarters) | Total fiscal year 1996 | Total fiscal years 1991–1995 | Fiscal year 1996 | Cumulative fiscal years 1991–1995 | Fiscal Year 1996 | Cumulative fiscal years 1991–1995 | Fiscal Year 1996 | Cumulative fiscal years 1991–1995 | Fiscal Year 1996 | Cumulative fiscal years 1991–1995 | Fiscal Year 1996 | Cumulative fiscal years 1991–1995 | ||||||||||
| Circuit courts of appeals (headquarters) | Total fiscal year 1996 | Total fiscal years 1991–1995 | Number | Percent | Number | Percent | Number | Percent | Number | Percent | Number | Percent | Number | Percent | Number | Percent | Number | Percent | Number | Percent | Number | Percent |
| Total all circuits | 147 | 780 | 97 | 66.0 | 556 | 71.3 | 19 | 12.9 | 63 | 8.1 | 6 | 4.1 | 48 | 6.2 | 7 | 4.8 | 26 | 3.3 | 18 | 12.2 | 87 | 11.2 |
| 1. Boston, MA | 9 | 21 | 8 | 88.9 | 14 | 66.7 | 1 | 11.1 | 2 | 9.5 | 0 | 0.0 | 4 | 19.0 | 0 | 0.0 | 0 | 0.0 | 0 | 0.0 | 1 | 4.8 |
| 2. New York, NY | 16 | 69 | 10 | 62.5 | 52 | 75.4 | 4 | 25.0 | 8 | 11.6 | 1 | 6.3 | 4 | 5.8 | 1 | 6.2 | 0 | 0.0 | 0 | 0.0 | 5 | 7.2 |
| 3. Philadelphia, PA | 10 | 84 | 10 | 100.0 | 72 | 85.6 | 0 | 0.0 | 2 | 2.4 | 0 | 0.0 | 4 | 4.8 | 0 | 0.0 | 2 | 2.4 | 0 | 0.0 | 4 | 4.8 |
| 4. Richmond, VA | 10 | 63 | 4 | 40.0 | 42 | 66.7 | 1 | 10.0 | 7 | 11.1 | 1 | 10.0 | 4 | 6.3 | 1 | 10.0 | 2 | 3.2 | 3 | 30.0 | 8 | 12.7 |
| 5. New Orleans, LA | 7 | 46 | 5 | 71.4 | 31 | 67.4 | 1 | 14.3 | 5 | 10.9 | 0 | 0.0 | 4 | 8.7 | 0 | 0.0 | 2 | 4.3 | 1 | 14.3 | 4 | 8.7 |
| 6. Cincinnati, OH | 22 | 118 | 13 | 59.1 | 72 | 61.0 | 4 | 18.2 | 13 | 11.0 | 1 | 4.5 | 7 | 5.9 | 0 | 0.0 | 3 | 2.5 | 4 | 18.2 | 23 | 19.5 |
| 7. Chicago, IL | 7 | 83 | 3 | 42.9 | 64 | 77.1 | 0 | 0.0 | 9 | 10.8 | 2 | 28.6 | 2 | 2.4 | 1 | 14.3 | 2 | 2.4 | 1 | 14.3 | 6 | 7.2 |
| 8. St. Louis, MO | 7 | 44 | 3 | 42.9 | 26 | 59.1 | 1 | 14.3 | 5 | 11.4 | 1 | 14.3 | 0 | 0.0 | 0 | 0.0 | 0 | 0.0 | 2 | 28.5 | 13 | 29.5 |
| 9. San Francisco, CA | 18 | 96 | 14 | 77.8 | 80 | 83.4 | 2 | 11.1 | 4 | 4.2 | 0 | 0.0 | 4 | 4.2 | 0 | 0.0 | 3 | 3.1 | 2 | 11.1 | 5 | 5.2 |
| 10. Denver, CO | 6 | 23 | 5 | 83.3 | 18 | 78.3 | 0 | 0.0 | 1 | 4.3 | 0 | 0.0 | 0 | 0.0 | 0 | 0.0 | 1 | 4.3 | 1 | 16.7 | 3 | 13.0 |
| 11. Atlanta, GA | 2 | 25 | 2 | 100.0 | 24 | 96.0 | 0 | 0.0 | 0 | 0.0 | 0 | 0.0 | 0 | 0.0 | 0 | 0.0 | 1 | 4.0 | 0 | 0.0 | 0 | 0.0 |
| Washington, DC | 33 | 108 | 20 | 60.6 | 61 | 56.5 | 5 | 15.2 | 7 | 6.5 | 0 | 0.0 | 15 | 13.9 | 4 | 12.1 | 10 | 9.2 | 4 | 12.1 | 15 | 13.9 |
- 1 Percentages are computed horizontally by current fiscal year and total fiscal years.
125 of 125 figures sit in a row or column sum that works out.
Reader’s notes
p. 169. Grid is 23 columns: stub, two "Total" columns, then five outcome blocks (Affirmed in full; Modified; Remanded in full; Affirmed in part and remanded in part; Set aside), each with Fiscal Year 1996 Number/Percent and Cumulative fiscal years 1991-1995 Number/Percent. Arithmetic check: all twelve Number columns sum exactly to the printed "Total all circuits" line (147, 780, 97, 556, 19, 63, 6, 48, 7, 26, 18, 87), so the count cells and their column placement are well corroborated. Three Percent cells do not match the counts in their own row under the footnote's stated method, and are transcribed as printed: (a) "3. Philadelphia, PA", Affirmed in full / Cumulative Percent, printed 85.6 (72 of 84 = 85.7); (b) "9. San Francisco, CA", Affirmed in full / Cumulative Percent, printed 83.4 (80 of 96 = 83.3); (c) "8. St. Louis, MO", Set aside / Fiscal Year 1996 Percent, printed 28.5 (2 of 7 = 28.6, and the identical ratio in "7. Chicago, IL" Remanded in full is printed 28.6). Each differs only in the final digit; these may be original misprints or scan artifacts in the last digit. I read each twice and both readings agreed. The last body row is printed as "Washington, DC" with no list number, unlike the eleven numbered circuits above it; the label is transcribed as printed. Two small stray ink specks sit outside any digit (between the Boston "0.0" and "4" in the Remanded in full block, and left of the San Francisco Set aside cumulative "5"); they are not footnote markers and no value depends on them. The heading "Fiscal year 1996" is lowercase-y under "Affirmed in full" but capital-Y ("Fiscal Year 1996") under the other four blocks; transcribed as printed. En dashes in the 1991-1995 spans are reproduced as printed.
Source image
Source data: U.S. NLRB Annual Reports (public domain). Reconstruction by NLRB Stats Archive. Read by claude-opus-5 (effort max, prompt extract_v1) from the 300-dpi scan; stitched by page. Updated October 2026.