NLRB Stats Archive › Annual Reports › FY1995 › Proceedings Decided by Circuit Courts of Appeals on Petitions for Enforcement and/or Review of Board Orders, Fiscal Year 1995, Compared With 5-Year Cumulative Totals, Fiscal Years 1990 Through 1994
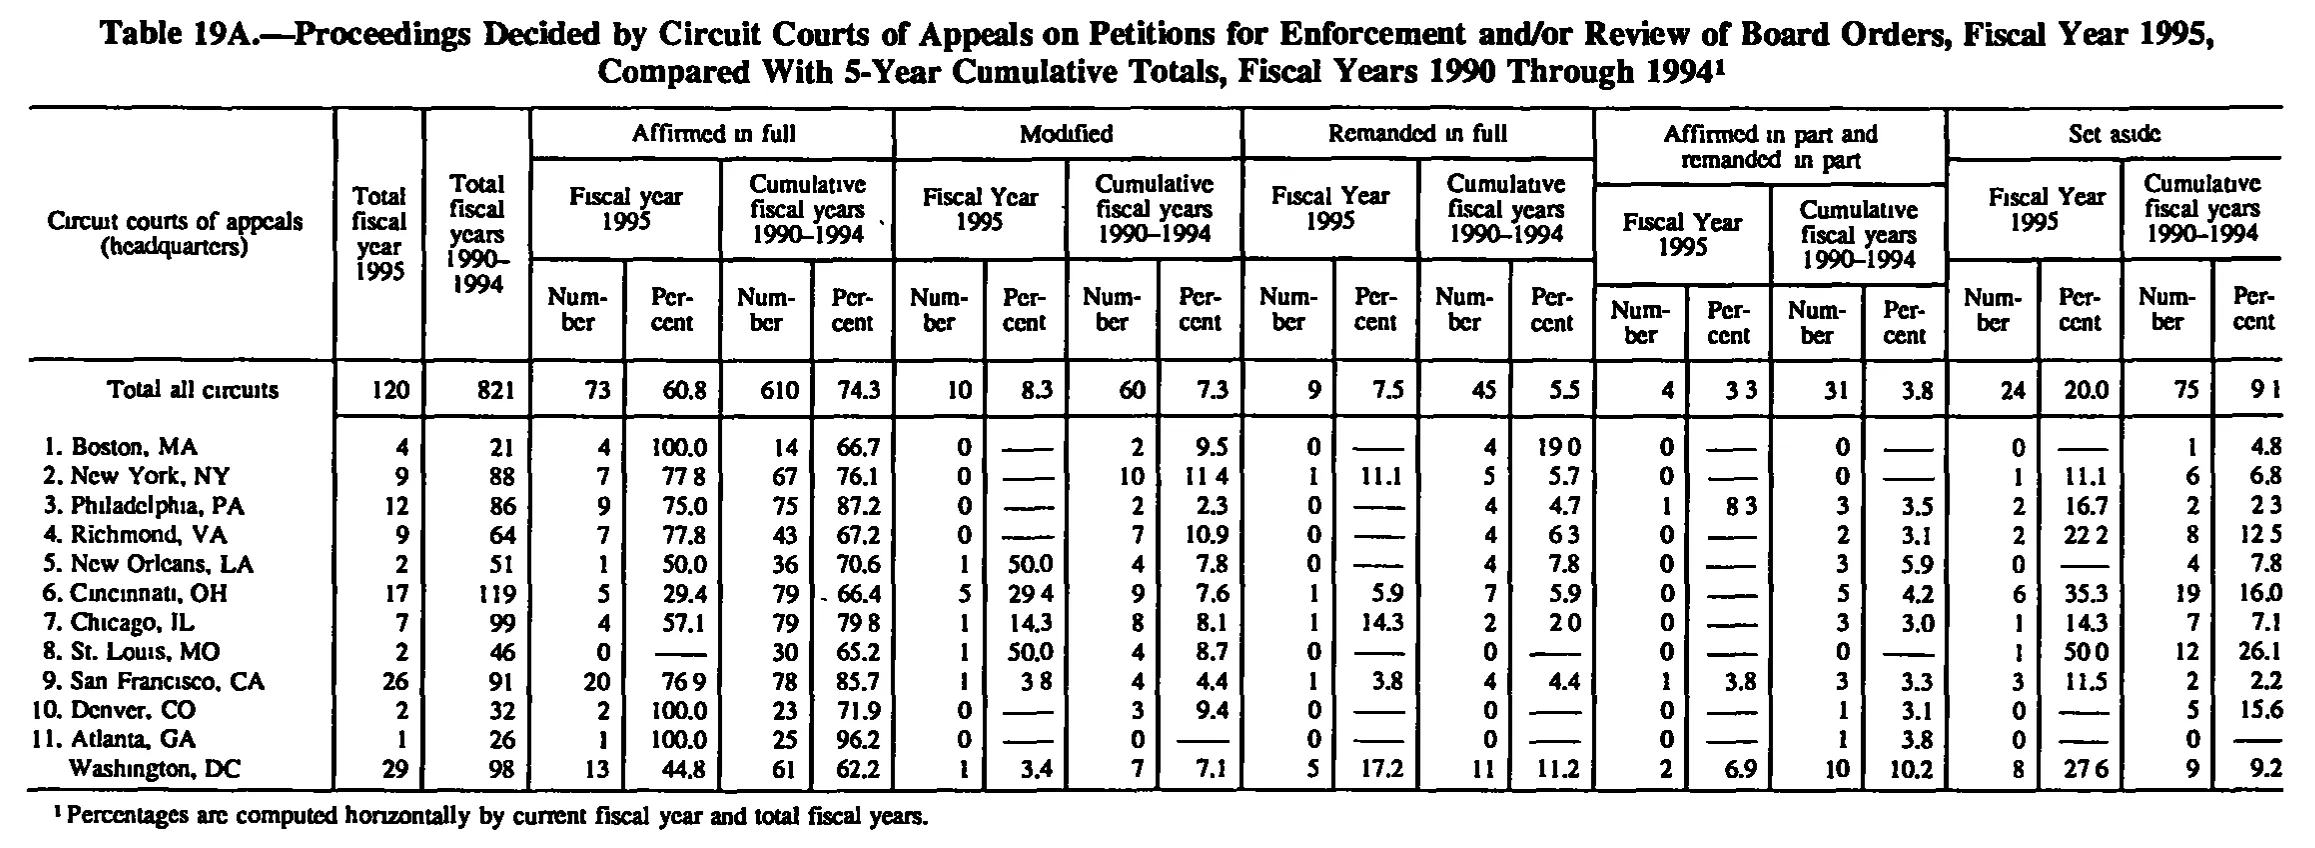
Proceedings Decided by Circuit Courts of Appeals on Petitions for Enforcement and/or Review of Board Orders, Fiscal Year 1995, Compared With 5-Year Cumulative Totals, Fiscal Years 1990 Through 1994
| Circuit courts of appeals (headquarters) | Total fiscal year 1995 | Total fiscal years 1990-1994 | Affirmed in full | Modified | Remanded in full | Affirmed in part and remanded in part | Set aside | |||||||||||||||
|---|---|---|---|---|---|---|---|---|---|---|---|---|---|---|---|---|---|---|---|---|---|---|
| Circuit courts of appeals (headquarters) | Total fiscal year 1995 | Total fiscal years 1990-1994 | Fiscal year 1995 | Cumulative fiscal years 1990-1994 | Fiscal Year 1995 | Cumulative fiscal years 1990-1994 | Fiscal Year 1995 | Cumulative fiscal years 1990-1994 | Fiscal Year 1995 | Cumulative fiscal years 1990-1994 | Fiscal Year 1995 | Cumulative fiscal years 1990-1994 | ||||||||||
| Circuit courts of appeals (headquarters) | Total fiscal year 1995 | Total fiscal years 1990-1994 | Number | Percent | Number | Percent | Number | Percent | Number | Percent | Number | Percent | Number | Percent | Number | Percent | Number | Percent | Number | Percent | Number | Percent |
| Total all circuits | 120 | 821 | 73 | 60.8 | 610 | 74.3 | 10 | 8.3 | 60 | 7.3 | 9 | 7.5 | 45 | 5.5 | 4 | 3.3 | 31 | 3.8 | 24 | 20.0 | 75 | 9.1 |
| 1. Boston, MA | 4 | 21 | 4 | 100.0 | 14 | 66.7 | 0 | 2 | 9.5 | 0 | 4 | 19.0 | 0 | 0 | 0 | 1 | 4.8 | |||||
| 2. New York, NY | 9 | 88 | 7 | 77.8 | 67 | 76.1 | 0 | 10 | 11.4 | 1 | 11.1 | 5 | 5.7 | 0 | 0 | 1 | 11.1 | 6 | 6.8 | |||
| 3. Philadelphia, PA | 12 | 86 | 9 | 75.0 | 75 | 87.2 | 0 | 2 | 2.3 | 0 | 4 | 4.7 | 1 | 8.3 | 3 | 3.5 | 2 | 16.7 | 2 | 2.3 | ||
| 4. Richmond, VA | 9 | 64 | 7 | 77.8 | 43 | 67.2 | 0 | 7 | 10.9 | 0 | 4 | 6.3 | 0 | 2 | 3.1 | 2 | 22.2 | 8 | 12.5 | |||
| 5. New Orleans, LA | 2 | 51 | 1 | 50.0 | 36 | 70.6 | 1 | 50.0 | 4 | 7.8 | 0 | 4 | 7.8 | 0 | 3 | 5.9 | 0 | 4 | 7.8 | |||
| 6. Cincinnati, OH | 17 | 119 | 5 | 29.4 | 79 | 66.4 | 5 | 29.4 | 9 | 7.6 | 1 | 5.9 | 7 | 5.9 | 0 | 5 | 4.2 | 6 | 35.3 | 19 | 16.0 | |
| 7. Chicago, IL | 7 | 99 | 4 | 57.1 | 79 | 79.8 | 1 | 14.3 | 8 | 8.1 | 1 | 14.3 | 2 | 2.0 | 0 | 3 | 3.0 | 1 | 14.3 | 7 | 7.1 | |
| 8. St. Louis, MO | 2 | 46 | 0 | 30 | 65.2 | 1 | 50.0 | 4 | 8.7 | 0 | 0 | 0 | 1 | 50.0 | 12 | 26.1 | ||||||
| 9. San Francisco, CA | 26 | 91 | 20 | 76.9 | 78 | 85.7 | 1 | 3.8 | 4 | 4.4 | 1 | 3.8 | 4 | 4.4 | 1 | 3.8 | 3 | 3.3 | 3 | 11.5 | 2 | 2.2 |
| 10. Denver, CO | 2 | 32 | 2 | 100.0 | 23 | 71.9 | 0 | 3 | 9.4 | 0 | 0 | 0 | 1 | 3.1 | 0 | 5 | 15.6 | |||||
| 11. Atlanta, GA | 1 | 26 | 1 | 100.0 | 25 | 96.2 | 0 | 0 | 0 | 0 | 0 | 1 | 3.8 | 0 | 0 | |||||||
| Washington, DC | 29 | 98 | 13 | 44.8 | 61 | 62.2 | 1 | 3.4 | 7 | 7.1 | 5 | 17.2 | 11 | 11.2 | 2 | 6.9 | 10 | 10.2 | 8 | 27.6 | 9 | 9.2 |
- 1 Percentages are computed horizontally by current fiscal year and total fiscal years.
121 of 121 figures sit in a row or column sum that works out.
Reader’s notes
p. 186. 23 columns: stub, two "Total" columns, then five outcome panels (Affirmed in full; Modified; Remanded in full; Affirmed in part and remanded in part; Set aside), each split into Fiscal Year 1995 and Cumulative fiscal years 1990-1994, each of those split into Number and Percent. Decimal points: this 1-bit scan drops or thins the period in many percent cells, so they read as a gap (e.g. "77 8", "19 0", "11 4", "8 3", "6 3", "22 2", "29 4", "79 8", "2 0", "76 9", "3 8", "50 0", "12 5", "2 3", "27 6", and "3 3" / "9 1" in the Total all circuits row). I have transcribed all of these with the decimal point (77.8, 19.0, 11.4, 8.3, 6.3, 22.2, 29.4, 79.8, 2.0, 76.9, 3.8, 50.0, 12.5, 2.3, 27.6, 3.3, 9.1); every one is confirmed by recomputing the printed Number against the printed row total, so the value is certain even though the point is faint. Dash rules: wherever a Number is 0 the Percent cell is printed as a long dash rule; per instructions these are transcribed as "". A few such cells (St. Louis row, Remanded in full both Percent columns and Affirmed in part FY1995 Percent; Denver row, Remanded in full cumulative Percent) appear genuinely blank rather than dashed in the scan, but they are "" either way. Doubtful cell: row "8. St. Louis, MO", column "Affirmed in part and remanded in part / Cumulative fiscal years 1990-1994 / Number". I see no printed digit there (the gap before the dash rule is about 1.5 column widths), so it is transcribed as "". Arithmetic says the value is 0: the row's cumulative outcomes 30+4+0+0+12 = 46 = the printed cumulative total, and that column's other eleven entries already sum to the printed 31. So the "0" is most likely dropped in printing or lost in the scan rather than a real missing value. Heading wording is as printed: the first panel reads "Fiscal year 1995" (lower-case y) while the other four read "Fiscal Year 1995". A stray tick mark sits just right of "1990-1994" in the Affirmed in full / Cumulative heading; it is a scan artifact, not a footnote marker, and is omitted. Arithmetic check: all twelve circuit rows sum exactly to the "Total all circuits" line in every one of the 22 numeric columns, and each circuit's five outcome counts sum to its two total columns. No misprints found. The last row label is "Washington, DC" with no circuit number, as printed (the D.C. Circuit). The title's footnote marker 1 and the caption are omitted per instructions.
Source image
Source data: U.S. NLRB Annual Reports (public domain). Reconstruction by NLRB Stats Archive. Read by claude-opus-5 (effort max, prompt extract_v1) from the 300-dpi scan; stitched by page. Updated October 2026.