NLRB Stats Archive › Annual Reports › FY1995 › Distribution of Unfair Labor Practice Situations Received, by Number of Employees in Establishments, Fiscal Year 1995
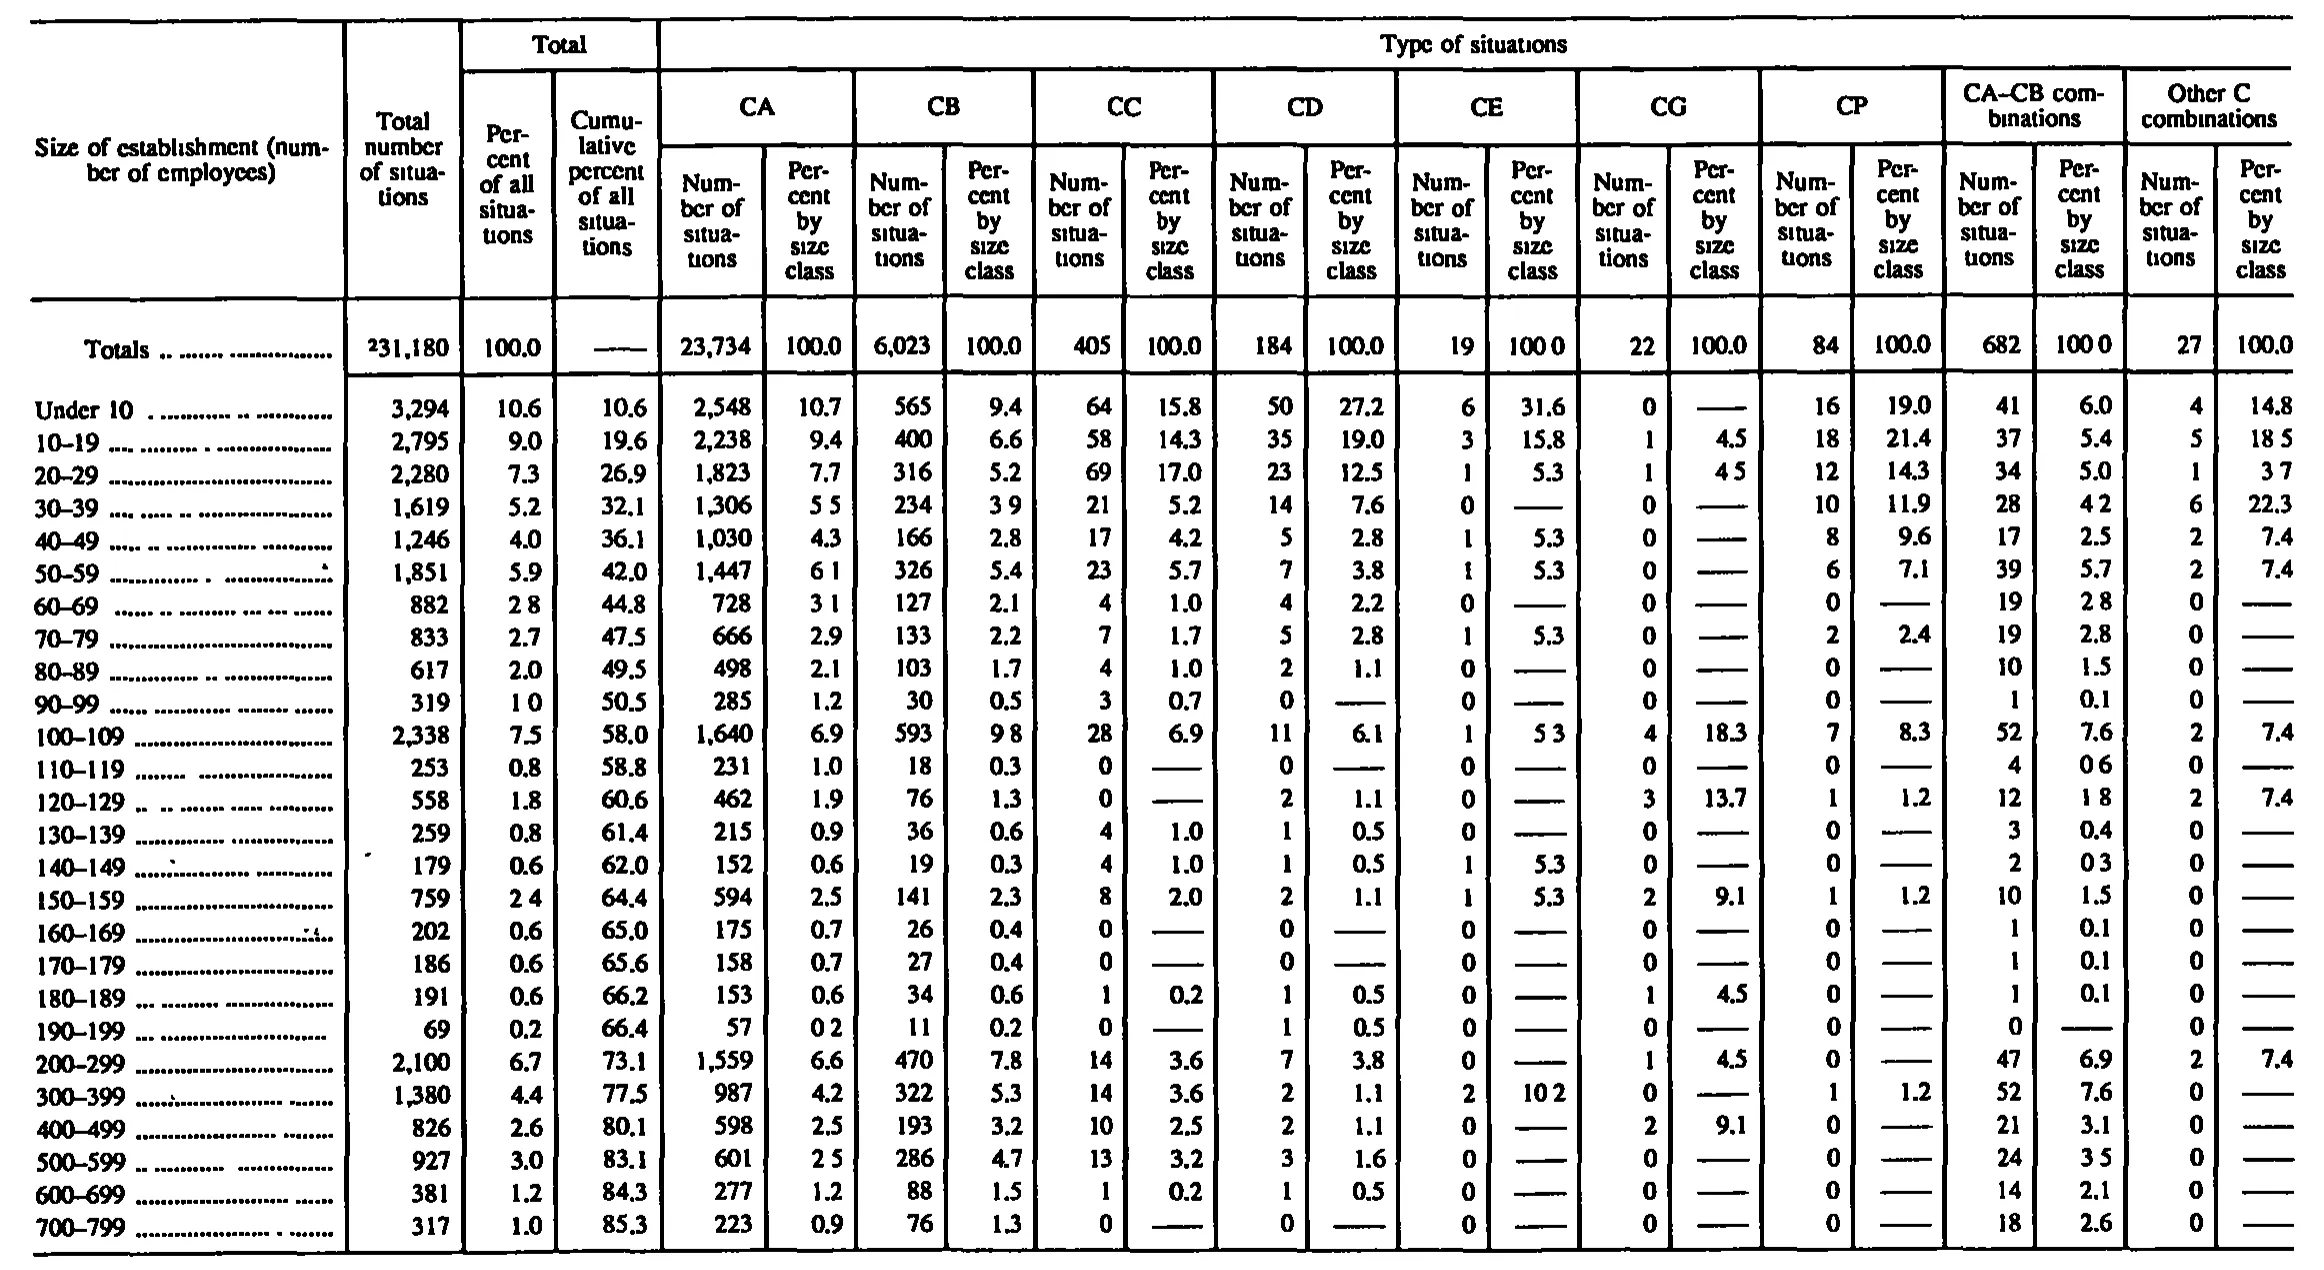
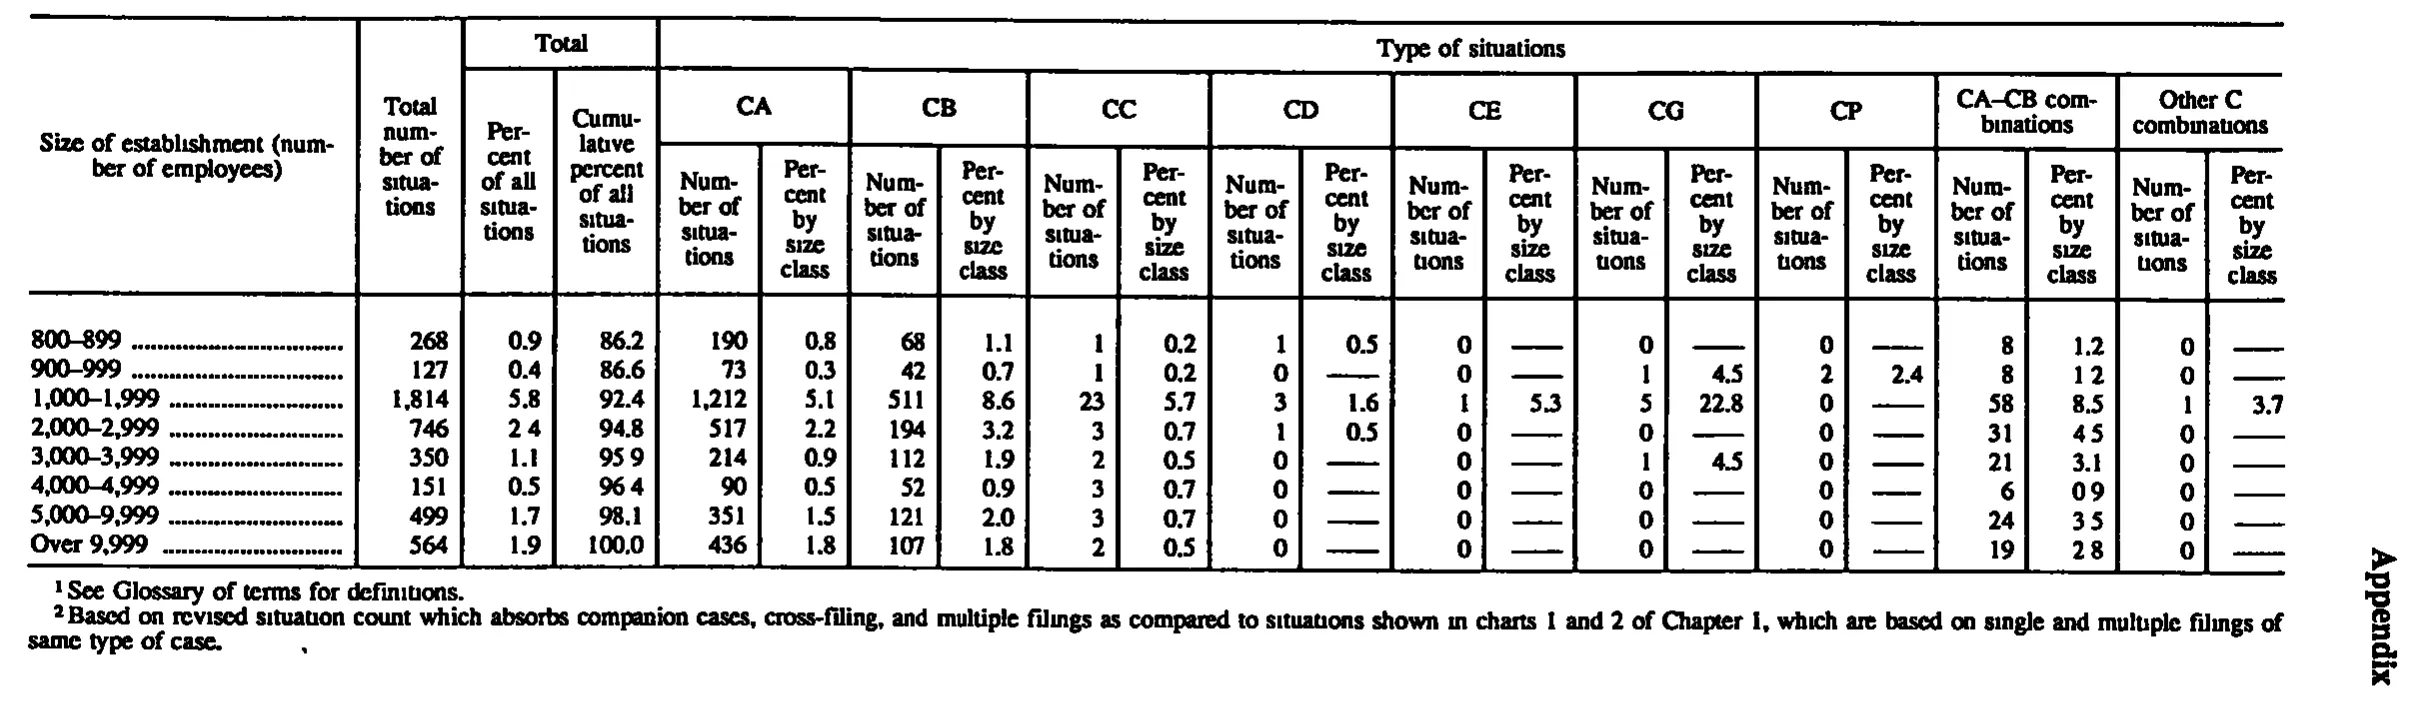
Distribution of Unfair Labor Practice Situations Received, by Number of Employees in Establishments, Fiscal Year 1995
Stitched from pp. 183–184.
| Size of establishment (number of employees) | Total number of situations | Total | Type of situations | ||||||||||||||||||
|---|---|---|---|---|---|---|---|---|---|---|---|---|---|---|---|---|---|---|---|---|---|
| Size of establishment (number of employees) | Total number of situations | Percent of all situations | Cumulative percent of all situations | CA | CB | CC | CD | CE | CG | CP | CA-CB combinations | Other C combinations | |||||||||
| Size of establishment (number of employees) | Total number of situations | Percent of all situations | Cumulative percent of all situations | Number of situations | Percent by size class | Number of situations | Percent by size class | Number of situations | Percent by size class | Number of situations | Percent by size class | Number of situations | Percent by size class | Number of situations | Percent by size class | Number of situations | Percent by size class | Number of situations | Percent by size class | Number of situations | Percent by size class |
| Totals | 31,180 | 100.0 | 23,734 | 100.0 | 6,023 | 100.0 | 405 | 100.0 | 184 | 100.0 | 19 | 100.0 | 22 | 100.0 | 84 | 100.0 | 682 | 100.0 | 27 | 100.0 | |
| Under 10 | 3,294 | 10.6 | 10.6 | 2,548 | 10.7 | 565 | 9.4 | 64 | 15.8 | 50 | 27.2 | 6 | 31.6 | 0 | 16 | 19.0 | 41 | 6.0 | 4 | 14.8 | |
| 10-19 | 2,795 | 9.0 | 19.6 | 2,238 | 9.4 | 400 | 6.6 | 58 | 14.3 | 35 | 19.0 | 3 | 15.8 | 1 | 4.5 | 18 | 21.4 | 37 | 5.4 | 5 | 18.5 |
| 20-29 | 2,280 | 7.3 | 26.9 | 1,823 | 7.7 | 316 | 5.2 | 69 | 17.0 | 23 | 12.5 | 1 | 5.3 | 1 | 4.5 | 12 | 14.3 | 34 | 5.0 | 1 | 3.7 |
| 30-39 | 1,619 | 5.2 | 32.1 | 1,306 | 5.5 | 234 | 3.9 | 21 | 5.2 | 14 | 7.6 | 0 | 0 | 10 | 11.9 | 28 | 4.2 | 6 | 22.3 | ||
| 40-49 | 1,246 | 4.0 | 36.1 | 1,030 | 4.3 | 166 | 2.8 | 17 | 4.2 | 5 | 2.8 | 1 | 5.3 | 0 | 8 | 9.6 | 17 | 2.5 | 2 | 7.4 | |
| 50-59 | 1,851 | 5.9 | 42.0 | 1,447 | 6.1 | 326 | 5.4 | 23 | 5.7 | 7 | 3.8 | 1 | 5.3 | 0 | 6 | 7.1 | 39 | 5.7 | 2 | 7.4 | |
| 60-69 | 882 | 2.8 | 44.8 | 728 | 3.1 | 127 | 2.1 | 4 | 1.0 | 4 | 2.2 | 0 | 0 | 0 | 19 | 2.8 | 0 | ||||
| 70-79 | 833 | 2.7 | 47.5 | 666 | 2.9 | 133 | 2.2 | 7 | 1.7 | 5 | 2.8 | 1 | 5.3 | 0 | 2 | 2.4 | 19 | 2.8 | 0 | ||
| 80-89 | 617 | 2.0 | 49.5 | 498 | 2.1 | 103 | 1.7 | 4 | 1.0 | 2 | 1.1 | 0 | 0 | 0 | 10 | 1.5 | 0 | ||||
| 90-99 | 319 | 1.0 | 50.5 | 285 | 1.2 | 30 | 0.5 | 3 | 0.7 | 0 | 0 | 0 | 0 | 1 | 0.1 | 0 | |||||
| 100-109 | 2,338 | 7.5 | 58.0 | 1,640 | 6.9 | 593 | 9.8 | 28 | 6.9 | 11 | 6.1 | 1 | 5.3 | 4 | 18.3 | 7 | 8.3 | 52 | 7.6 | 2 | 7.4 |
| 110-119 | 253 | 0.8 | 58.8 | 231 | 1.0 | 18 | 0.3 | 0 | 0 | 0 | 0 | 0 | 4 | 0.6 | 0 | ||||||
| 120-129 | 558 | 1.8 | 60.6 | 462 | 1.9 | 76 | 1.3 | 0 | 2 | 1.1 | 0 | 3 | 13.7 | 1 | 1.2 | 12 | 1.8 | 2 | 7.4 | ||
| 130-139 | 259 | 0.8 | 61.4 | 215 | 0.9 | 36 | 0.6 | 4 | 1.0 | 1 | 0.5 | 0 | 0 | 0 | 3 | 0.4 | 0 | ||||
| 140-149 | 179 | 0.6 | 62.0 | 152 | 0.6 | 19 | 0.3 | 4 | 1.0 | 1 | 0.5 | 1 | 5.3 | 0 | 0 | 2 | 0.3 | 0 | |||
| 150-159 | 759 | 2.4 | 64.4 | 594 | 2.5 | 141 | 2.3 | 8 | 2.0 | 2 | 1.1 | 1 | 5.3 | 2 | 9.1 | 1 | 1.2 | 10 | 1.5 | 0 | |
| 160-169 | 202 | 0.6 | 65.0 | 175 | 0.7 | 26 | 0.4 | 0 | 0 | 0 | 0 | 0 | 1 | 0.1 | 0 | ||||||
| 170-179 | 186 | 0.6 | 65.6 | 158 | 0.7 | 27 | 0.4 | 0 | 0 | 0 | 0 | 0 | 1 | 0.1 | 0 | ||||||
| 180-189 | 191 | 0.6 | 66.2 | 153 | 0.6 | 34 | 0.6 | 1 | 0.2 | 1 | 0.5 | 0 | 1 | 4.5 | 0 | 1 | 0.1 | 0 | |||
| 190-199 | 69 | 0.2 | 66.4 | 57 | 0.2 | 11 | 0.2 | 0 | 1 | 0.5 | 0 | 0 | 0 | 0 | 0 | ||||||
| 200-299 | 2,100 | 6.7 | 73.1 | 1,559 | 6.6 | 470 | 7.8 | 14 | 3.6 | 7 | 3.8 | 0 | 1 | 4.5 | 0 | 47 | 6.9 | 2 | 7.4 | ||
| 300-399 | 1,380 | 4.4 | 77.5 | 987 | 4.2 | 322 | 5.3 | 14 | 3.6 | 2 | 1.1 | 2 | 10.2 | 0 | 1 | 1.2 | 52 | 7.6 | 0 | ||
| 400-499 | 826 | 2.6 | 80.1 | 598 | 2.5 | 193 | 3.2 | 10 | 2.5 | 2 | 1.1 | 0 | 2 | 9.1 | 0 | 21 | 3.1 | 0 | |||
| 500-599 | 927 | 3.0 | 83.1 | 601 | 2.5 | 286 | 4.7 | 13 | 3.2 | 3 | 1.6 | 0 | 0 | 0 | 24 | 3.5 | 0 | ||||
| 600-699 | 381 | 1.2 | 84.3 | 277 | 1.2 | 88 | 1.5 | 1 | 0.2 | 1 | 0.5 | 0 | 0 | 0 | 14 | 2.1 | 0 | ||||
| 700-799 | 317 | 1.0 | 85.3 | 223 | 0.9 | 76 | 1.3 | 0 | 0 | 0 | 0 | 0 | 18 | 2.6 | 0 | ||||||
| 800–899 | 268 | 0.9 | 86.2 | 190 | 0.8 | 68 | 1.1 | 1 | 0.2 | 1 | 0.5 | 0 | 0 | 0 | 8 | 1.2 | 0 | ||||
| 900–999 | 127 | 0.4 | 86.6 | 73 | 0.3 | 42 | 0.7 | 1 | 0.2 | 0 | 0 | 1 | 4.5 | 2 | 2.4 | 8 | 1.2 | 0 | |||
| 1,000–1,999 | 1,814 | 5.8 | 92.4 | 1,212 | 5.1 | 511 | 8.6 | 23 | 5.7 | 3 | 1.6 | 1 | 5.3 | 5 | 22.8 | 0 | 58 | 8.5 | 1 | 3.7 | |
| 2,000–2,999 | 746 | 2.4 | 94.8 | 517 | 2.2 | 194 | 3.2 | 3 | 0.7 | 1 | 0.5 | 0 | 0 | 0 | 31 | 4.5 | 0 | ||||
| 3,000–3,999 | 350 | 1.1 | 95.9 | 214 | 0.9 | 112 | 1.9 | 2 | 0.5 | 0 | 0 | 1 | 4.5 | 0 | 21 | 3.1 | 0 | ||||
| 4,000–4,999 | 151 | 0.5 | 96.4 | 90 | 0.5 | 52 | 0.9 | 3 | 0.7 | 0 | 0 | 0 | 0 | 6 | 0.9 | 0 | |||||
| 5,000–9,999 | 499 | 1.7 | 98.1 | 351 | 1.5 | 121 | 2.0 | 3 | 0.7 | 0 | 0 | 0 | 0 | 24 | 3.5 | 0 | |||||
| Over 9,999 | 564 | 1.9 | 100.0 | 436 | 1.8 | 107 | 1.8 | 2 | 0.5 | 0 | 0 | 0 | 0 | 19 | 2.8 | 0 | |||||
- 1 See Glossary of terms for definitions.
- 2 Based on revised situation count which absorbs companion cases, cross-filing, and multiple filings as compared to situations shown in charts 1 and 2 of Chapter 1, which are based on single and multiple filings of same type of case.
241 of 241 figures sit in a row or column sum that works out.
Reader’s notes
p. 183. 22 columns: stub, "Total number of situations" (a tall heading spanning all three header levels), two columns under "Total", and nine Number/Percent pairs under "Type of situations". Crop is cut off at the bottom: the body ends with "700-799" at a cumulative percent of 85.3, so the remaining size classes (800 and over, etc.) and any closing total continue on the next image. No footnote text is printed inside this crop, even though the Totals row carries a raised "2" on 31,180 (transcribed as 31,180^2); the footnote itself must sit below the crop. Decimal points: this is a coarse 1-bit scan and in many percent cells the printed decimal point has dropped out, so the glyphs read like "100 0", "18 5", "5 5", "0 6", "10 2". These are one-decimal percentages throughout the table, so I have written the decimal point in every such cell (e.g. "100.0", "18.5", "5.5", "0.6"). No digits were altered. Affected cells include: Totals row CE and CA-CB percent; 10-19 Other C percent; 20-29 CG and Other C percent; 30-39 CA, CB and CA-CB percent; 50-59 CA percent; 60-69 total percent, CA percent and CA-CB percent; 90-99 total percent; 100-109 CB percent and CE percent; 110-119 CA-CB percent; 120-129 CA-CB percent; 140-149 CA-CB percent; 150-159 total percent; 190-199 CA percent; 300-399 CE percent; 500-599 CA percent and CA-CB percent. Doubtful cells (transcribed as read, but arithmetically suspicious): - Row "100-109", CG "Percent by size class": read as 18.3, but 4 of a CG total of 22 is 18.2. The digit after the decimal may be a 2 rendered as 3. - Row "120-129", CG "Percent by size class": read as 13.7, but 3 of 22 is 13.6. The final digit may be a 6. - Row "300-399", CE "Percent by size class": read as 10.2 (decimal point missing in print), but 2 of a CE total of 19 is 10.5. The final digit may be a 5. Other CG and CE percentages in the table are consistent with denominators of 22 and 19 respectively, which is why these three stand out. Row labels use an en dash in the printed ranges ("10–19"); I have written a plain hyphen. Likewise the heading "CA–CB combinations" is written "CA-CB combinations". Dash rules ("——") in percent cells, and the dash rule in the Totals row's "Cumulative percent of all situations" cell, are transcribed as empty strings. Printed zeros in the number columns are kept as "0".
p. 184. The crop is a continuation page: the column headings are reprinted in full, but the body begins at the 800–899 size class, so the smaller size classes and any total line appear on the preceding page. No total row is printed on this image. 22 printed columns: stub; "Total number of situations"; two columns under "Total"; then nine Number/Percent pairs under "Type of situations" (CA, CB, CC, CD, CE, CG, CP, CA–CB combinations, Other C combinations). The scan is a coarse 1-bit image and several decimal points dropped out, printing as a gap (e.g. "2 4", "95 9", "96 4", "1 2", "4 5", "0 9", "3 5", "2 8"). I transcribed these as decimals (2.4, 95.9, 96.4, 1.2, 4.5, 0.9, 3.5, 2.8) because every value in those columns carries one decimal place and because the cumulative-percent column reconciles exactly against the percent-of-all column on that reading (86.2 + 0.4 = 86.6; 86.6 + 5.8 = 92.4; 92.4 + 2.4 = 94.8; 94.8 + 1.1 = 95.9; 95.9 + 0.5 = 96.4; 96.4 + 1.7 = 98.1; 98.1 + 1.9 = 100.0). Percent cells printed as a dash rule (meaning none) are rendered as "". The "Appendix" running head on the right edge is excluded. No footnote markers are legible on the headings of this continuation page; footnotes 1 and 2 are printed beneath the table and are presumably keyed from the caption on the preceding page.
Source image
Source data: U.S. NLRB Annual Reports (public domain). Reconstruction by NLRB Stats Archive. Read by claude-opus-5 (effort max, prompt extract_v1) from the 300-dpi scan; stitched by page. Updated October 2026.