NLRB Stats Archive › Annual Reports › FY1995 › Standard Federal Administrative Regional Distribution of Cases Received, Fiscal Year 1995
Standard Federal Administrative Regional Distribution of Cases Received, Fiscal Year 1995
Stitched from pp. 146–148.
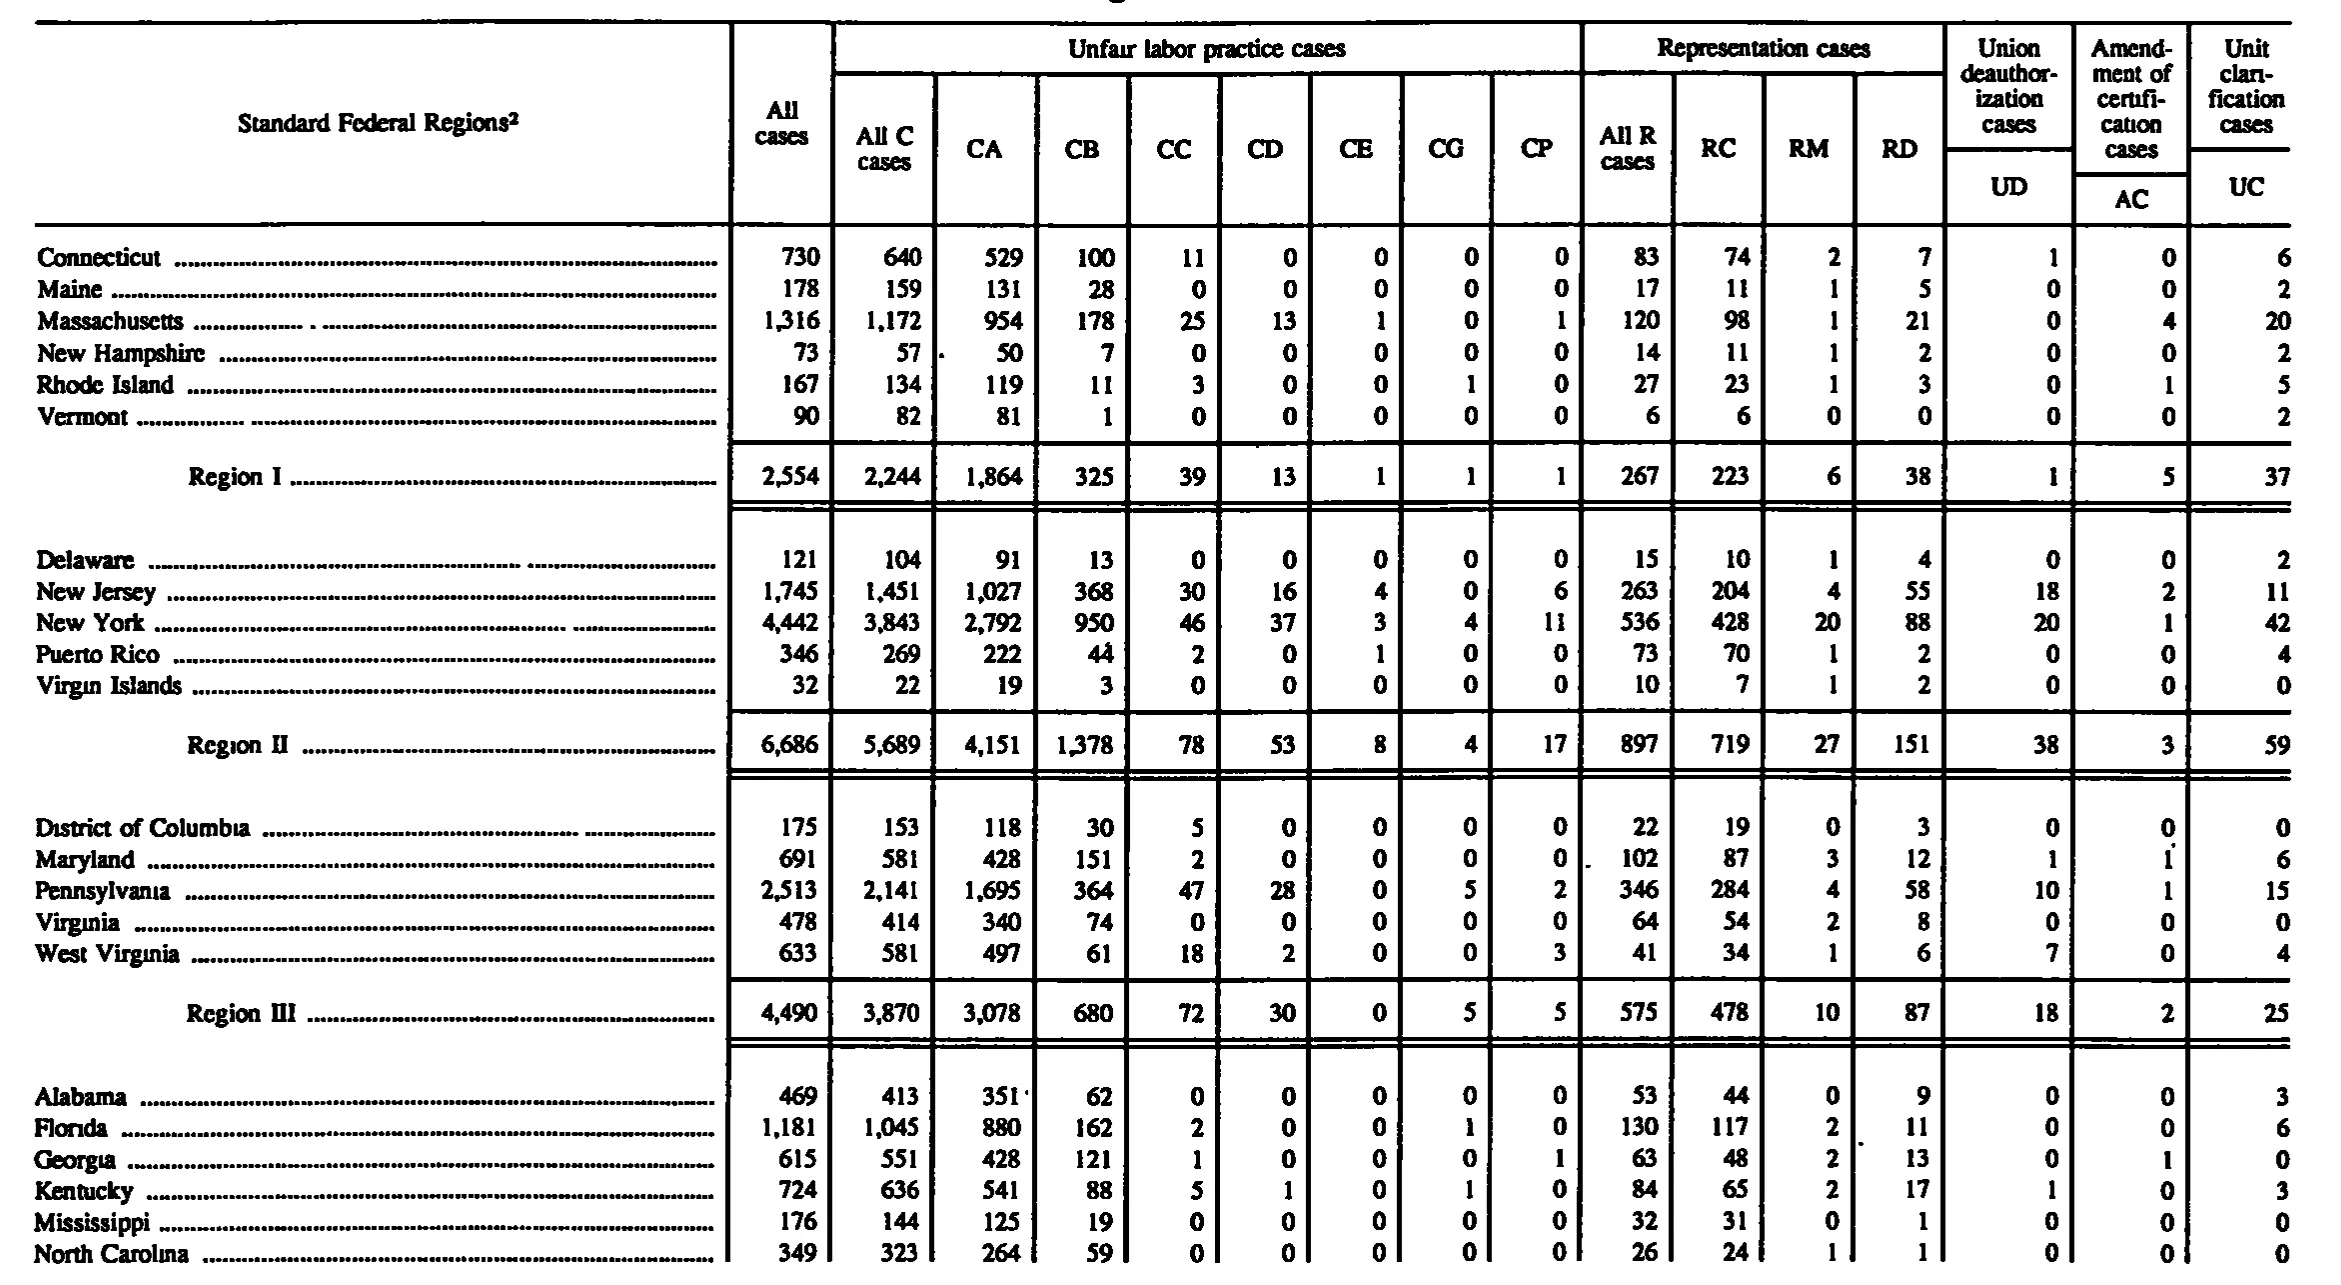
| Standard Federal Regions | All cases | Unfair labor practice cases | Representation cases | Union deauthorization cases | Amendment of certification cases | Unit clarification cases | ||||||||||
|---|---|---|---|---|---|---|---|---|---|---|---|---|---|---|---|---|
| Standard Federal Regions | All cases | All C cases | CA | CB | CC | CD | CE | CG | CP | All R cases | RC | RM | RD | Union deauthorization cases | Amendment of certification cases | Unit clarification cases |
| Standard Federal Regions | All cases | All C cases | CA | CB | CC | CD | CE | CG | CP | All R cases | RC | RM | RD | UD | AC | UC |
| Connecticut | 730 | 640 | 529 | 100 | 11 | 0 | 0 | 0 | 0 | 83 | 74 | 2 | 7 | 1 | 0 | 6 |
| Maine | 178 | 159 | 131 | 28 | 0 | 0 | 0 | 0 | 0 | 17 | 11 | 1 | 5 | 0 | 0 | 2 |
| Massachusetts | 1,316 | 1,172 | 954 | 178 | 25 | 13 | 1 | 0 | 1 | 120 | 98 | 1 | 21 | 0 | 4 | 20 |
| New Hampshire | 73 | 57 | 50 | 7 | 0 | 0 | 0 | 0 | 0 | 14 | 11 | 1 | 2 | 0 | 0 | 2 |
| Rhode Island | 167 | 134 | 119 | 11 | 3 | 0 | 0 | 1 | 0 | 27 | 23 | 1 | 3 | 0 | 1 | 5 |
| Vermont | 90 | 82 | 81 | 1 | 0 | 0 | 0 | 0 | 0 | 6 | 6 | 0 | 0 | 0 | 0 | 2 |
| Region I | 2,554 | 2,244 | 1,864 | 325 | 39 | 13 | 1 | 1 | 1 | 267 | 223 | 6 | 38 | 1 | 5 | 37 |
| Delaware | 121 | 104 | 91 | 13 | 0 | 0 | 0 | 0 | 0 | 15 | 10 | 1 | 4 | 0 | 0 | 2 |
| New Jersey | 1,745 | 1,451 | 1,027 | 368 | 30 | 16 | 4 | 0 | 6 | 263 | 204 | 4 | 55 | 18 | 2 | 11 |
| New York | 4,442 | 3,843 | 2,792 | 950 | 46 | 37 | 3 | 4 | 11 | 536 | 428 | 20 | 88 | 20 | 1 | 42 |
| Puerto Rico | 346 | 269 | 222 | 44 | 2 | 0 | 1 | 0 | 0 | 73 | 70 | 1 | 2 | 0 | 0 | 4 |
| Virgin Islands | 32 | 22 | 19 | 3 | 0 | 0 | 0 | 0 | 0 | 10 | 7 | 1 | 2 | 0 | 0 | 0 |
| Region II | 6,686 | 5,689 | 4,151 | 1,378 | 78 | 53 | 8 | 4 | 17 | 897 | 719 | 27 | 151 | 38 | 3 | 59 |
| District of Columbia | 175 | 153 | 118 | 30 | 5 | 0 | 0 | 0 | 0 | 22 | 19 | 0 | 3 | 0 | 0 | 0 |
| Maryland | 691 | 581 | 428 | 151 | 2 | 0 | 0 | 0 | 0 | 102 | 87 | 3 | 12 | 1 | 1 | 6 |
| Pennsylvania | 2,513 | 2,141 | 1,695 | 364 | 47 | 28 | 0 | 5 | 2 | 346 | 284 | 4 | 58 | 10 | 1 | 15 |
| Virginia | 478 | 414 | 340 | 74 | 0 | 0 | 0 | 0 | 0 | 64 | 54 | 2 | 8 | 0 | 0 | 0 |
| West Virginia | 633 | 581 | 497 | 61 | 18 | 2 | 0 | 0 | 3 | 41 | 34 | 1 | 6 | 7 | 0 | 4 |
| Region III | 4,490 | 3,870 | 3,078 | 680 | 72 | 30 | 0 | 5 | 5 | 575 | 478 | 10 | 87 | 18 | 2 | 25 |
| Alabama | 469 | 413 | 351 | 62 | 0 | 0 | 0 | 0 | 0 | 53 | 44 | 0 | 9 | 0 | 0 | 3 |
| Florida | 1,181 | 1,045 | 880 | 162 | 2 | 0 | 0 | 1 | 0 | 130 | 117 | 2 | 11 | 0 | 0 | 6 |
| Georgia | 615 | 551 | 428 | 121 | 1 | 0 | 0 | 0 | 1 | 63 | 48 | 2 | 13 | 0 | 1 | 0 |
| Kentucky | 724 | 636 | 541 | 88 | 5 | 1 | 0 | 1 | 0 | 84 | 65 | 2 | 17 | 1 | 0 | 3 |
| Mississippi | 176 | 144 | 125 | 19 | 0 | 0 | 0 | 0 | 0 | 32 | 31 | 0 | 1 | 0 | 0 | 0 |
| North Carolina | 349 | 323 | 264 | 59 | 0 | 0 | 0 | 0 | 0 | 26 | 24 | 1 | 1 | 0 | 0 | 0 |
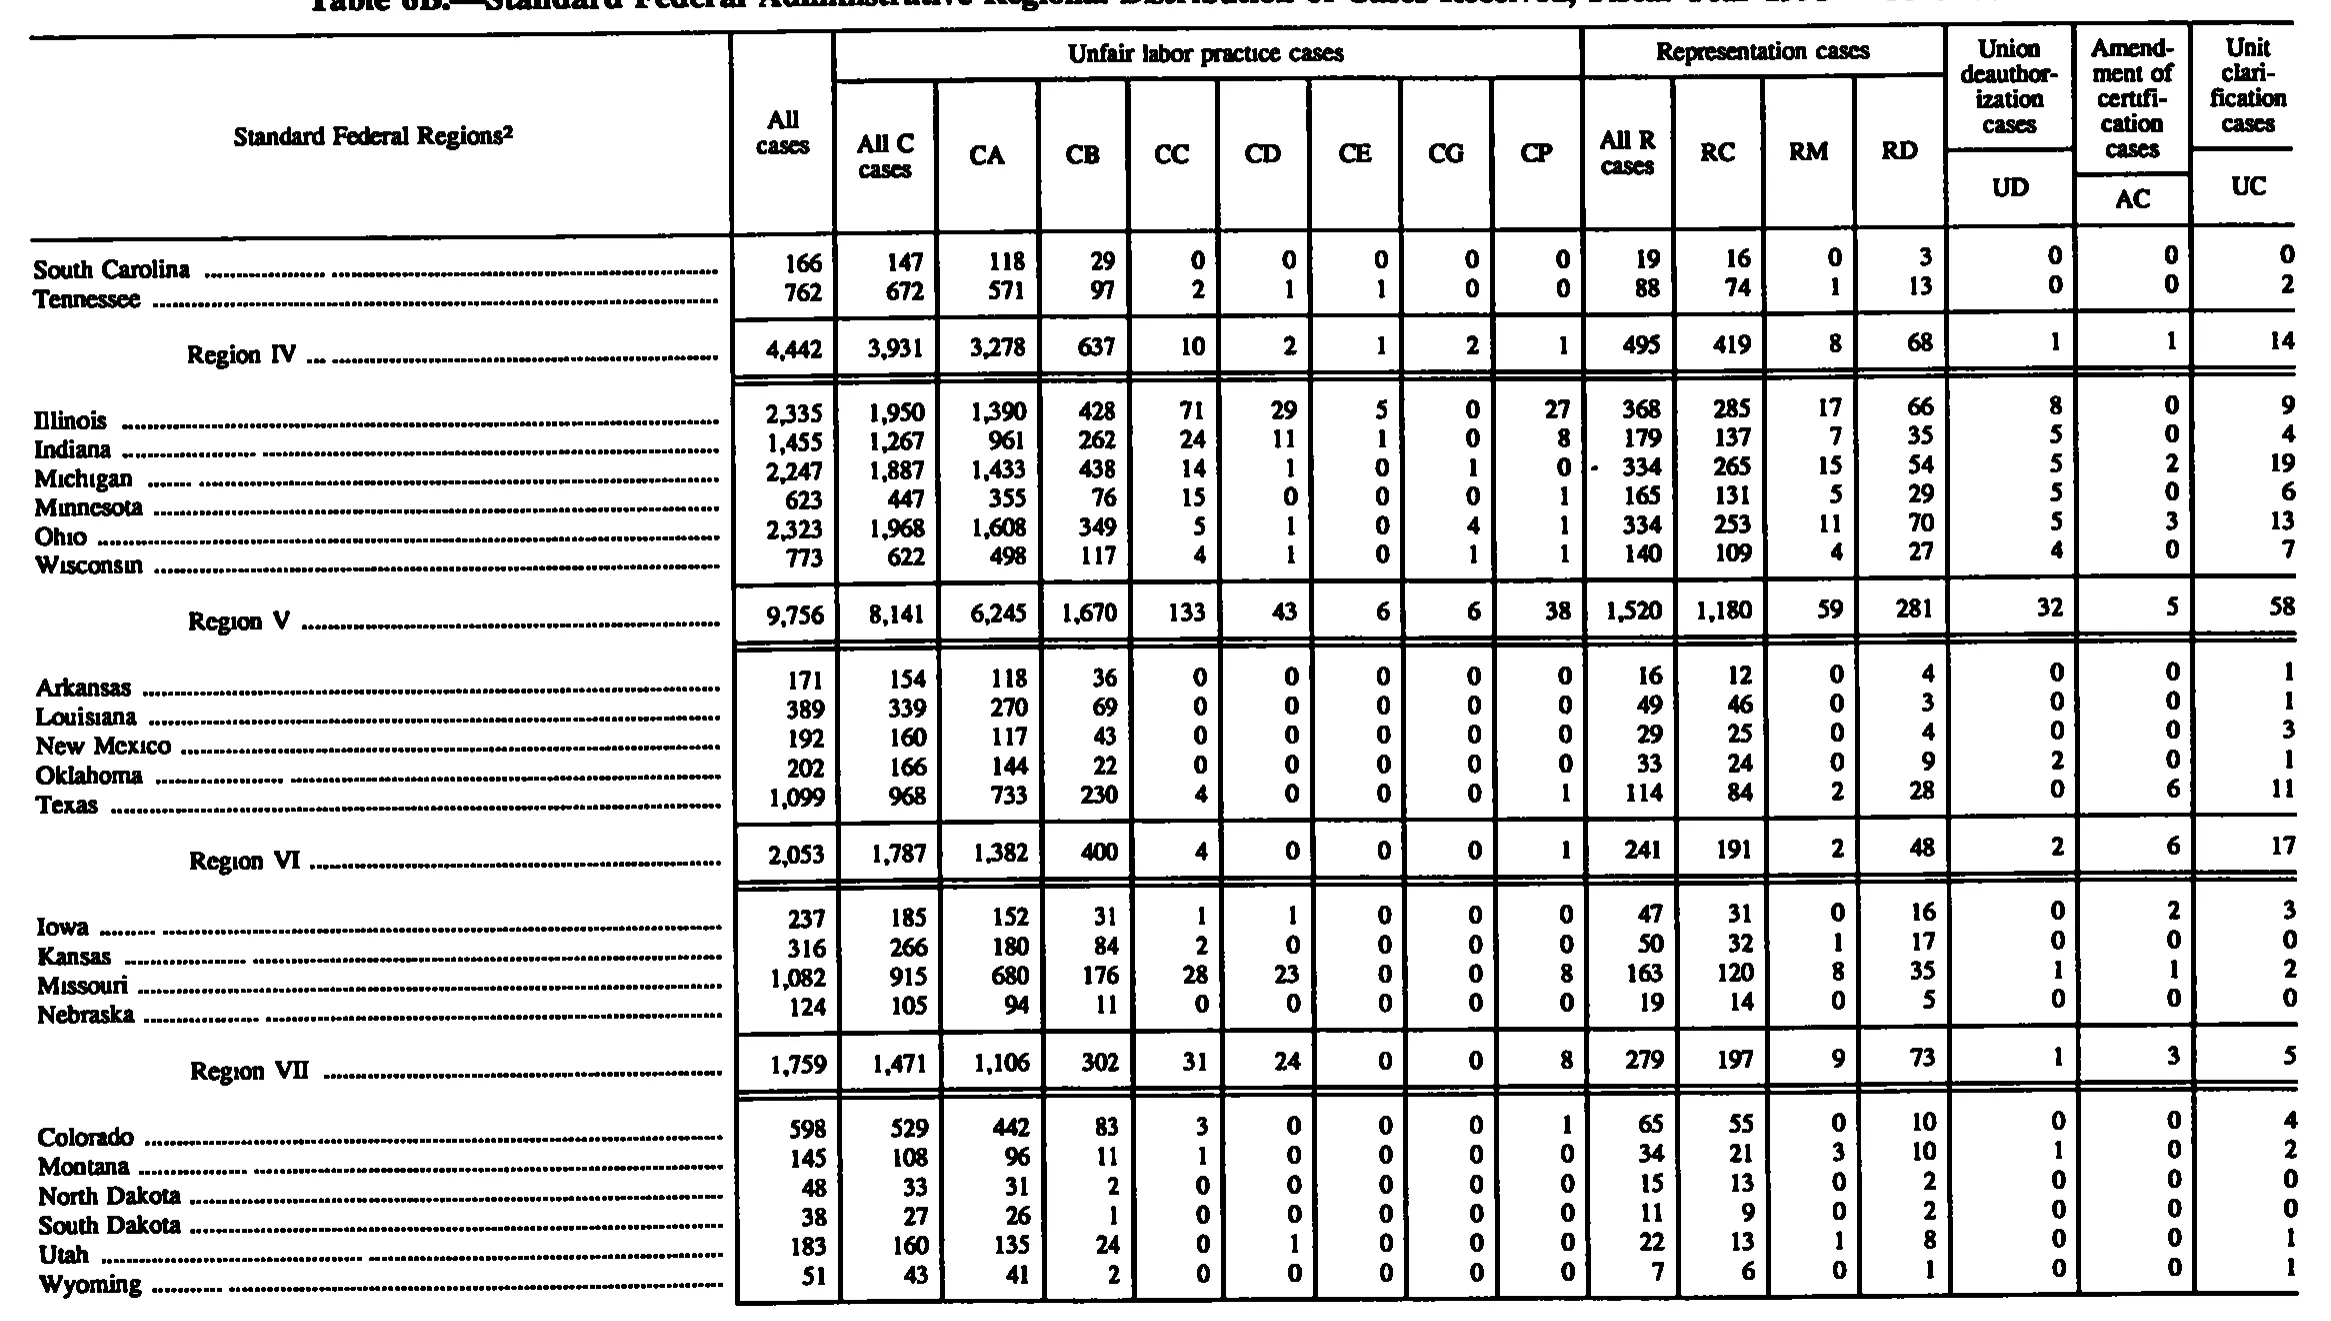
| South Carolina | 166 | 147 | 118 | 29 | 0 | 0 | 0 | 0 | 0 | 19 | 16 | 0 | 3 | 0 | 0 | 0 |
| Tennessee | 762 | 672 | 571 | 97 | 2 | 1 | 1 | 0 | 0 | 88 | 74 | 1 | 13 | 0 | 0 | 2 |
| Region IV | 4,442 | 3,931 | 3,278 | 637 | 10 | 2 | 1 | 2 | 1 | 495 | 419 | 8 | 68 | 1 | 1 | 14 |
| Illinois | 2,335 | 1,950 | 1,390 | 428 | 71 | 29 | 5 | 0 | 27 | 368 | 285 | 17 | 66 | 8 | 0 | 9 |
| Indiana | 1,455 | 1,267 | 961 | 262 | 24 | 11 | 1 | 0 | 8 | 179 | 137 | 7 | 35 | 5 | 0 | 4 |
| Michigan | 2,247 | 1,887 | 1,433 | 438 | 14 | 1 | 0 | 1 | 0 | 334 | 265 | 15 | 54 | 5 | 2 | 19 |
| Minnesota | 623 | 447 | 355 | 76 | 15 | 0 | 0 | 0 | 1 | 165 | 131 | 5 | 29 | 5 | 0 | 6 |
| Ohio | 2,323 | 1,968 | 1,608 | 349 | 5 | 1 | 0 | 4 | 1 | 334 | 253 | 11 | 70 | 5 | 3 | 13 |
| Wisconsin | 773 | 622 | 498 | 117 | 4 | 1 | 0 | 1 | 1 | 140 | 109 | 4 | 27 | 4 | 0 | 7 |
| Region V | 9,756 | 8,141 | 6,245 | 1,670 | 133 | 43 | 6 | 6 | 38 | 1,520 | 1,180 | 59 | 281 | 32 | 5 | 58 |
| Arkansas | 171 | 154 | 118 | 36 | 0 | 0 | 0 | 0 | 0 | 16 | 12 | 0 | 4 | 0 | 0 | 1 |
| Louisiana | 389 | 339 | 270 | 69 | 0 | 0 | 0 | 0 | 0 | 49 | 46 | 0 | 3 | 0 | 0 | 1 |
| New Mexico | 192 | 160 | 117 | 43 | 0 | 0 | 0 | 0 | 0 | 29 | 25 | 0 | 4 | 0 | 0 | 3 |
| Oklahoma | 202 | 166 | 144 | 22 | 0 | 0 | 0 | 0 | 0 | 33 | 24 | 0 | 9 | 2 | 0 | 1 |
| Texas | 1,099 | 968 | 733 | 230 | 4 | 0 | 0 | 0 | 1 | 114 | 84 | 2 | 28 | 0 | 6 | 11 |
| Region VI | 2,053 | 1,787 | 1,382 | 400 | 4 | 0 | 0 | 0 | 1 | 241 | 191 | 2 | 48 | 2 | 6 | 17 |
| Iowa | 237 | 185 | 152 | 31 | 1 | 1 | 0 | 0 | 0 | 47 | 31 | 0 | 16 | 0 | 2 | 3 |
| Kansas | 316 | 266 | 180 | 84 | 2 | 0 | 0 | 0 | 0 | 50 | 32 | 1 | 17 | 0 | 0 | 0 |
| Missouri | 1,082 | 915 | 680 | 176 | 28 | 23 | 0 | 0 | 8 | 163 | 120 | 8 | 35 | 1 | 1 | 2 |
| Nebraska | 124 | 105 | 94 | 11 | 0 | 0 | 0 | 0 | 0 | 19 | 14 | 0 | 5 | 0 | 0 | 0 |
| Region VII | 1,759 | 1,471 | 1,106 | 302 | 31 | 24 | 0 | 0 | 8 | 279 | 197 | 9 | 73 | 1 | 3 | 5 |
| Colorado | 598 | 529 | 442 | 83 | 3 | 0 | 0 | 0 | 1 | 65 | 55 | 0 | 10 | 0 | 0 | 4 |
| Montana | 145 | 108 | 96 | 11 | 1 | 0 | 0 | 0 | 0 | 34 | 21 | 3 | 10 | 1 | 0 | 2 |
| North Dakota | 48 | 33 | 31 | 2 | 0 | 0 | 0 | 0 | 0 | 15 | 13 | 0 | 2 | 0 | 0 | 0 |
| South Dakota | 38 | 27 | 26 | 1 | 0 | 0 | 0 | 0 | 0 | 11 | 9 | 0 | 2 | 0 | 0 | 0 |
| Utah | 183 | 160 | 135 | 24 | 0 | 1 | 0 | 0 | 0 | 22 | 13 | 1 | 8 | 0 | 0 | 1 |
| Wyoming | 51 | 43 | 41 | 2 | 0 | 0 | 0 | 0 | 0 | 7 | 6 | 0 | 1 | 0 | 0 | 1 |
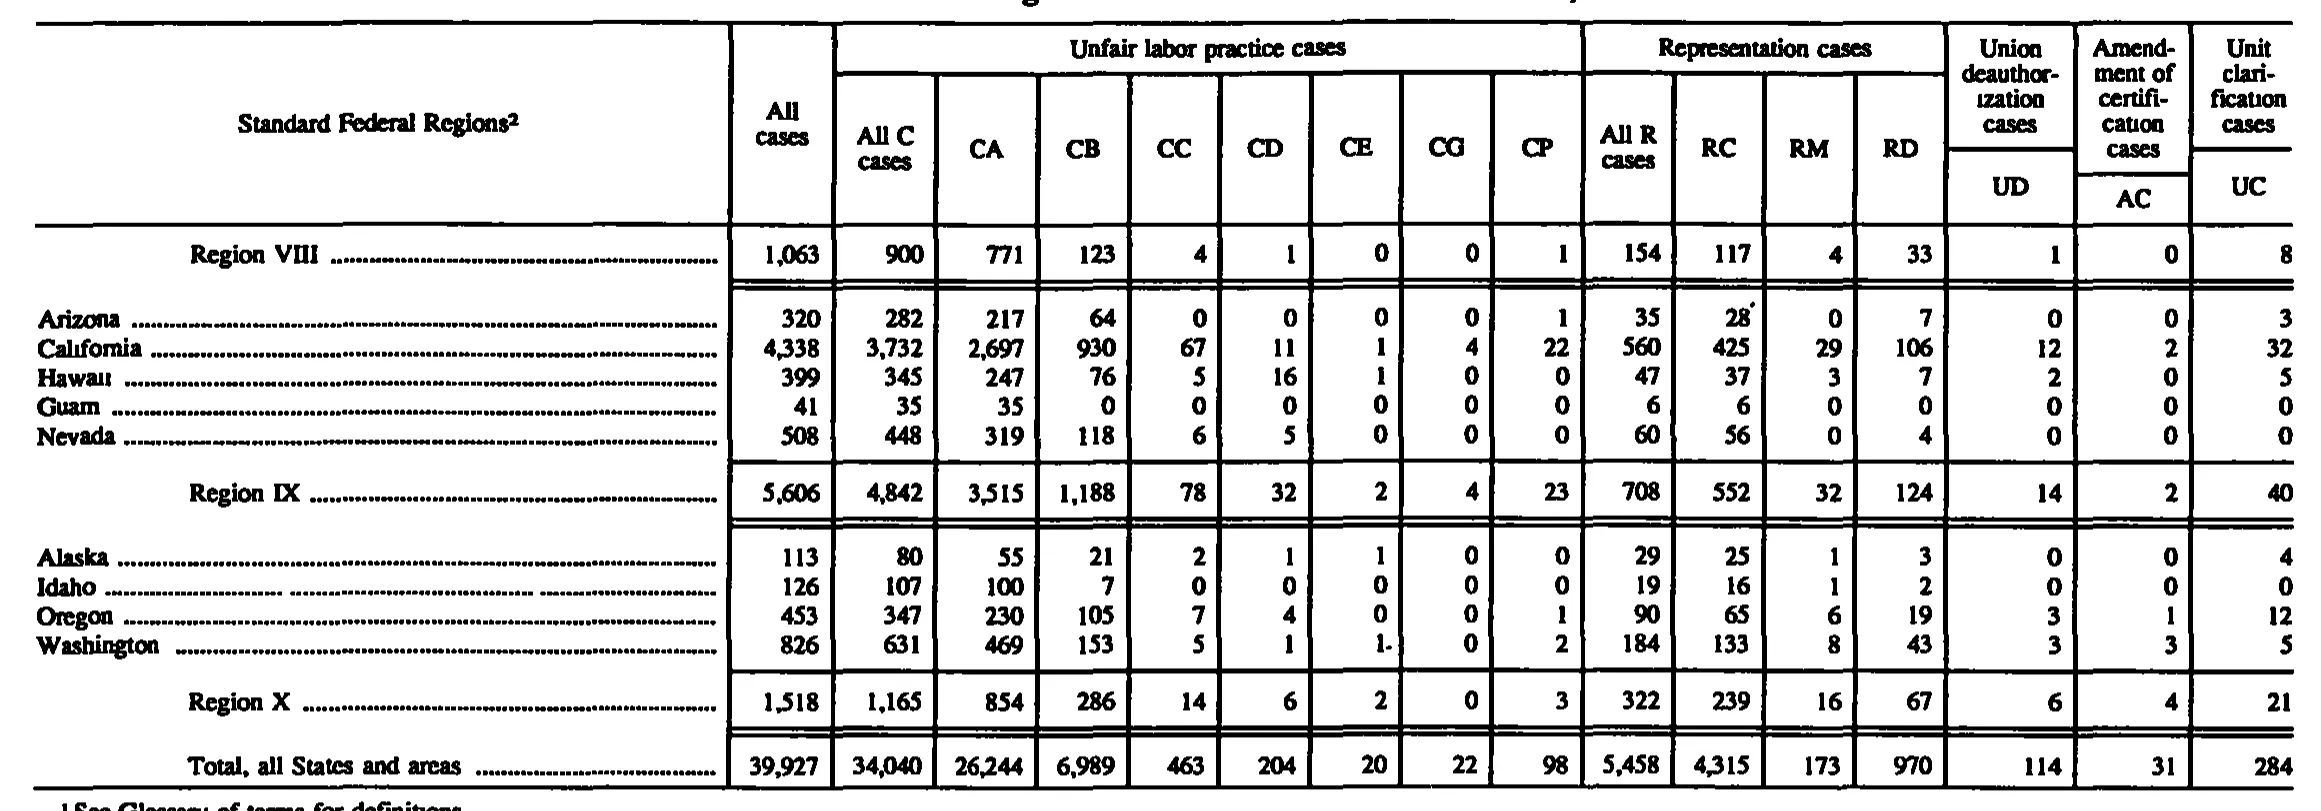
| Region VIII | 1,063 | 900 | 771 | 123 | 4 | 1 | 0 | 0 | 1 | 154 | 117 | 4 | 33 | 1 | 0 | 8 |
| Arizona | 320 | 282 | 217 | 64 | 0 | 0 | 0 | 0 | 1 | 35 | 28 | 0 | 7 | 0 | 0 | 3 |
| California | 4,338 | 3,732 | 2,697 | 930 | 67 | 11 | 1 | 4 | 22 | 560 | 425 | 29 | 106 | 12 | 2 | 32 |
| Hawaii | 399 | 345 | 247 | 76 | 5 | 16 | 1 | 0 | 0 | 47 | 37 | 3 | 7 | 2 | 0 | 5 |
| Guam | 41 | 35 | 35 | 0 | 0 | 0 | 0 | 0 | 0 | 6 | 6 | 0 | 0 | 0 | 0 | 0 |
| Nevada | 508 | 448 | 319 | 118 | 6 | 5 | 0 | 0 | 0 | 60 | 56 | 0 | 4 | 0 | 0 | 0 |
| Region IX | 5,606 | 4,842 | 3,515 | 1,188 | 78 | 32 | 2 | 4 | 23 | 708 | 552 | 32 | 124 | 14 | 2 | 40 |
| Alaska | 113 | 80 | 55 | 21 | 2 | 1 | 1 | 0 | 0 | 29 | 25 | 1 | 3 | 0 | 0 | 4 |
| Idaho | 126 | 107 | 100 | 7 | 0 | 0 | 0 | 0 | 0 | 19 | 16 | 1 | 2 | 0 | 0 | 0 |
| Oregon | 453 | 347 | 230 | 105 | 7 | 4 | 0 | 0 | 1 | 90 | 65 | 6 | 19 | 3 | 1 | 12 |
| Washington | 826 | 631 | 469 | 153 | 5 | 1 | 1 | 0 | 2 | 184 | 133 | 8 | 43 | 3 | 3 | 5 |
| Region X | 1,518 | 1,165 | 854 | 286 | 14 | 6 | 2 | 0 | 3 | 322 | 239 | 16 | 67 | 6 | 4 | 21 |
| Total, all States and areas | 39,927 | 34,040 | 26,244 | 6,989 | 463 | 204 | 20 | 22 | 98 | 5,458 | 4,315 | 173 | 970 | 114 | 31 | 284 |
- 1 See Glossary of terms for definitions.
743 of 743 figures sit in a row or column sum that works out.
Reader’s notes
p. 146. The crop is cut off at the bottom: the body ends mid-section with "North Carolina" (the fourth region's state list and its "Region IV" total line are not shown), and no footnotes are visible on this image. The top of the crop clips a line of the caption/title; only the column headings are legible, so the caption is not transcribed. The stub heading carries a raised 2 footnote marker ("Standard Federal Regions^2") whose footnote text is not on this crop. Structure: 17 printed columns. "Unfair labor practice cases" spans the eight columns All C cases through CP; "Representation cases" spans All R cases through RD; the last three columns each have a tall descriptive heading over a short code (UD, AC, UC), so those descriptive headings are repeated in the first two heading levels. Scan artifacts, none of which changed a reading: a stray ink speck sits just right of "57" in the New Hampshire All C cases cell and just right of "351" in the Alabama CA cell; a faint dot appears left of "102" (Maryland, All R cases) and right of "2" (Florida, RM). The Maryland AC value is a thin "1" with a speck above it. All row and region totals cross-foot correctly against their components, which supports the digit readings.
p. 147. The crop is a middle portion of a continued table: it begins partway through the Region IV state list (states before South Carolina are on the preceding page) and ends after Wyoming without the region total row for the last block (presumably Region VIII), which is cut off below the crop. The stub heading carries footnote marker 2, but no footnote text appears within this crop, so `footnotes` is empty. In the Michigan row there is a short stray dash-like mark printed just to the left of 334 in the "All R cases" column (between the CP rule and the figure). It appears to be a scanning/printing artifact rather than a minus sign or a footnote marker, so it has not been transcribed; the value is read as 334. All figures were checked for internal consistency and the table is arithmetically coherent as transcribed: for every state row CA+CB+CC+CD+CE+CG+CP equals "All C cases", RC+RM+RD equals "All R cases", and "All C cases"+"All R cases"+UD+AC+UC equals "All cases". Each region total row (IV, V, VI, VII) also equals the column-wise sum of its listed states, including Region IV once the states carried over from the previous page are accounted for — Region IV's trailing values (UD 1, AC 1, UC 14) sit slightly left of the UD/AC/UC alignment used in the data rows, but the totals confirm the column placement.
p. 148. This crop continues a table from the preceding page: the first body row is the \"Region VIII\" subtotal, whose constituent State rows are printed on the earlier page and are not in this image.\n\nThe footnote line at the foot of the page is clipped by the bottom edge of the crop; only the top halves of the letters of \"1 See Glossary of terms for definitions.\" are visible, so the wording is read from the partial letterforms and the trailing period is inferred. The stub heading carries a raised marker 2 (\"Standard Federal Regions^2\"), but no text for footnote 2 appears within the crop.\n\nTwo cells carry stray scanner marks that are not footnote markers and not part of the value: Arizona, column RC, where \"28\" is followed by a small raised speck; and Washington, column CE, where \"1\" is followed by a short dash-like mark. Both are transcribed as the bare digits.\n\nScan degradation affects two row labels: \"California\" prints with a broken \"rn\" that reads as \"Califomia\", and \"Hawaii\" prints with dotless i's; both are transcribed with the intended spelling. The \"i\" in the \"Union deauthorization cases\" and \"Amendment of certification cases\" headings is likewise dotless in the scan.\n\nAll arithmetic in the image is internally consistent as printed: for every State row the seven C-case columns sum to \"All C cases\" and the five case-type totals sum to \"All cases\"; Region IX equals the sum of its five State rows and Region X the sum of its four State rows in all sixteen numeric columns; and in the grand total row 26,244+6,989+463+204+20+22+98 = 34,040, 4,315+173+970 = 5,458, and 34,040+5,458+114+31+284 = 39,927. No misprint was detected.
Source image
Source data: U.S. NLRB Annual Reports (public domain). Reconstruction by NLRB Stats Archive. Read by claude-opus-5 (effort max, prompt extract_v1) from the 300-dpi scan; stitched by page. Updated October 2026.