NLRB Stats Archive › Annual Reports › FY1994 › Proceedings Decided by Circuit Courts of Appeals on Petitions for Enforcement and/or Review of Board Orders, Fiscal Year 1994, Compared With 5-Year Cumulative Totals, Fiscal Years 1989 Through 1993
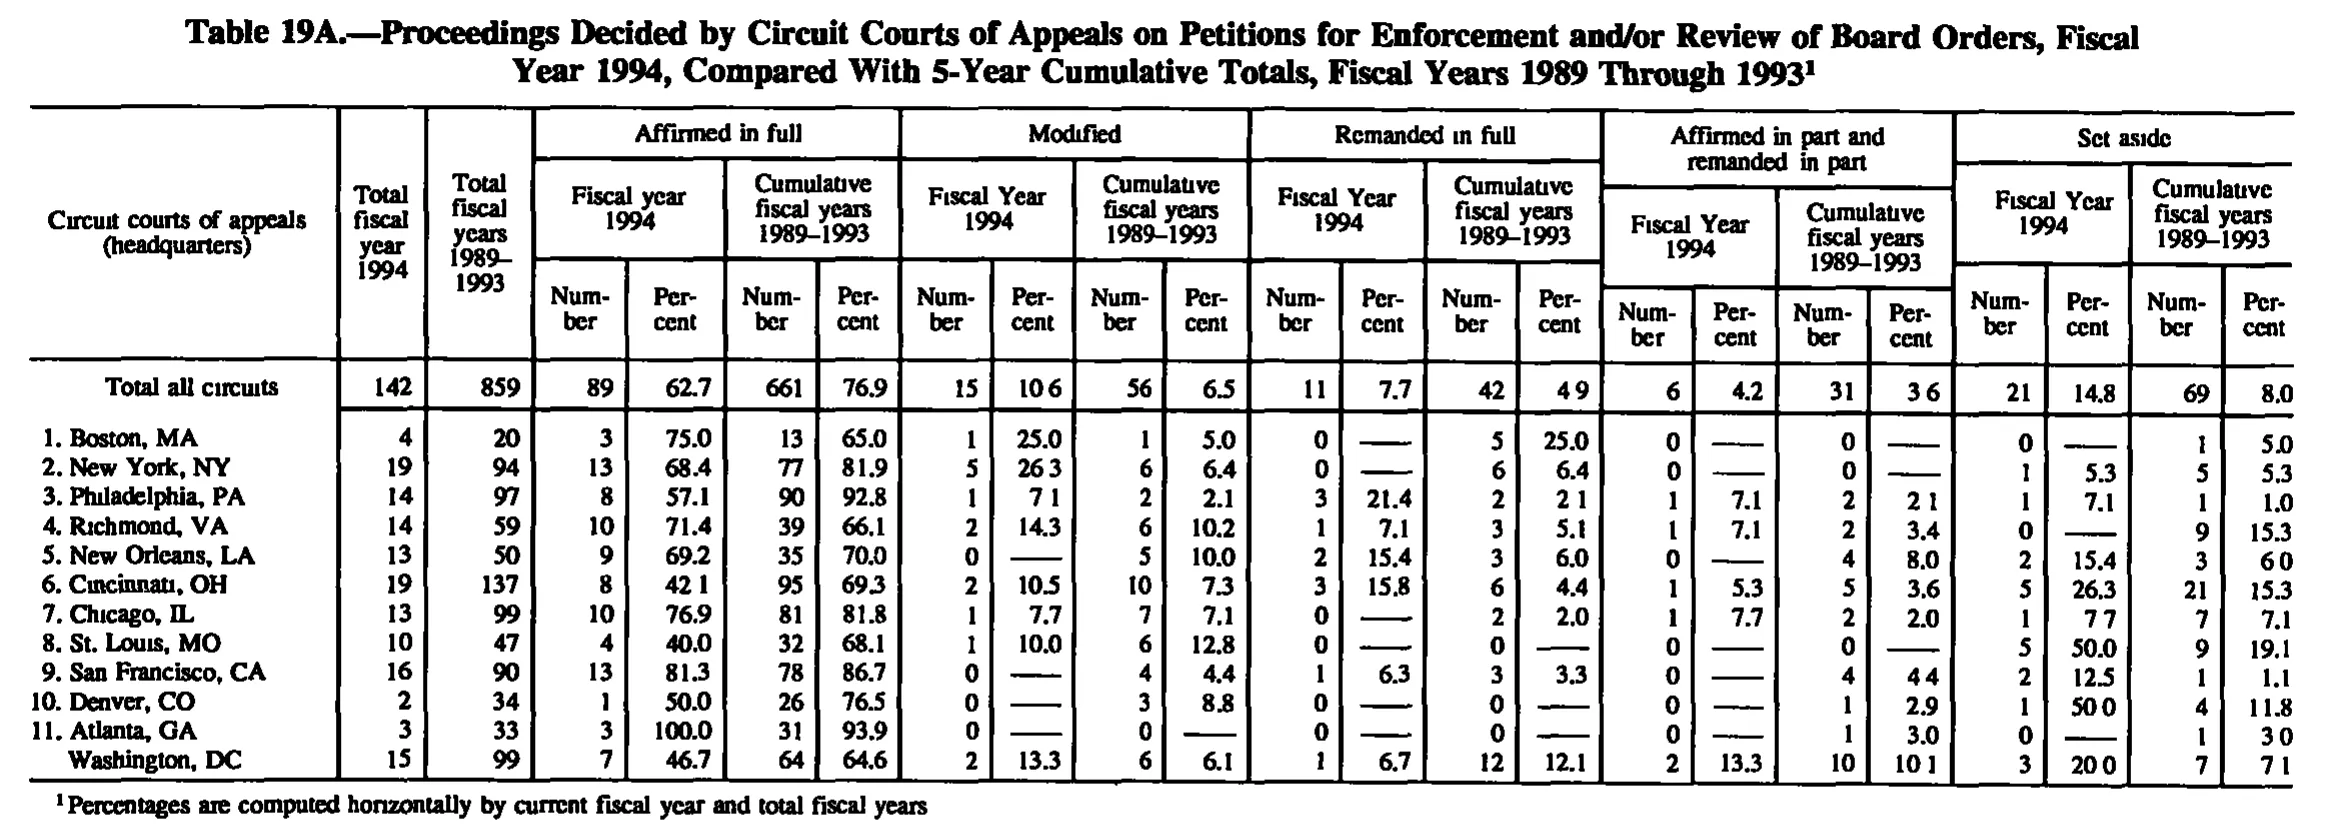
Proceedings Decided by Circuit Courts of Appeals on Petitions for Enforcement and/or Review of Board Orders, Fiscal Year 1994, Compared With 5-Year Cumulative Totals, Fiscal Years 1989 Through 1993
| Circuit courts of appeals (headquarters) | Total fiscal year 1994 | Total fiscal years 1989-1993 | Affirmed in full | Modified | Remanded in full | Affirmed in part and remanded in part | Set aside | |||||||||||||||
|---|---|---|---|---|---|---|---|---|---|---|---|---|---|---|---|---|---|---|---|---|---|---|
| Circuit courts of appeals (headquarters) | Total fiscal year 1994 | Total fiscal years 1989-1993 | Fiscal year 1994 | Cumulative fiscal years 1989-1993 | Fiscal Year 1994 | Cumulative fiscal years 1989-1993 | Fiscal Year 1994 | Cumulative fiscal years 1989-1993 | Fiscal Year 1994 | Cumulative fiscal years 1989-1993 | Fiscal Year 1994 | Cumulative fiscal years 1989-1993 | ||||||||||
| Circuit courts of appeals (headquarters) | Total fiscal year 1994 | Total fiscal years 1989-1993 | Number | Percent | Number | Percent | Number | Percent | Number | Percent | Number | Percent | Number | Percent | Number | Percent | Number | Percent | Number | Percent | Number | Percent |
| Total all circuits | 142 | 859 | 89 | 62.7 | 661 | 76.9 | 15 | 10.6 | 56 | 6.5 | 11 | 7.7 | 42 | 4.9 | 6 | 4.2 | 31 | 3.6 | 21 | 14.8 | 69 | 8.0 |
| 1. Boston, MA | 4 | 20 | 3 | 75.0 | 13 | 65.0 | 1 | 25.0 | 1 | 5.0 | 0 | 5 | 25.0 | 0 | 0 | 0 | 1 | 5.0 | ||||
| 2. New York, NY | 19 | 94 | 13 | 68.4 | 77 | 81.9 | 5 | 26.3 | 6 | 6.4 | 0 | 6 | 6.4 | 0 | 0 | 1 | 5.3 | 5 | 5.3 | |||
| 3. Philadelphia, PA | 14 | 97 | 8 | 57.1 | 90 | 92.8 | 1 | 7.1 | 2 | 2.1 | 3 | 21.4 | 2 | 2.1 | 1 | 7.1 | 2 | 2.1 | 1 | 7.1 | 1 | 1.0 |
| 4. Richmond, VA | 14 | 59 | 10 | 71.4 | 39 | 66.1 | 2 | 14.3 | 6 | 10.2 | 1 | 7.1 | 3 | 5.1 | 1 | 7.1 | 2 | 3.4 | 0 | 9 | 15.3 | |
| 5. New Orleans, LA | 13 | 50 | 9 | 69.2 | 35 | 70.0 | 0 | 5 | 10.0 | 2 | 15.4 | 3 | 6.0 | 0 | 4 | 8.0 | 2 | 15.4 | 3 | 6.0 | ||
| 6. Cincinnati, OH | 19 | 137 | 8 | 42.1 | 95 | 69.3 | 2 | 10.5 | 10 | 7.3 | 3 | 15.8 | 6 | 4.4 | 1 | 5.3 | 5 | 3.6 | 5 | 26.3 | 21 | 15.3 |
| 7. Chicago, IL | 13 | 99 | 10 | 76.9 | 81 | 81.8 | 1 | 7.7 | 7 | 7.1 | 0 | 2 | 2.0 | 1 | 7.7 | 2 | 2.0 | 1 | 7.7 | 7 | 7.1 | |
| 8. St. Louis, MO | 10 | 47 | 4 | 40.0 | 32 | 68.1 | 1 | 10.0 | 6 | 12.8 | 0 | 0 | 0 | 0 | 5 | 50.0 | 9 | 19.1 | ||||
| 9. San Francisco, CA | 16 | 90 | 13 | 81.3 | 78 | 86.7 | 0 | 4 | 4.4 | 1 | 6.3 | 3 | 3.3 | 0 | 4 | 4.4 | 2 | 12.5 | 1 | 1.1 | ||
| 10. Denver, CO | 2 | 34 | 1 | 50.0 | 26 | 76.5 | 0 | 3 | 8.8 | 0 | 0 | 0 | 1 | 2.9 | 1 | 50.0 | 4 | 11.8 | ||||
| 11. Atlanta, GA | 3 | 33 | 3 | 100.0 | 31 | 93.9 | 0 | 0 | 0 | 0 | 0 | 1 | 3.0 | 0 | 1 | 3.0 | ||||||
| Washington, DC | 15 | 99 | 7 | 46.7 | 64 | 64.6 | 2 | 13.3 | 6 | 6.1 | 1 | 6.7 | 12 | 12.1 | 2 | 13.3 | 10 | 10.1 | 3 | 20.0 | 7 | 7.1 |
- 1 Percentages are computed horizontally by current fiscal year and total fiscal years
129 of 129 figures sit in a row or column sum that works out.
Reader’s notes
p. 157. 23 columns: stub, two "Total" columns, then five outcome groups (Affirmed in full; Modified; Remanded in full; Affirmed in part and remanded in part; Set aside), each with Fiscal Year 1994 Number/Percent and Cumulative fiscal years 1989-1993 Number/Percent. Decimal points in the percent columns are frequently lost or reduced to a faint gap in this scan, so several cells read as e.g. "10 6", "4 9", "3 6", "26 3", "42 1", "7 7", "4 4", "50 0", "3 0", "10 1", "20 0", "7 1". Because every value in those columns is printed to one decimal place, I have restored the decimal point in each case. Affected cells include: Total all circuits (Modified/FY1994/Percent, Remanded in full/Cumulative/Percent, Affirmed in part/Cumulative/Percent); New York (Modified/FY1994/Percent); Philadelphia (Modified/FY1994/Percent); Cincinnati (Affirmed in full/FY1994/Percent); Chicago (Set aside/FY1994/Percent); San Francisco (Affirmed in part/Cumulative/Percent); Denver (Set aside/FY1994/Percent); Atlanta (Set aside/Cumulative/Percent); Washington, DC (Affirmed in part/Cumulative/Percent, Set aside/FY1994/Percent, Set aside/Cumulative/Percent). The digits themselves are legible; only the point placement is inferred, and it is unambiguous since each value has exactly one digit after the gap. Em-dash rules ("——"), used where a percent is not applicable because the corresponding count is 0, are transcribed as empty cells. The final body row, "Washington, DC", is printed without a circuit number (the D.C. Circuit), unlike the eleven numbered rows above it; it is transcribed as printed. Heading capitalisation varies as printed: "Fiscal year 1994" (lowercase "year") under "Affirmed in full", but "Fiscal Year 1994" under the other four groups. The caption carries footnote marker 1, which keys the single footnote below the table; the caption itself is omitted per instructions. No footnote markers appear on any body value or row label.
Source image
Source data: U.S. NLRB Annual Reports (public domain). Reconstruction by NLRB Stats Archive. Read by claude-opus-5 (effort max, prompt extract_v1) from the 300-dpi scan; stitched by page. Updated October 2026.