NLRB Stats Archive › Annual Reports › FY1994 › Distribution of Unfair Labor Practice Situations Received, by Number of Employees in Establishments, Fiscal Year 1994
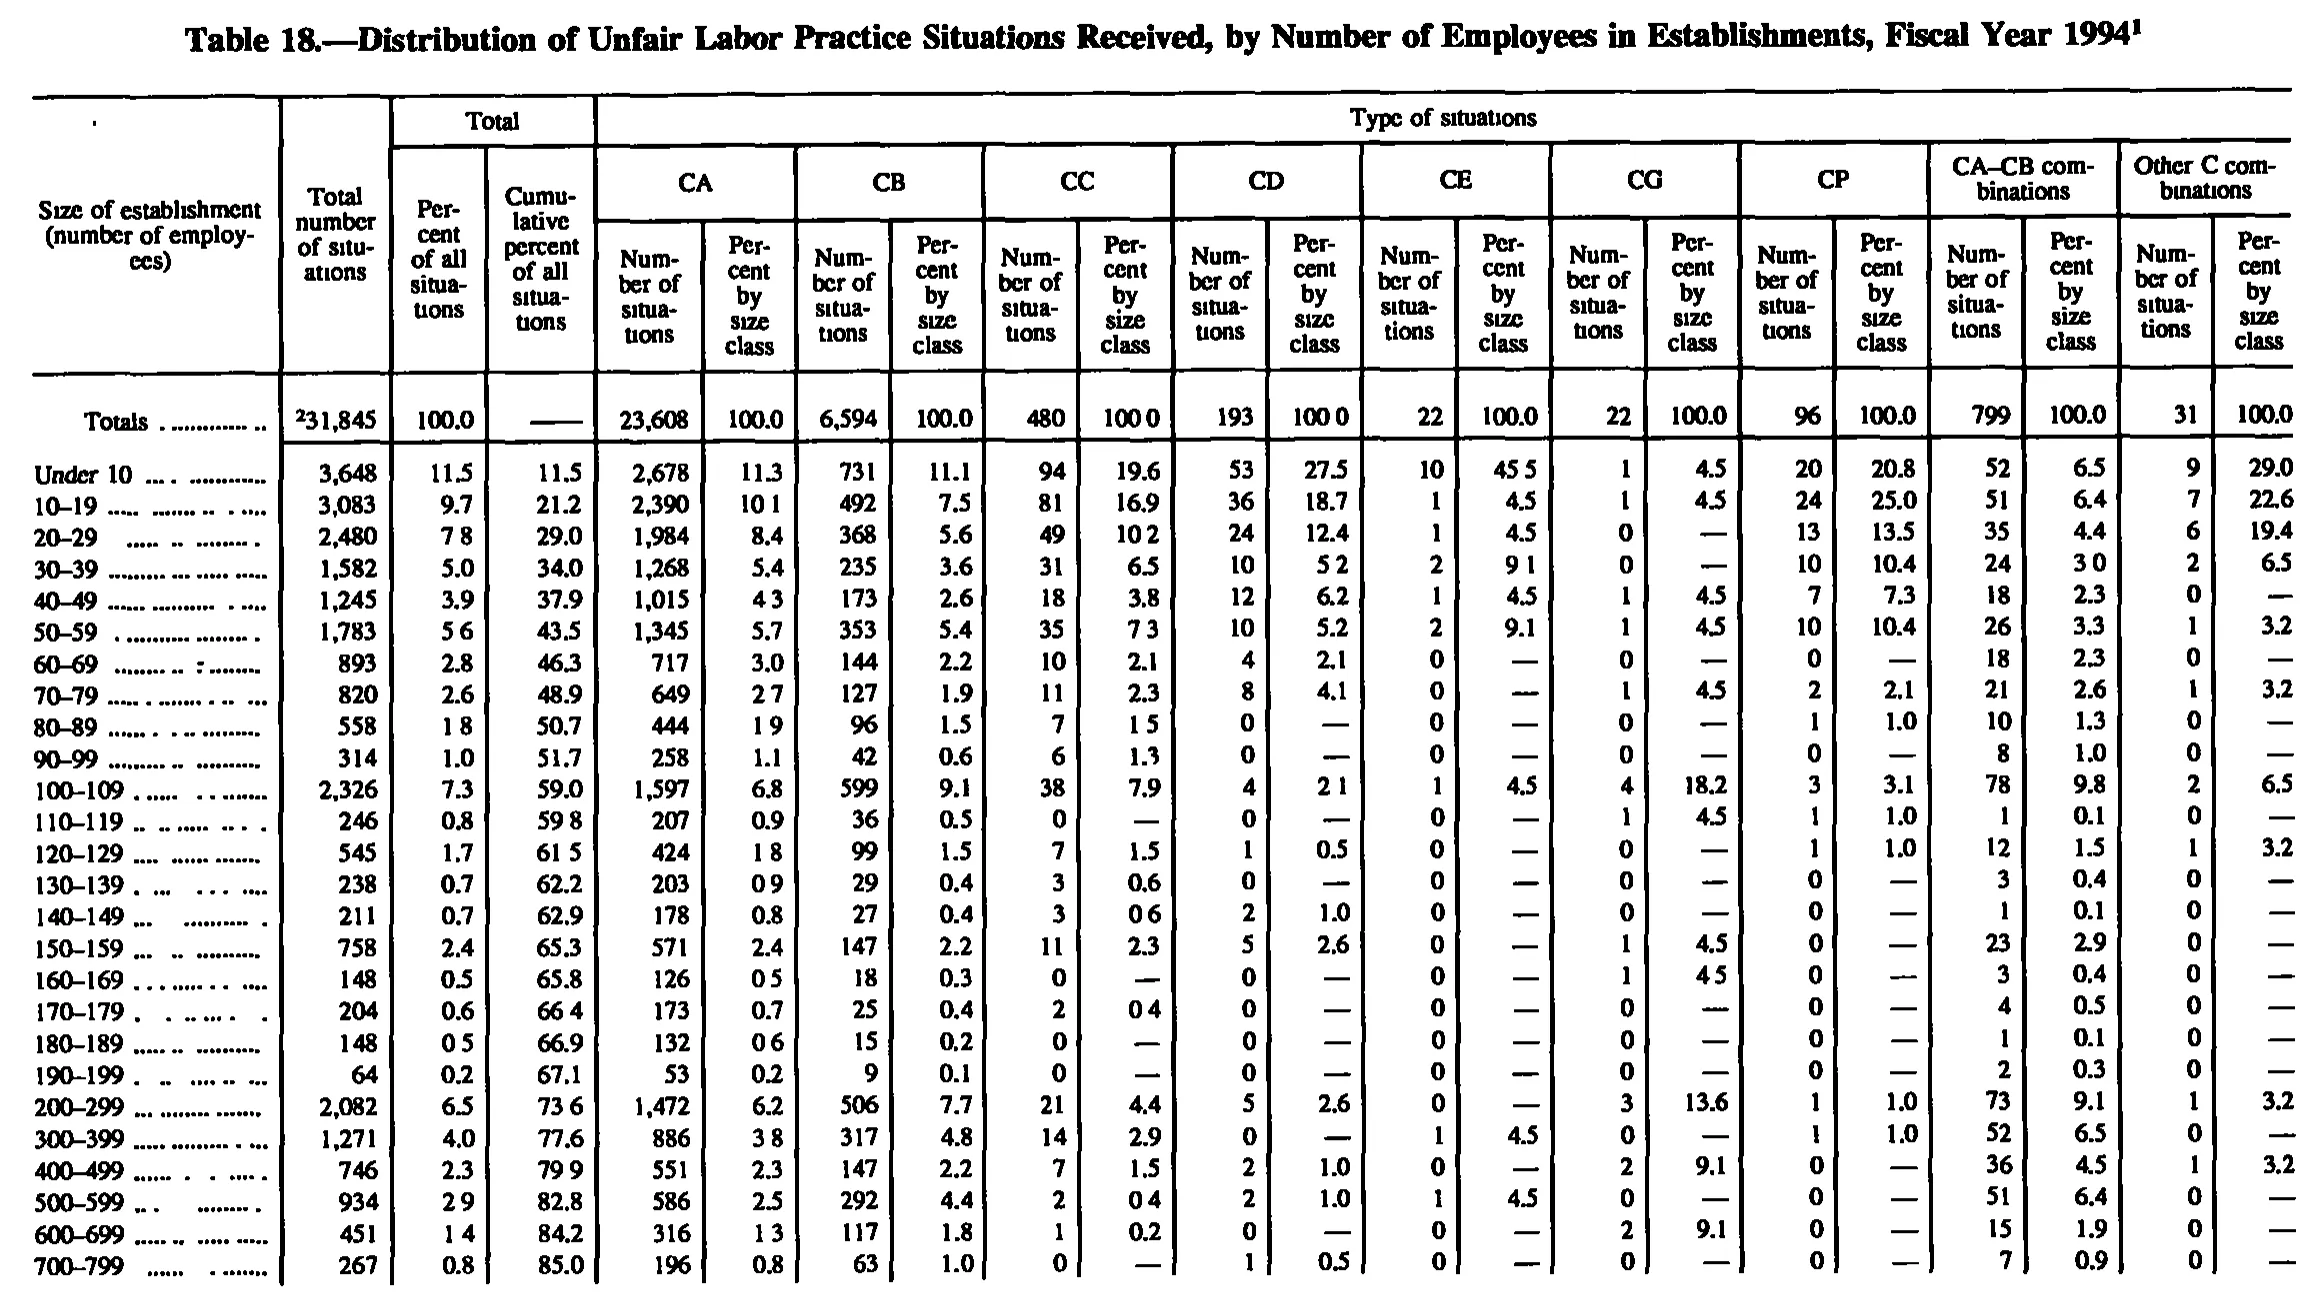
Distribution of Unfair Labor Practice Situations Received, by Number of Employees in Establishments, Fiscal Year 1994
Stitched from pp. 154–155.
| Size of establishment (number of employees) | Total number of situations | Total | Type of situations | ||||||||||||||||||
|---|---|---|---|---|---|---|---|---|---|---|---|---|---|---|---|---|---|---|---|---|---|
| Size of establishment (number of employees) | Total number of situations | Percent of all situations | Cumulative percent of all situations | CA | CB | CC | CD | CE | CG | CP | CA–CB combinations | Other C combinations | |||||||||
| Size of establishment (number of employees) | Total number of situations | Percent of all situations | Cumulative percent of all situations | Number of situations | Percent by size class | Number of situations | Percent by size class | Number of situations | Percent by size class | Number of situations | Percent by size class | Number of situations | Percent by size class | Number of situations | Percent by size class | Number of situations | Percent by size class | Number of situations | Percent by size class | Number of situations | Percent by size class |
| Totals | 31,845 | 100.0 | 23,608 | 100.0 | 6,594 | 100.0 | 480 | 100.0 | 193 | 100.0 | 22 | 100.0 | 22 | 100.0 | 96 | 100.0 | 799 | 100.0 | 31 | 100.0 | |
| Under 10 | 3,648 | 11.5 | 11.5 | 2,678 | 11.3 | 731 | 11.1 | 94 | 19.6 | 53 | 27.5 | 10 | 45.5 | 1 | 4.5 | 20 | 20.8 | 52 | 6.5 | 9 | 29.0 |
| 10–19 | 3,083 | 9.7 | 21.2 | 2,390 | 10.1 | 492 | 7.5 | 81 | 16.9 | 36 | 18.7 | 1 | 4.5 | 1 | 4.5 | 24 | 25.0 | 51 | 6.4 | 7 | 22.6 |
| 20–29 | 2,480 | 7.8 | 29.0 | 1,984 | 8.4 | 368 | 5.6 | 49 | 10.2 | 24 | 12.4 | 1 | 4.5 | 0 | 13 | 13.5 | 35 | 4.4 | 6 | 19.4 | |
| 30–39 | 1,582 | 5.0 | 34.0 | 1,268 | 5.4 | 235 | 3.6 | 31 | 6.5 | 10 | 5.2 | 2 | 9.1 | 0 | 10 | 10.4 | 24 | 3.0 | 2 | 6.5 | |
| 40–49 | 1,245 | 3.9 | 37.9 | 1,015 | 4.3 | 173 | 2.6 | 18 | 3.8 | 12 | 6.2 | 1 | 4.5 | 1 | 4.5 | 7 | 7.3 | 18 | 2.3 | 0 | |
| 50–59 | 1,783 | 5.6 | 43.5 | 1,345 | 5.7 | 353 | 5.4 | 35 | 7.3 | 10 | 5.2 | 2 | 9.1 | 1 | 4.5 | 10 | 10.4 | 26 | 3.3 | 1 | 3.2 |
| 60–69 | 893 | 2.8 | 46.3 | 717 | 3.0 | 144 | 2.2 | 10 | 2.1 | 4 | 2.1 | 0 | 0 | 0 | 18 | 2.3 | 0 | ||||
| 70–79 | 820 | 2.6 | 48.9 | 649 | 2.7 | 127 | 1.9 | 11 | 2.3 | 8 | 4.1 | 0 | 1 | 4.5 | 2 | 2.1 | 21 | 2.6 | 1 | 3.2 | |
| 80–89 | 558 | 1.8 | 50.7 | 444 | 1.9 | 96 | 1.5 | 7 | 1.5 | 0 | 0 | 0 | 1 | 1.0 | 10 | 1.3 | 0 | ||||
| 90–99 | 314 | 1.0 | 51.7 | 258 | 1.1 | 42 | 0.6 | 6 | 1.3 | 0 | 0 | 0 | 0 | 8 | 1.0 | 0 | |||||
| 100–109 | 2,326 | 7.3 | 59.0 | 1,597 | 6.8 | 599 | 9.1 | 38 | 7.9 | 4 | 2.1 | 1 | 4.5 | 4 | 18.2 | 3 | 3.1 | 78 | 9.8 | 2 | 6.5 |
| 110–119 | 246 | 0.8 | 59.8 | 207 | 0.9 | 36 | 0.5 | 0 | 0 | 0 | 1 | 4.5 | 1 | 1.0 | 1 | 0.1 | 0 | ||||
| 120–129 | 545 | 1.7 | 61.5 | 424 | 1.8 | 99 | 1.5 | 7 | 1.5 | 1 | 0.5 | 0 | 0 | 1 | 1.0 | 12 | 1.5 | 1 | 3.2 | ||
| 130–139 | 238 | 0.7 | 62.2 | 203 | 0.9 | 29 | 0.4 | 3 | 0.6 | 0 | 0 | 0 | 0 | 3 | 0.4 | 0 | |||||
| 140–149 | 211 | 0.7 | 62.9 | 178 | 0.8 | 27 | 0.4 | 3 | 0.6 | 2 | 1.0 | 0 | 0 | 0 | 1 | 0.1 | 0 | ||||
| 150–159 | 758 | 2.4 | 65.3 | 571 | 2.4 | 147 | 2.2 | 11 | 2.3 | 5 | 2.6 | 0 | 1 | 4.5 | 0 | 23 | 2.9 | 0 | |||
| 160–169 | 148 | 0.5 | 65.8 | 126 | 0.5 | 18 | 0.3 | 0 | 0 | 0 | 1 | 4.5 | 0 | 3 | 0.4 | 0 | |||||
| 170–179 | 204 | 0.6 | 66.4 | 173 | 0.7 | 25 | 0.4 | 2 | 0.4 | 0 | 0 | 0 | 0 | 4 | 0.5 | 0 | |||||
| 180–189 | 148 | 0.5 | 66.9 | 132 | 0.6 | 15 | 0.2 | 0 | 0 | 0 | 0 | 0 | 1 | 0.1 | 0 | ||||||
| 190–199 | 64 | 0.2 | 67.1 | 53 | 0.2 | 9 | 0.1 | 0 | 0 | 0 | 0 | 0 | 2 | 0.3 | 0 | ||||||
| 200–299 | 2,082 | 6.5 | 73.6 | 1,472 | 6.2 | 506 | 7.7 | 21 | 4.4 | 5 | 2.6 | 0 | 3 | 13.6 | 1 | 1.0 | 73 | 9.1 | 1 | 3.2 | |
| 300–399 | 1,271 | 4.0 | 77.6 | 886 | 3.8 | 317 | 4.8 | 14 | 2.9 | 0 | 1 | 4.5 | 0 | 1 | 1.0 | 52 | 6.5 | 0 | |||
| 400–499 | 746 | 2.3 | 79.9 | 551 | 2.3 | 147 | 2.2 | 7 | 1.5 | 2 | 1.0 | 0 | 2 | 9.1 | 0 | 36 | 4.5 | 1 | 3.2 | ||
| 500–599 | 934 | 2.9 | 82.8 | 586 | 2.5 | 292 | 4.4 | 2 | 0.4 | 2 | 1.0 | 1 | 4.5 | 0 | 0 | 51 | 6.4 | 0 | |||
| 600–699 | 451 | 1.4 | 84.2 | 316 | 1.3 | 117 | 1.8 | 1 | 0.2 | 0 | 0 | 2 | 9.1 | 0 | 15 | 1.9 | 0 | ||||
| 700–799 | 267 | 0.8 | 85.0 | 196 | 0.8 | 63 | 1.0 | 0 | 1 | 0.5 | 0 | 0 | 0 | 7 | 0.9 | 0 | |||||
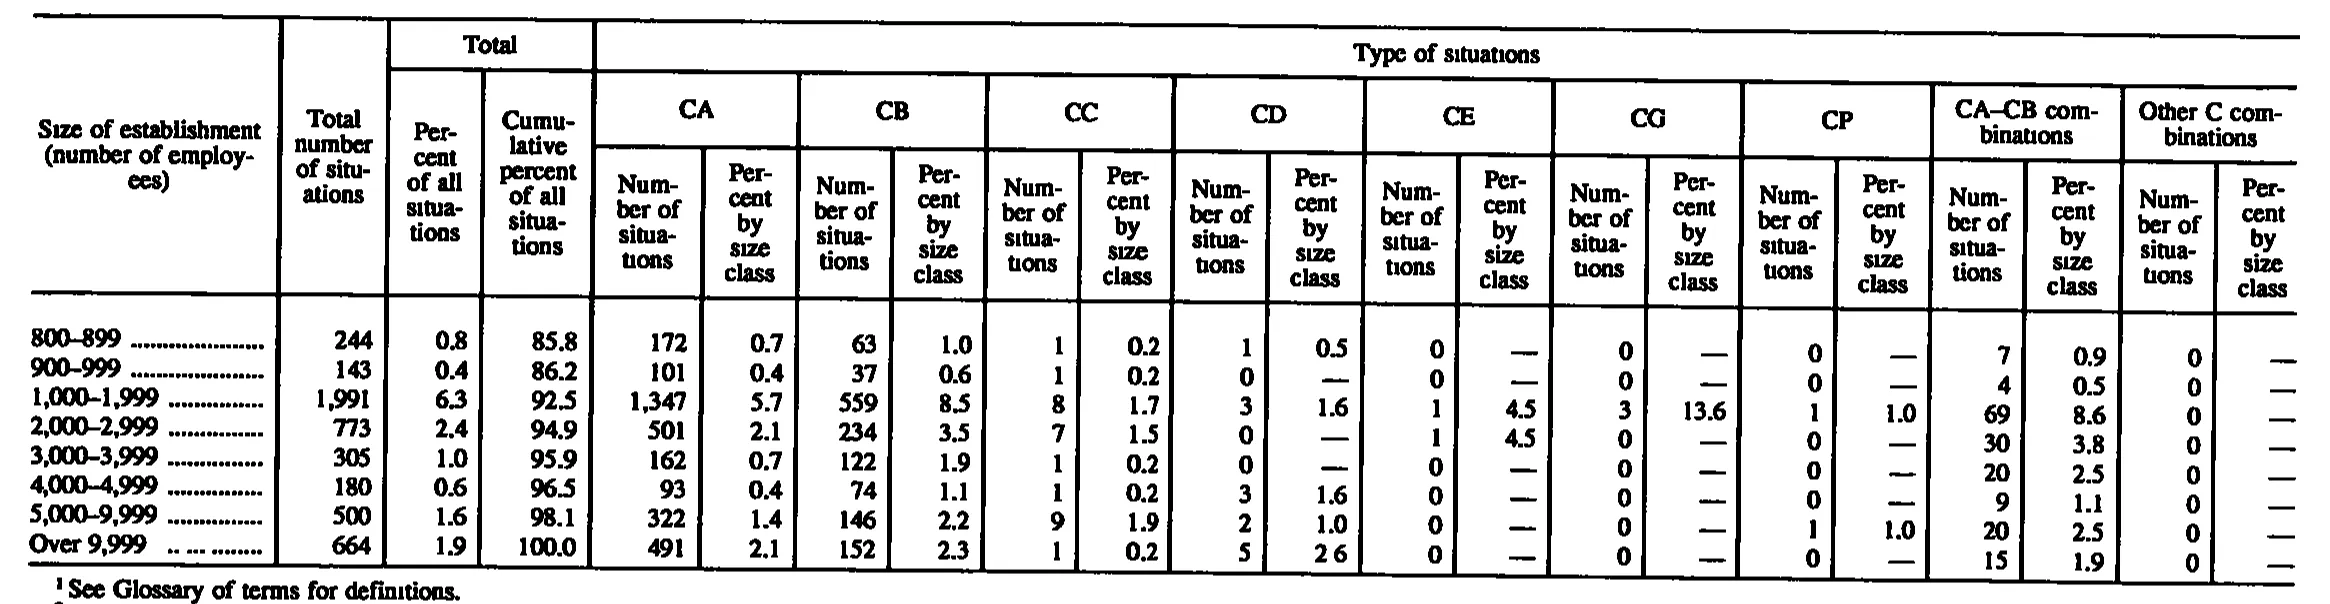
| 800–899 | 244 | 0.8 | 85.8 | 172 | 0.7 | 63 | 1.0 | 1 | 0.2 | 1 | 0.5 | 0 | 0 | 0 | 7 | 0.9 | 0 | ||||
| 900–999 | 143 | 0.4 | 86.2 | 101 | 0.4 | 37 | 0.6 | 1 | 0.2 | 0 | 0 | 0 | 0 | 4 | 0.5 | 0 | |||||
| 1,000–1,999 | 1,991 | 6.3 | 92.5 | 1,347 | 5.7 | 559 | 8.5 | 8 | 1.7 | 3 | 1.6 | 1 | 4.5 | 3 | 13.6 | 1 | 1.0 | 69 | 8.6 | 0 | |
| 2,000–2,999 | 773 | 2.4 | 94.9 | 501 | 2.1 | 234 | 3.5 | 7 | 1.5 | 0 | 1 | 4.5 | 0 | 0 | 30 | 3.8 | 0 | ||||
| 3,000–3,999 | 305 | 1.0 | 95.9 | 162 | 0.7 | 122 | 1.9 | 1 | 0.2 | 0 | 0 | 0 | 0 | 20 | 2.5 | 0 | |||||
| 4,000–4,999 | 180 | 0.6 | 96.5 | 93 | 0.4 | 74 | 1.1 | 1 | 0.2 | 3 | 1.6 | 0 | 0 | 0 | 9 | 1.1 | 0 | ||||
| 5,000–9,999 | 500 | 1.6 | 98.1 | 322 | 1.4 | 146 | 2.2 | 9 | 1.9 | 2 | 1.0 | 0 | 0 | 1 | 1.0 | 20 | 2.5 | 0 | |||
| Over 9,999 | 664 | 1.9 | 100.0 | 491 | 2.1 | 152 | 2.3 | 1 | 0.2 | 5 | 2.6 | 0 | 0 | 0 | 15 | 1.9 | 0 | ||||
- 1 See Glossary of terms for definitions.
245 of 245 figures sit in a row or column sum that works out.
Reader’s notes
p. 154. The crop is cut off at the bottom: the body ends mid-table at the "700-799" row (cumulative percent only 85.0), so the larger size classes and any total/footnote lines printed below continue on the next page. No footnote text is visible in this crop, although the caption carries a raised 1 and the Totals row's "Total number of situations" cell carries a raised 2 (transcribed as 31,845^2). Decimal points: this 1-bit scan drops many printed periods, so numerous percent cells read visually as e.g. "7 8", "10 1", "45 5", "100 0". They are printed decimals, and I transcribed them with the point (7.8, 10.1, 45.5, 100.0). Every one of these is confirmed by arithmetic: each number-of-situations value divided by its column total reproduces the percent, and the cumulative-percent column accumulates correctly down the page, so decimal placement is not in doubt. Affected cells include Totals (CC and CD percent), Under 10 (CE percent), 10-19 (CA percent), 20-29 (Total percent, CC percent), 30-39 (CD percent, CE percent, CA-CB percent), 40-49 (CA percent), 50-59 (Total percent, CC percent), 70-79 (CA percent), 80-89 (Total percent, CA percent, CC percent), 100-109 (CD percent), 110-119 (cumulative percent), 120-129 (cumulative percent, CA percent), 130-139 (CA percent), 140-149 (CC percent), 160-169 (CA percent, CG percent), 170-179 (cumulative percent, CC percent), 180-189 (Total percent, CA percent), 200-299 (cumulative percent), 300-399 (CA percent), 400-499 (cumulative percent), 500-599 (Total percent, CC percent), 600-699 (Total percent, CA percent). The Totals row's "Cumulative percent of all situations" cell holds a dash rule and is given as "". Throughout the body, a percent cell printed as a long dash (used where the count is 0) is likewise "". The en dashes in the stub labels and in the "CA-CB combinations" heading are printed as en dashes.
p. 155. Crop content: this is the tail of a table that continues from the previous page — the column headings are reprinted here, but the body begins mid-series at the 800-899 size class and there is no total/subtotal row on this image. 22 columns: stub; "Total number of situations"; two columns under "Total" (percent of all situations, cumulative percent of all situations); then nine two-column panels under "Type of situations" (CA, CB, CC, CD, CE, CG, CP, CA-CB combinations, Other C combinations), each with "Number of situations" and "Percent by size class". "Total" spans only the two percent columns; "Total number of situations" is a tall single heading spanning all three heading levels, as is the stub heading. Em dashes: every "Percent by size class" cell that is printed as a single long dash (the nil filler, always paired with a printed 0 in the number column) is transcribed as "" per the empty-cell rule. These occur in CD (900-999, 2,000-2,999, 3,000-3,999), CE (800-899, 900-999, 4,000-4,999, 5,000-9,999, Over 9,999), CG (800-899, 900-999, 2,000-2,999 through Over 9,999), CP (800-899, 900-999, 2,000-2,999, 3,000-3,999, 4,000-4,999, Over 9,999) and Other C combinations (all eight rows). Doubtful cell: row "Over 9,999", CD "Percent by size class" is printed as "2 6" — the decimal point did not survive the scan. Transcribed as "2.6" on the pattern of every other cell in that column; the printed characters are "2", a gap, "6". The row labels use en dashes as printed ("800-899" etc.). Leader dots after each label were dropped. A second footnote (marker 2) begins just below footnote 1 and is cut off by the bottom edge of the crop; only its first stroke is visible, so it is not transcribed. The caption, running head and page number are outside the crop. Scan quality is good but the font renders "i" dots faintly (e.g. "situations" reads as "situauons"); heading wording was repaired to standard spelling.
Source image
Source data: U.S. NLRB Annual Reports (public domain). Reconstruction by NLRB Stats Archive. Read by claude-opus-5 (effort max, prompt extract_v1) from the 300-dpi scan; stitched by page. Updated October 2026.