NLRB Stats Archive › Annual Reports › FY1994 › Standard Federal Administrative Regional Distribution of Cases Received, Fiscal Year 1994
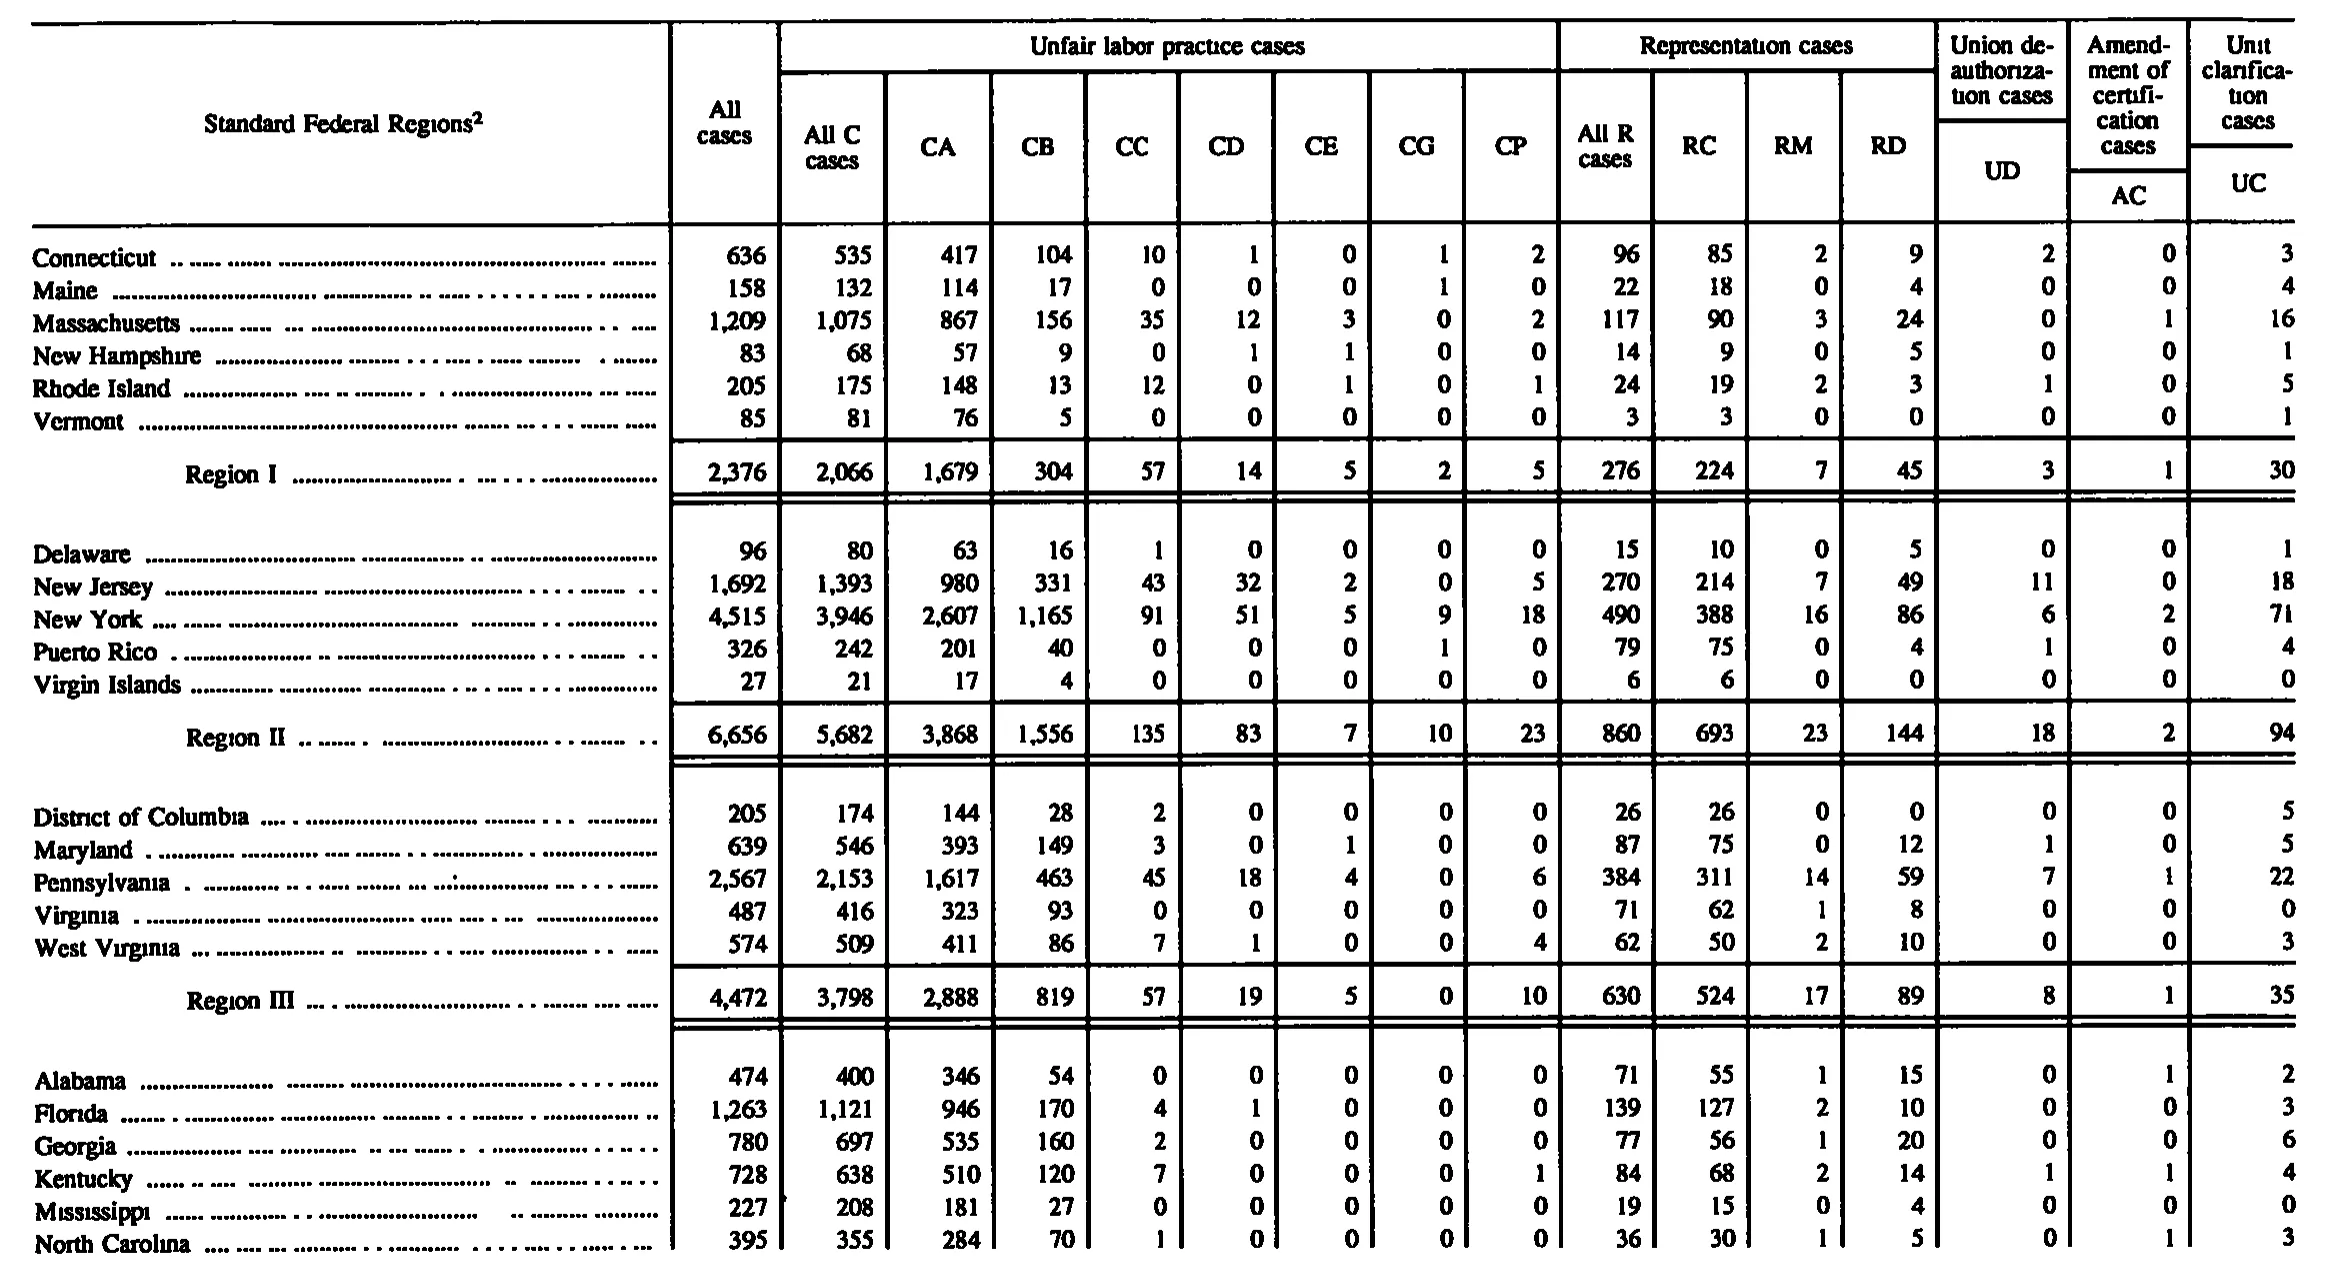
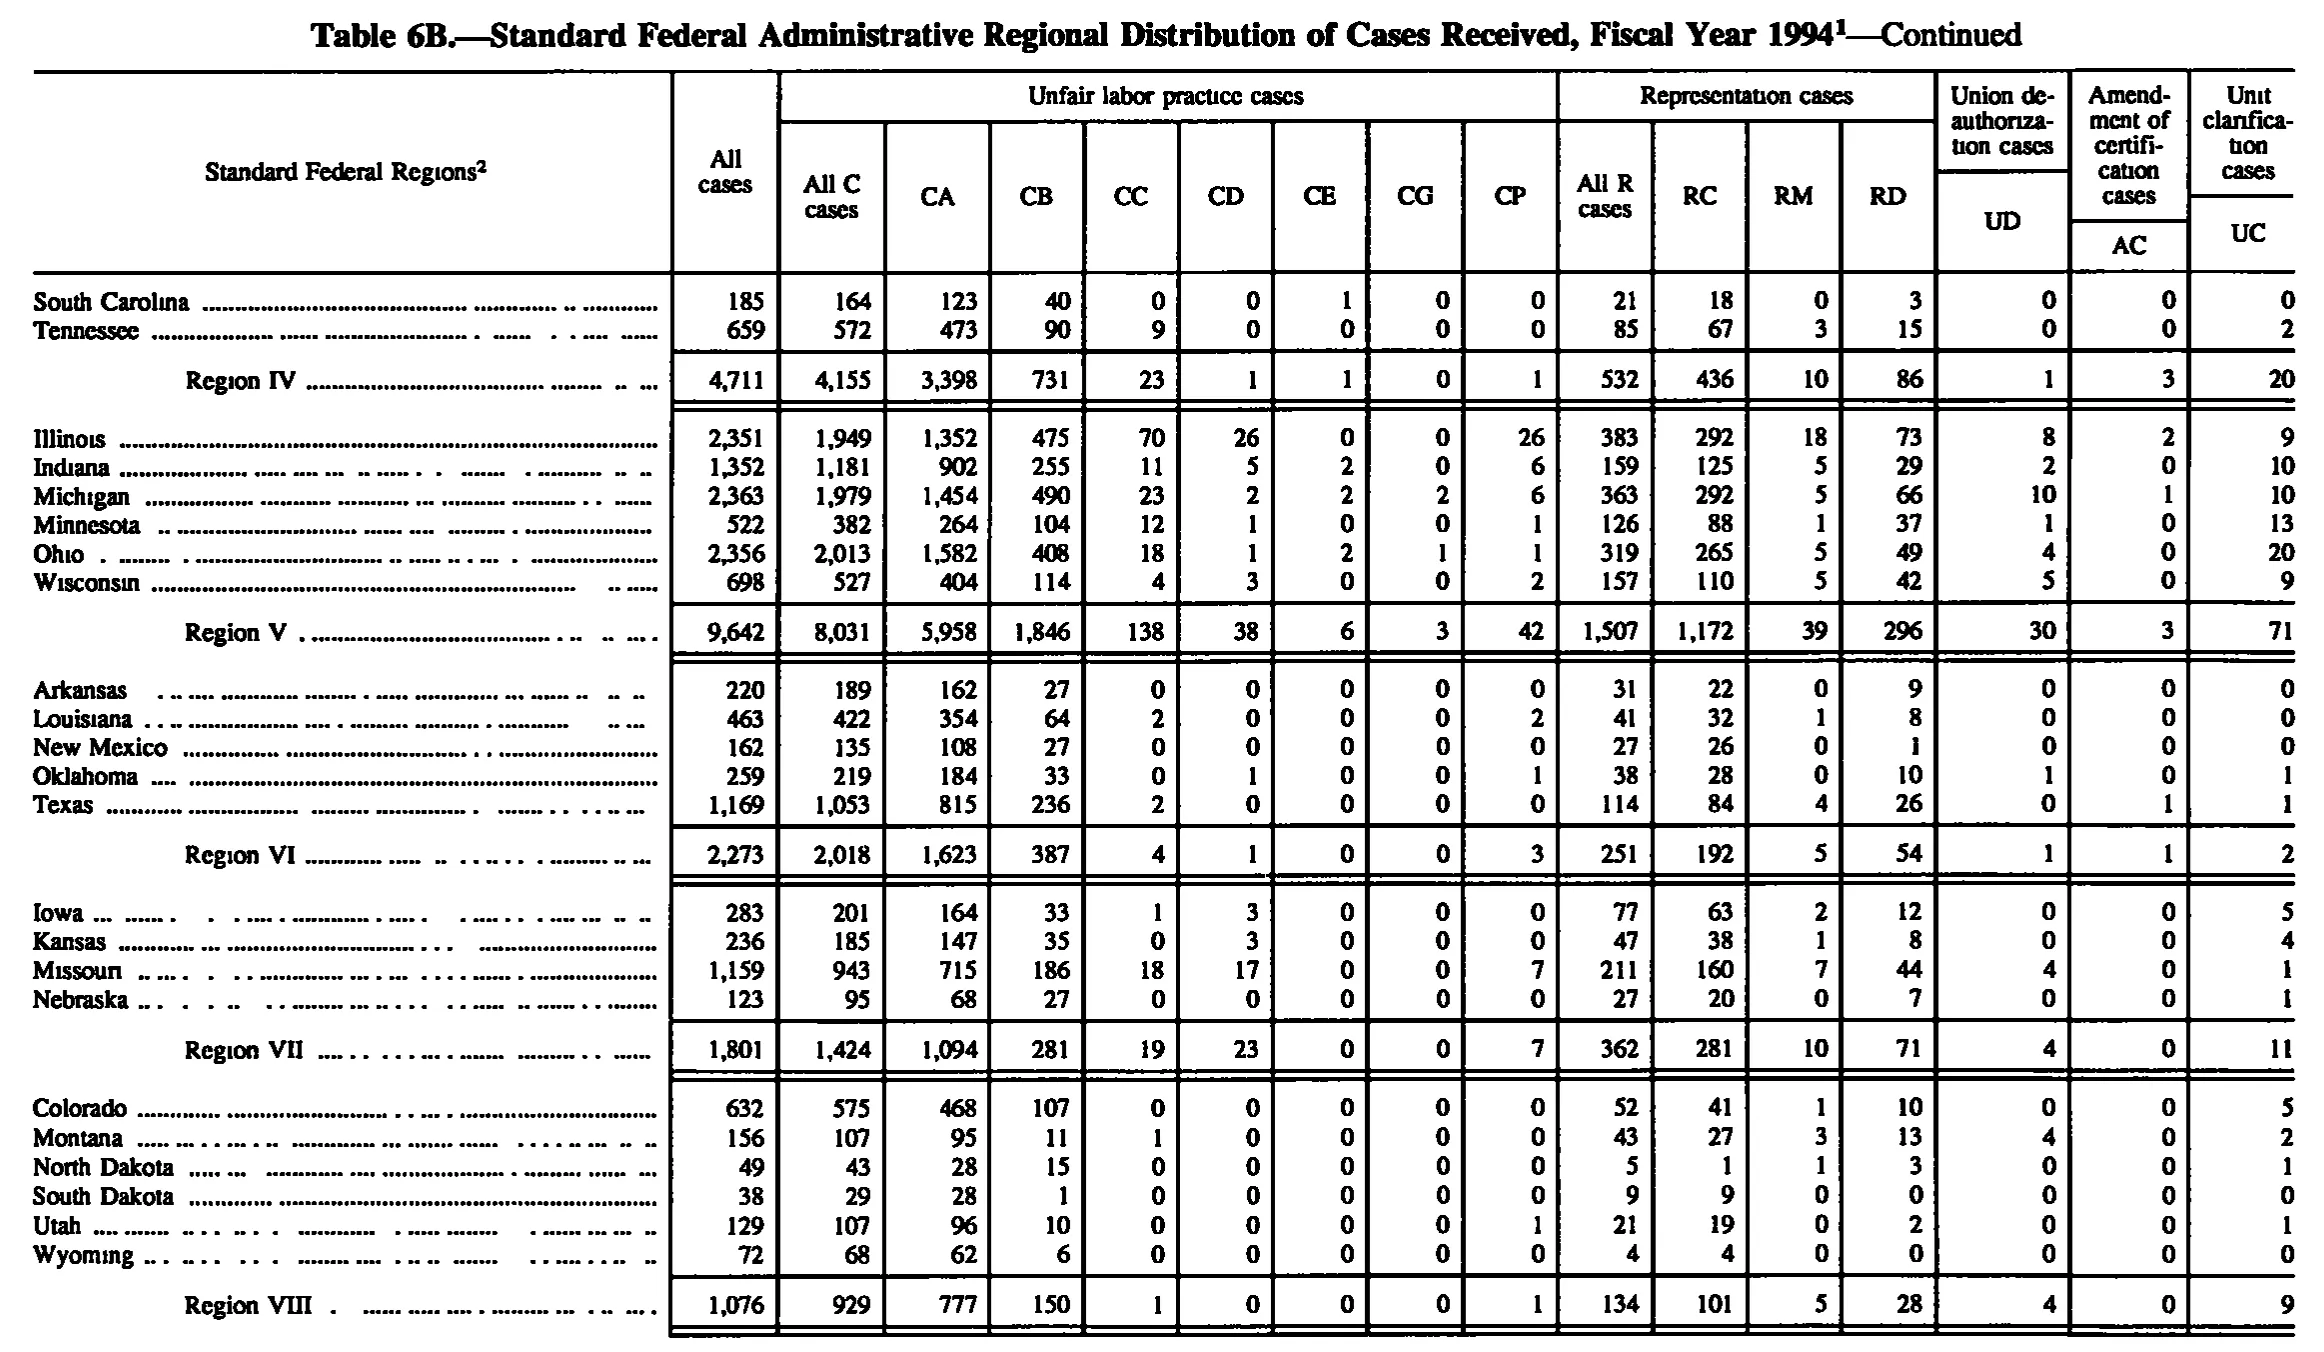
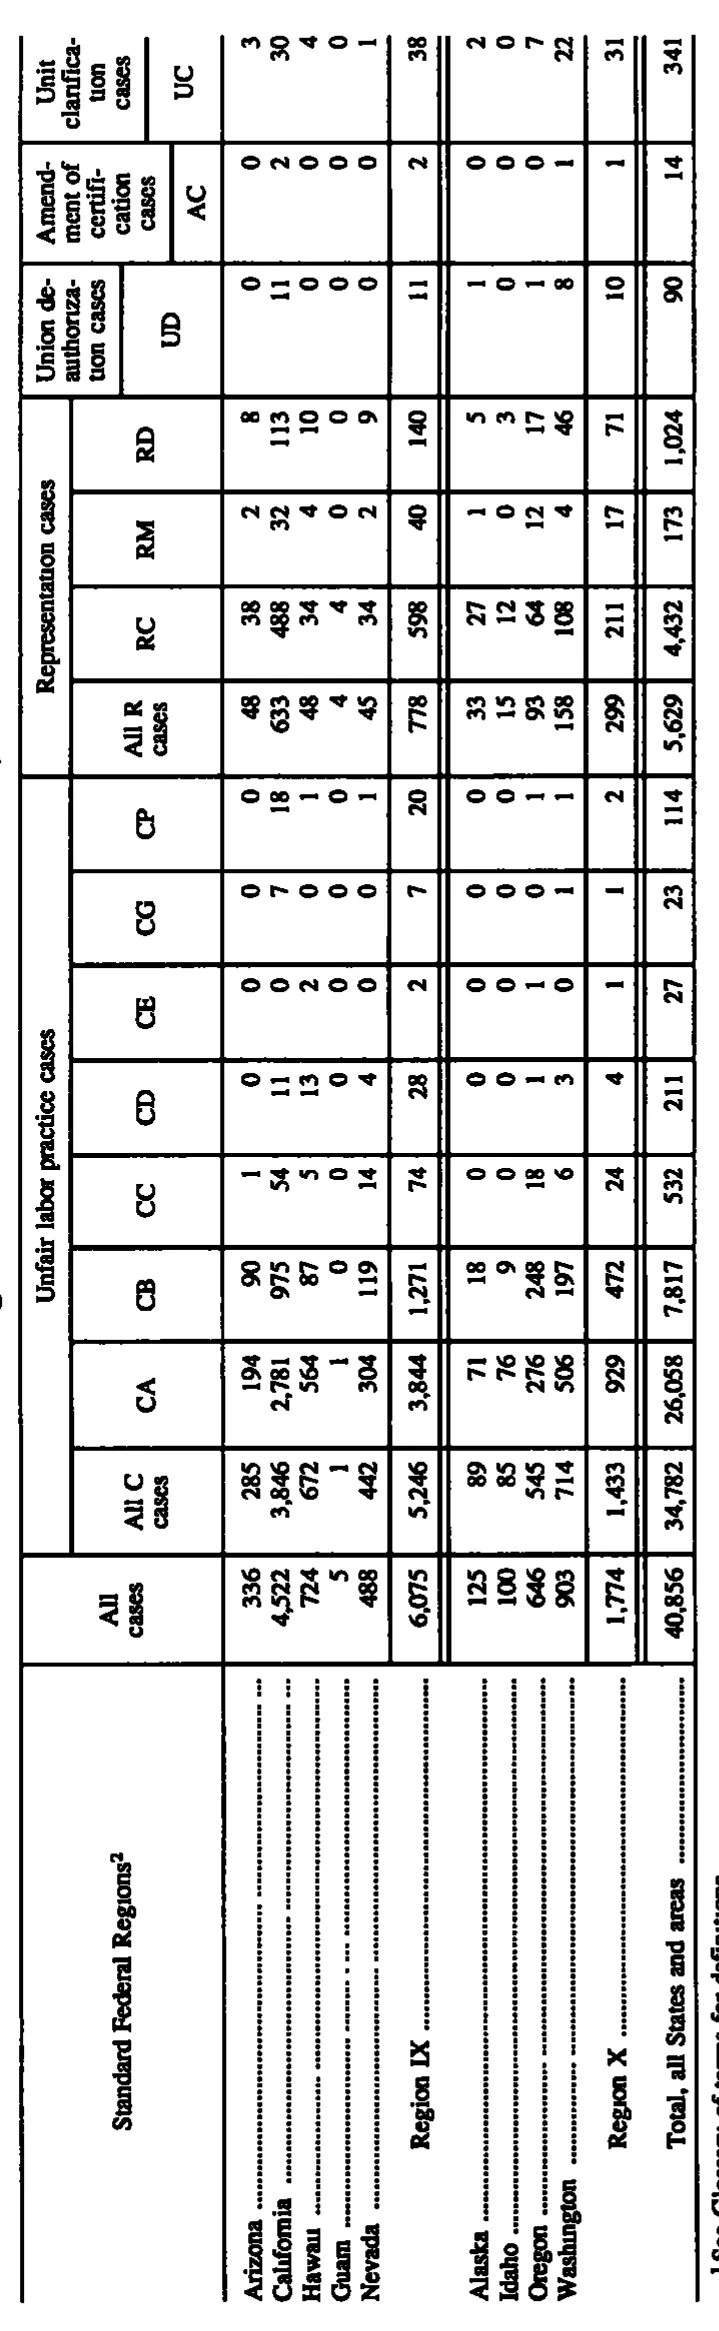
Standard Federal Administrative Regional Distribution of Cases Received, Fiscal Year 1994
Stitched from pp. 117–119.
| Standard Federal Regions | All cases | Unfair labor practice cases | Representation cases | Union deauthorization cases | Amendment of certification cases | Unit clarification cases | ||||||||||
|---|---|---|---|---|---|---|---|---|---|---|---|---|---|---|---|---|
| Standard Federal Regions | All cases | All C cases | CA | CB | CC | CD | CE | CG | CP | All R cases | RC | RM | RD | UD | AC | UC |
| Connecticut | 636 | 535 | 417 | 104 | 10 | 1 | 0 | 1 | 2 | 96 | 85 | 2 | 9 | 2 | 0 | 3 |
| Maine | 158 | 132 | 114 | 17 | 0 | 0 | 0 | 1 | 0 | 22 | 18 | 0 | 4 | 0 | 0 | 4 |
| Massachusetts | 1,209 | 1,075 | 867 | 156 | 35 | 12 | 3 | 0 | 2 | 117 | 90 | 3 | 24 | 0 | 1 | 16 |
| New Hampshire | 83 | 68 | 57 | 9 | 0 | 1 | 1 | 0 | 0 | 14 | 9 | 0 | 5 | 0 | 0 | 1 |
| Rhode Island | 205 | 175 | 148 | 13 | 12 | 0 | 1 | 0 | 1 | 24 | 19 | 2 | 3 | 1 | 0 | 5 |
| Vermont | 85 | 81 | 76 | 5 | 0 | 0 | 0 | 0 | 0 | 3 | 3 | 0 | 0 | 0 | 0 | 1 |
| Region I | 2,376 | 2,066 | 1,679 | 304 | 57 | 14 | 5 | 2 | 5 | 276 | 224 | 7 | 45 | 3 | 1 | 30 |
| Delaware | 96 | 80 | 63 | 16 | 1 | 0 | 0 | 0 | 0 | 15 | 10 | 0 | 5 | 0 | 0 | 1 |
| New Jersey | 1,692 | 1,393 | 980 | 331 | 43 | 32 | 2 | 0 | 5 | 270 | 214 | 7 | 49 | 11 | 0 | 18 |
| New York | 4,515 | 3,946 | 2,607 | 1,165 | 91 | 51 | 5 | 9 | 18 | 490 | 388 | 16 | 86 | 6 | 2 | 71 |
| Puerto Rico | 326 | 242 | 201 | 40 | 0 | 0 | 0 | 1 | 0 | 79 | 75 | 0 | 4 | 1 | 0 | 4 |
| Virgin Islands | 27 | 21 | 17 | 4 | 0 | 0 | 0 | 0 | 0 | 6 | 6 | 0 | 0 | 0 | 0 | 0 |
| Region II | 6,656 | 5,682 | 3,868 | 1,556 | 135 | 83 | 7 | 10 | 23 | 860 | 693 | 23 | 144 | 18 | 2 | 94 |
| District of Columbia | 205 | 174 | 144 | 28 | 2 | 0 | 0 | 0 | 0 | 26 | 26 | 0 | 0 | 0 | 0 | 5 |
| Maryland | 639 | 546 | 393 | 149 | 3 | 0 | 1 | 0 | 0 | 87 | 75 | 0 | 12 | 1 | 0 | 5 |
| Pennsylvania | 2,567 | 2,153 | 1,617 | 463 | 45 | 18 | 4 | 0 | 6 | 384 | 311 | 14 | 59 | 7 | 1 | 22 |
| Virginia | 487 | 416 | 323 | 93 | 0 | 0 | 0 | 0 | 0 | 71 | 62 | 1 | 8 | 0 | 0 | 0 |
| West Virginia | 574 | 509 | 411 | 86 | 7 | 1 | 0 | 0 | 4 | 62 | 50 | 2 | 10 | 0 | 0 | 3 |
| Region III | 4,472 | 3,798 | 2,888 | 819 | 57 | 19 | 5 | 0 | 10 | 630 | 524 | 17 | 89 | 8 | 1 | 35 |
| Alabama | 474 | 400 | 346 | 54 | 0 | 0 | 0 | 0 | 0 | 71 | 55 | 1 | 15 | 0 | 1 | 2 |
| Florida | 1,263 | 1,121 | 946 | 170 | 4 | 1 | 0 | 0 | 0 | 139 | 127 | 2 | 10 | 0 | 0 | 3 |
| Georgia | 780 | 697 | 535 | 160 | 2 | 0 | 0 | 0 | 0 | 77 | 56 | 1 | 20 | 0 | 0 | 6 |
| Kentucky | 728 | 638 | 510 | 120 | 7 | 0 | 0 | 0 | 1 | 84 | 68 | 2 | 14 | 1 | 1 | 4 |
| Mississippi | 227 | 208 | 181 | 27 | 0 | 0 | 0 | 0 | 0 | 19 | 15 | 0 | 4 | 0 | 0 | 0 |
| North Carolina | 395 | 355 | 284 | 70 | 1 | 0 | 0 | 0 | 0 | 36 | 30 | 1 | 5 | 0 | 1 | 3 |
| South Carolina | 185 | 164 | 123 | 40 | 0 | 0 | 1 | 0 | 0 | 21 | 18 | 0 | 3 | 0 | 0 | 0 |
| Tennessee | 659 | 572 | 473 | 90 | 9 | 0 | 0 | 0 | 0 | 85 | 67 | 3 | 15 | 0 | 0 | 2 |
| Region IV | 4,711 | 4,155 | 3,398 | 731 | 23 | 1 | 1 | 0 | 1 | 532 | 436 | 10 | 86 | 1 | 3 | 20 |
| Illinois | 2,351 | 1,949 | 1,352 | 475 | 70 | 26 | 0 | 0 | 26 | 383 | 292 | 18 | 73 | 8 | 2 | 9 |
| Indiana | 1,352 | 1,181 | 902 | 255 | 11 | 5 | 2 | 0 | 6 | 159 | 125 | 5 | 29 | 2 | 0 | 10 |
| Michigan | 2,363 | 1,979 | 1,454 | 490 | 23 | 2 | 2 | 2 | 6 | 363 | 292 | 5 | 66 | 10 | 1 | 10 |
| Minnesota | 522 | 382 | 264 | 104 | 12 | 1 | 0 | 0 | 1 | 126 | 88 | 1 | 37 | 1 | 0 | 13 |
| Ohio | 2,356 | 2,013 | 1,582 | 408 | 18 | 1 | 2 | 1 | 1 | 319 | 265 | 5 | 49 | 4 | 0 | 20 |
| Wisconsin | 698 | 527 | 404 | 114 | 4 | 3 | 0 | 0 | 2 | 157 | 110 | 5 | 42 | 5 | 0 | 9 |
| Region V | 9,642 | 8,031 | 5,958 | 1,846 | 138 | 38 | 6 | 3 | 42 | 1,507 | 1,172 | 39 | 296 | 30 | 3 | 71 |
| Arkansas | 220 | 189 | 162 | 27 | 0 | 0 | 0 | 0 | 0 | 31 | 22 | 0 | 9 | 0 | 0 | 0 |
| Louisiana | 463 | 422 | 354 | 64 | 2 | 0 | 0 | 0 | 2 | 41 | 32 | 1 | 8 | 0 | 0 | 0 |
| New Mexico | 162 | 135 | 108 | 27 | 0 | 0 | 0 | 0 | 0 | 27 | 26 | 0 | 1 | 0 | 0 | 0 |
| Oklahoma | 259 | 219 | 184 | 33 | 0 | 1 | 0 | 0 | 1 | 38 | 28 | 0 | 10 | 1 | 0 | 1 |
| Texas | 1,169 | 1,053 | 815 | 236 | 2 | 0 | 0 | 0 | 0 | 114 | 84 | 4 | 26 | 0 | 1 | 1 |
| Region VI | 2,273 | 2,018 | 1,623 | 387 | 4 | 1 | 0 | 0 | 3 | 251 | 192 | 5 | 54 | 1 | 1 | 2 |
| Iowa | 283 | 201 | 164 | 33 | 1 | 3 | 0 | 0 | 0 | 77 | 63 | 2 | 12 | 0 | 0 | 5 |
| Kansas | 236 | 185 | 147 | 35 | 0 | 3 | 0 | 0 | 0 | 47 | 38 | 1 | 8 | 0 | 0 | 4 |
| Missouri | 1,159 | 943 | 715 | 186 | 18 | 17 | 0 | 0 | 7 | 211 | 160 | 7 | 44 | 4 | 0 | 1 |
| Nebraska | 123 | 95 | 68 | 27 | 0 | 0 | 0 | 0 | 0 | 27 | 20 | 0 | 7 | 0 | 0 | 1 |
| Region VII | 1,801 | 1,424 | 1,094 | 281 | 19 | 23 | 0 | 0 | 7 | 362 | 281 | 10 | 71 | 4 | 0 | 11 |
| Colorado | 632 | 575 | 468 | 107 | 0 | 0 | 0 | 0 | 0 | 52 | 41 | 1 | 10 | 0 | 0 | 5 |
| Montana | 156 | 107 | 95 | 11 | 1 | 0 | 0 | 0 | 0 | 43 | 27 | 3 | 13 | 4 | 0 | 2 |
| North Dakota | 49 | 43 | 28 | 15 | 0 | 0 | 0 | 0 | 0 | 5 | 1 | 1 | 3 | 0 | 0 | 1 |
| South Dakota | 38 | 29 | 28 | 1 | 0 | 0 | 0 | 0 | 0 | 9 | 9 | 0 | 0 | 0 | 0 | 0 |
| Utah | 129 | 107 | 96 | 10 | 0 | 0 | 0 | 0 | 1 | 21 | 19 | 0 | 2 | 0 | 0 | 1 |
| Wyoming | 72 | 68 | 62 | 6 | 0 | 0 | 0 | 0 | 0 | 4 | 4 | 0 | 0 | 0 | 0 | 0 |
| Region VIII | 1,076 | 929 | 777 | 150 | 1 | 0 | 0 | 0 | 1 | 134 | 101 | 5 | 28 | 4 | 0 | 9 |
| Arizona | 336 | 285 | 194 | 90 | 1 | 0 | 0 | 0 | 0 | 48 | 38 | 2 | 8 | 0 | 0 | 3 |
| California | 4,522 | 3,846 | 2,781 | 975 | 54 | 11 | 0 | 7 | 18 | 633 | 488 | 32 | 113 | 11 | 2 | 30 |
| Hawaii | 724 | 672 | 564 | 87 | 5 | 13 | 2 | 0 | 1 | 48 | 34 | 4 | 10 | 0 | 0 | 4 |
| Guam | 5 | 1 | 1 | 0 | 0 | 0 | 0 | 0 | 0 | 4 | 4 | 0 | 0 | 0 | 0 | 0 |
| Nevada | 488 | 442 | 304 | 119 | 14 | 4 | 0 | 0 | 1 | 45 | 34 | 2 | 9 | 0 | 0 | 1 |
| Region IX | 6,075 | 5,246 | 3,844 | 1,271 | 74 | 28 | 2 | 7 | 20 | 778 | 598 | 40 | 140 | 11 | 2 | 38 |
| Alaska | 125 | 89 | 71 | 18 | 0 | 0 | 0 | 0 | 0 | 33 | 27 | 1 | 5 | 1 | 0 | 2 |
| Idaho | 100 | 85 | 76 | 9 | 0 | 0 | 0 | 0 | 0 | 15 | 12 | 0 | 3 | 0 | 0 | 0 |
| Oregon | 646 | 545 | 276 | 248 | 18 | 1 | 1 | 0 | 1 | 93 | 64 | 12 | 17 | 1 | 0 | 7 |
| Washington | 903 | 714 | 506 | 197 | 6 | 3 | 0 | 1 | 1 | 158 | 108 | 4 | 46 | 8 | 1 | 22 |
| Region X | 1,774 | 1,433 | 929 | 472 | 24 | 4 | 1 | 1 | 2 | 299 | 211 | 17 | 71 | 10 | 1 | 31 |
| Total, all States and areas | 40,856 | 34,782 | 26,058 | 7,817 | 532 | 211 | 27 | 23 | 114 | 5,629 | 4,432 | 173 | 1,024 | 90 | 14 | 341 |
- 1 See Glossary of terms for definitions.
745 of 745 figures sit in a row or column sum that works out.
Reader’s notes
p. 117. The crop is cut off at the bottom: the table clearly continues past "North Carolina" (the fourth region's state block is incomplete and no Region IV subtotal or any grand total appears), so the rows transcribed here are only the start of the table. No footnote texts are printed within the crop, so `footnotes` is empty even though the stub heading carries a raised "2" marker ("Standard Federal Regions^2"); its text must appear further down the page, below the crop. Header structure: the right-hand three columns are each headed by a single stacked caption ("Union de-authorization cases", "Amend-ment of certifi-cation cases", "Unit clarifi-cation cases"), with the case-type codes UD, AC and UC printed on a lower line under each; I have put the captions on the first heading level and the codes on the second, alongside the CA/CB/... and RC/RM/RD codes. The "UD" code sits one line higher on the page than "AC" and "UC" because its caption is shorter, but all three belong to the same code level. The scan is a clean 300-ppi bitonal image and no cell was doubtful. Every printed figure cross-checks arithmetically: for all 22 state rows, All C cases = CA+CB+CC+CD+CE+CG+CP, All R cases = RC+RM+RD, and All cases = All C + All R + UD + AC + UC; and each of the three Region subtotal rows (I, II, III) equals the exact column sum of its member states in all 16 numeric columns. No misprints were found.
p. 118. This is a continuation page ("—Continued"): the table starts on an earlier page (it opens mid-Region IV, with South Carolina and Tennessee the last two states of that region) and continues past the bottom rule (Region VIII is the last complete block on the crop; no grand total appears). Column headings are reprinted on this page, so they are transcribed. 17 columns: stub, "All cases", eight columns under "Unfair labor practice cases" (All C cases, CA, CB, CC, CD, CE, CG, CP), four under "Representation cases" (All R cases, RC, RM, RD), then UD, AC, UC. The three rightmost spanner headings are printed in a stacked form where the descriptive text sits above and the code letters below ("Union deauthorization cases"/UD, "Amendment of certification cases"/AC, "Unit clarification cases"/UC); I have treated the descriptive text as the top heading level and the code as the second level. Footnote markers: the caption carries a raised 1 (caption excluded per instructions) and the stub heading reads "Standard Federal Regions" with a raised 2, transcribed as "Standard Federal Regions^2". No footnote text is printed on this crop — the numbered footnotes presumably appear on the page where the table ends. Row labels are followed by leader dots of varying length (e.g. "Ohio . ......", "Region VIII . ......"); the stray periods are leader-dot artifacts and have been dropped. Arithmetic cross-checks (performed only to validate the reading, nothing was altered): every state row's C-case components sum to its "All C cases" figure and its "All cases" figure equals All C + All R + UD + AC + UC; and every column of Regions V, VI, VII, and VIII equals the sum of its member states. All checks passed, so no misprints are suspected in the rows fully shown. Region IV's total could not be checked because most of its states are on the preceding page.
p. 119. The image is presented rotated 90 degrees counter-clockwise (the stub column runs along the bottom edge and the column headings read bottom-to-top); it is not upright, but the grid was legible and has been transcribed in normal reading order. This is a continuation page of a multi-page table: the column headings are reprinted here, so they are given, but the body begins mid-table (Region IX's member States) with no preceding sections on this crop. The footnote line at the very bottom is clipped by the crop — only the top sliver of the letterforms survives. I read it as "1 See Glossary of terms for definitions."; the wording (especially the order of "of terms" and "for definitions") is uncertain and the marker digit "1" is inferred from the visible leading character. If a second footnote keyed to the "2" marker on the stub heading "Standard Federal Regions^2" was printed below it, it is entirely outside the crop. The stub heading carries a raised "2" (transcribed as "Standard Federal Regions^2"); no other footnote markers are attached to values in the body. Rule-work in the body: a horizontal rule separates the Region IX block from the Region X block, and another separates Region X from the grand total. No row labels are indented differently in a way that changes their meaning. Arithmetic cross-checks all pass as printed: each State row's C-case detail sums to "All C cases" and its R-case detail to "All R cases"; the five Region IX States sum to the Region IX line and the four Region X States to the Region X line in all 16 numeric columns; and "All cases" equals All C + All R + UD + AC + UC on every row, including the grand total (34,782 + 5,629 + 90 + 14 + 341 = 40,856). No suspected misprints. Hawaii's CD (13) and CE (2) are the two cells with the heaviest ink spread at this resolution, but both are confirmed by the Region IX column totals (CD 28 = 0+11+13+0+4; CE 2 = 0+0+2+0+0).
Source image
Source data: U.S. NLRB Annual Reports (public domain). Reconstruction by NLRB Stats Archive. Read by claude-opus-5 (effort max, prompt extract_v1) from the 300-dpi scan; stitched by page. Updated October 2026.