NLRB Stats Archive › Annual Reports › FY1994 › Geographic Distribution of Cases Received, Fiscal Year 1994
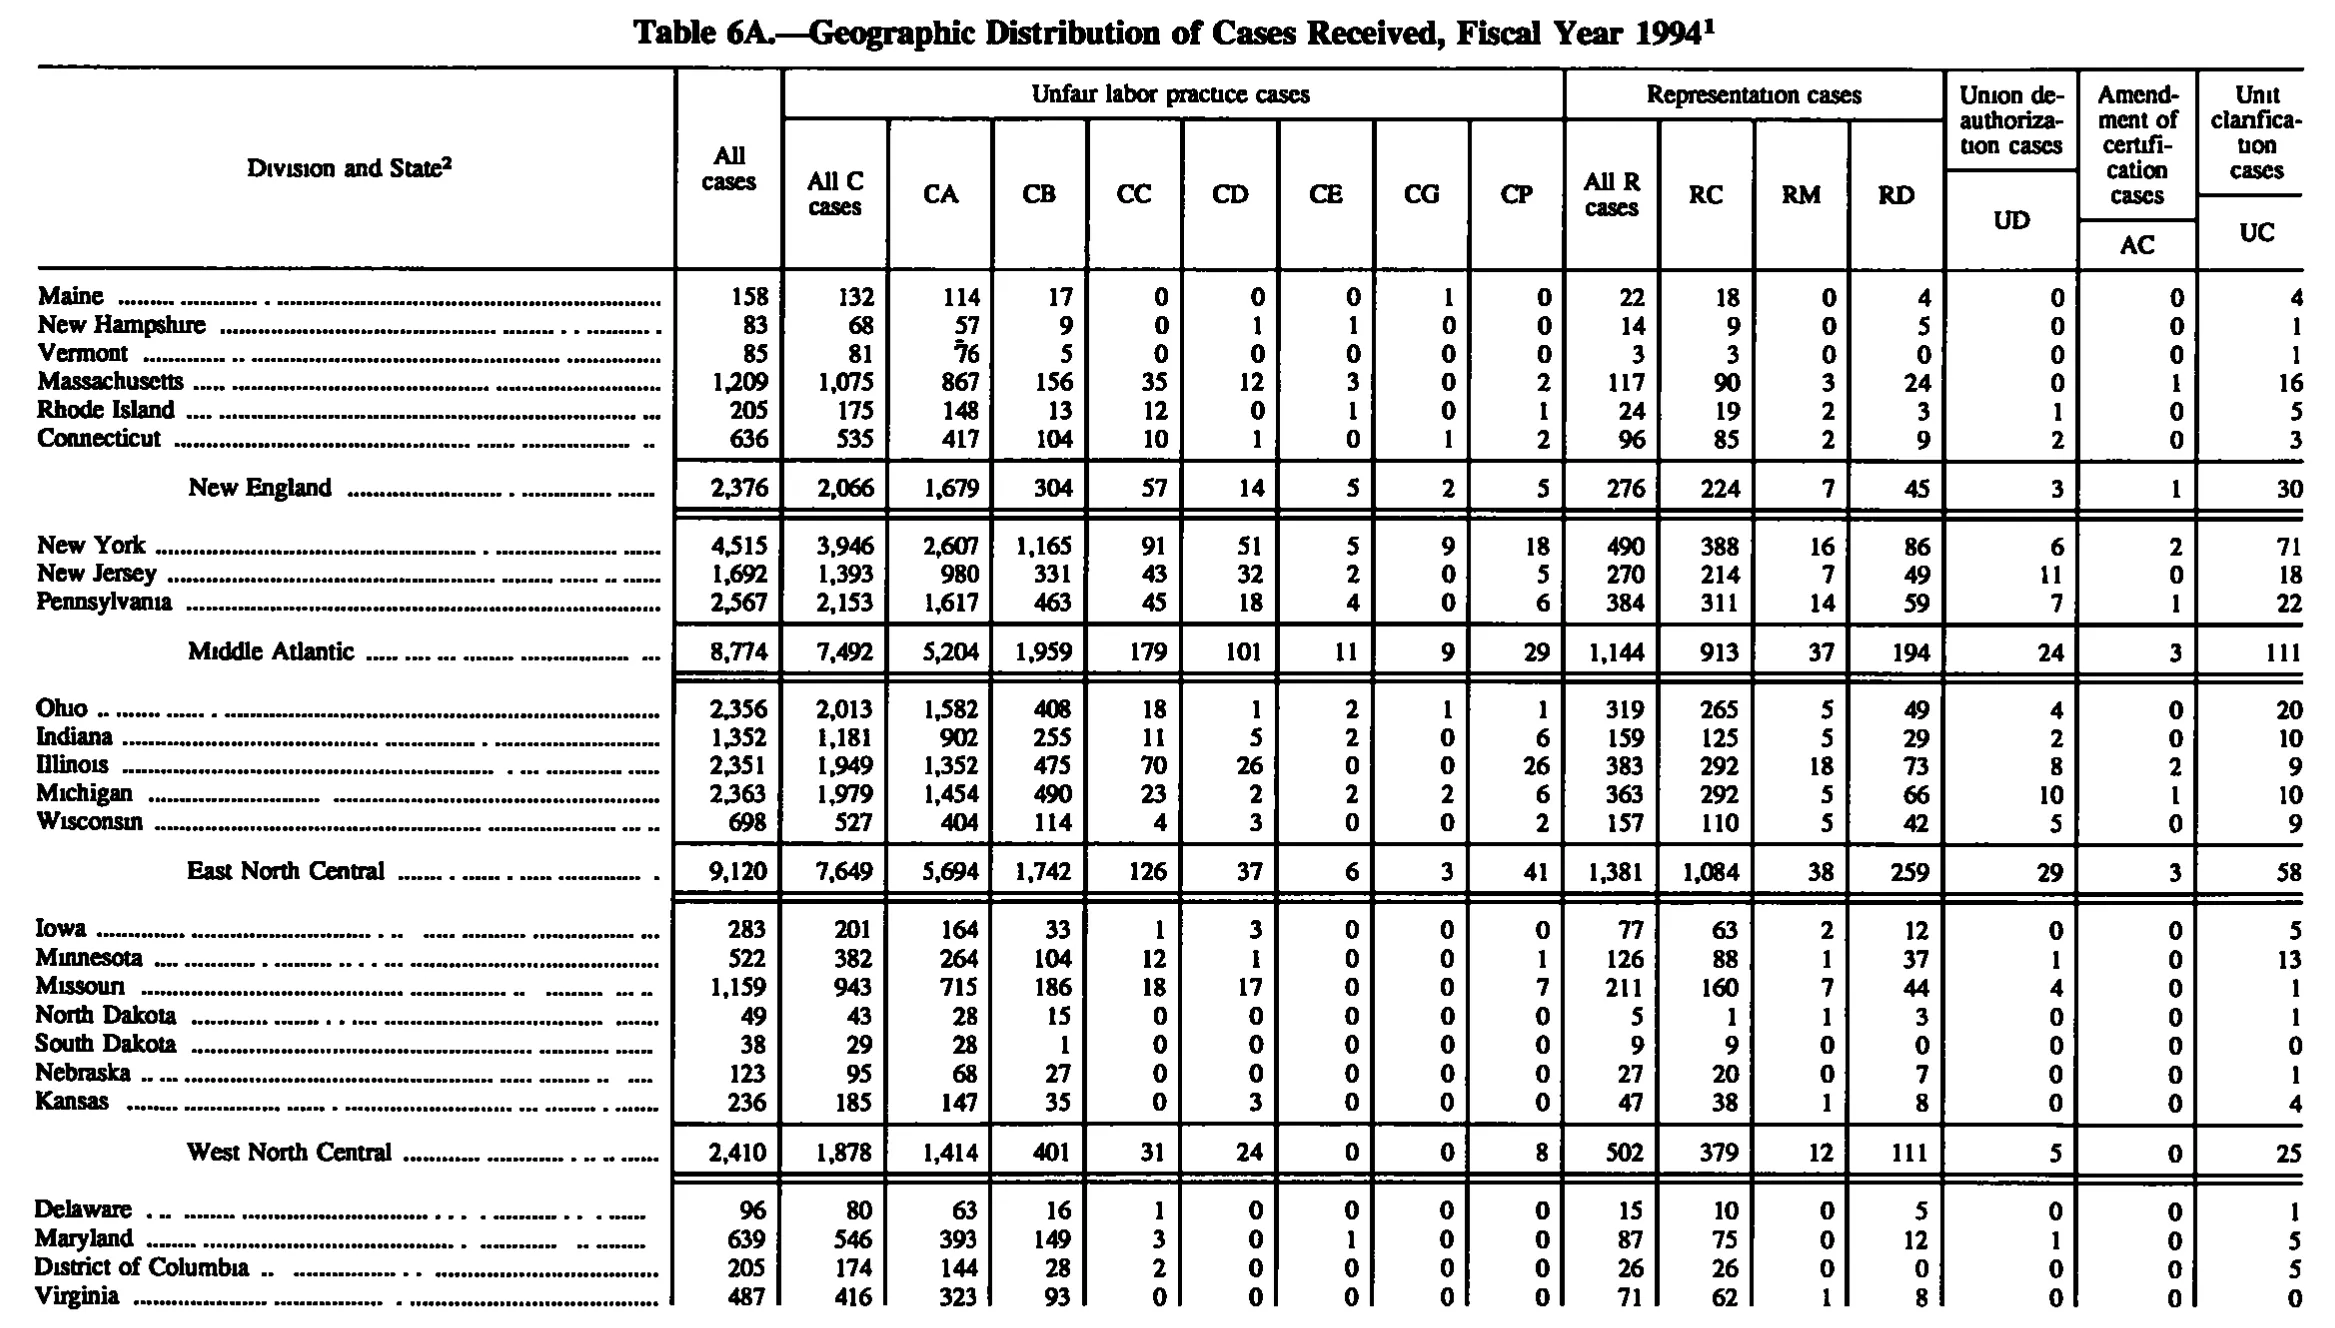
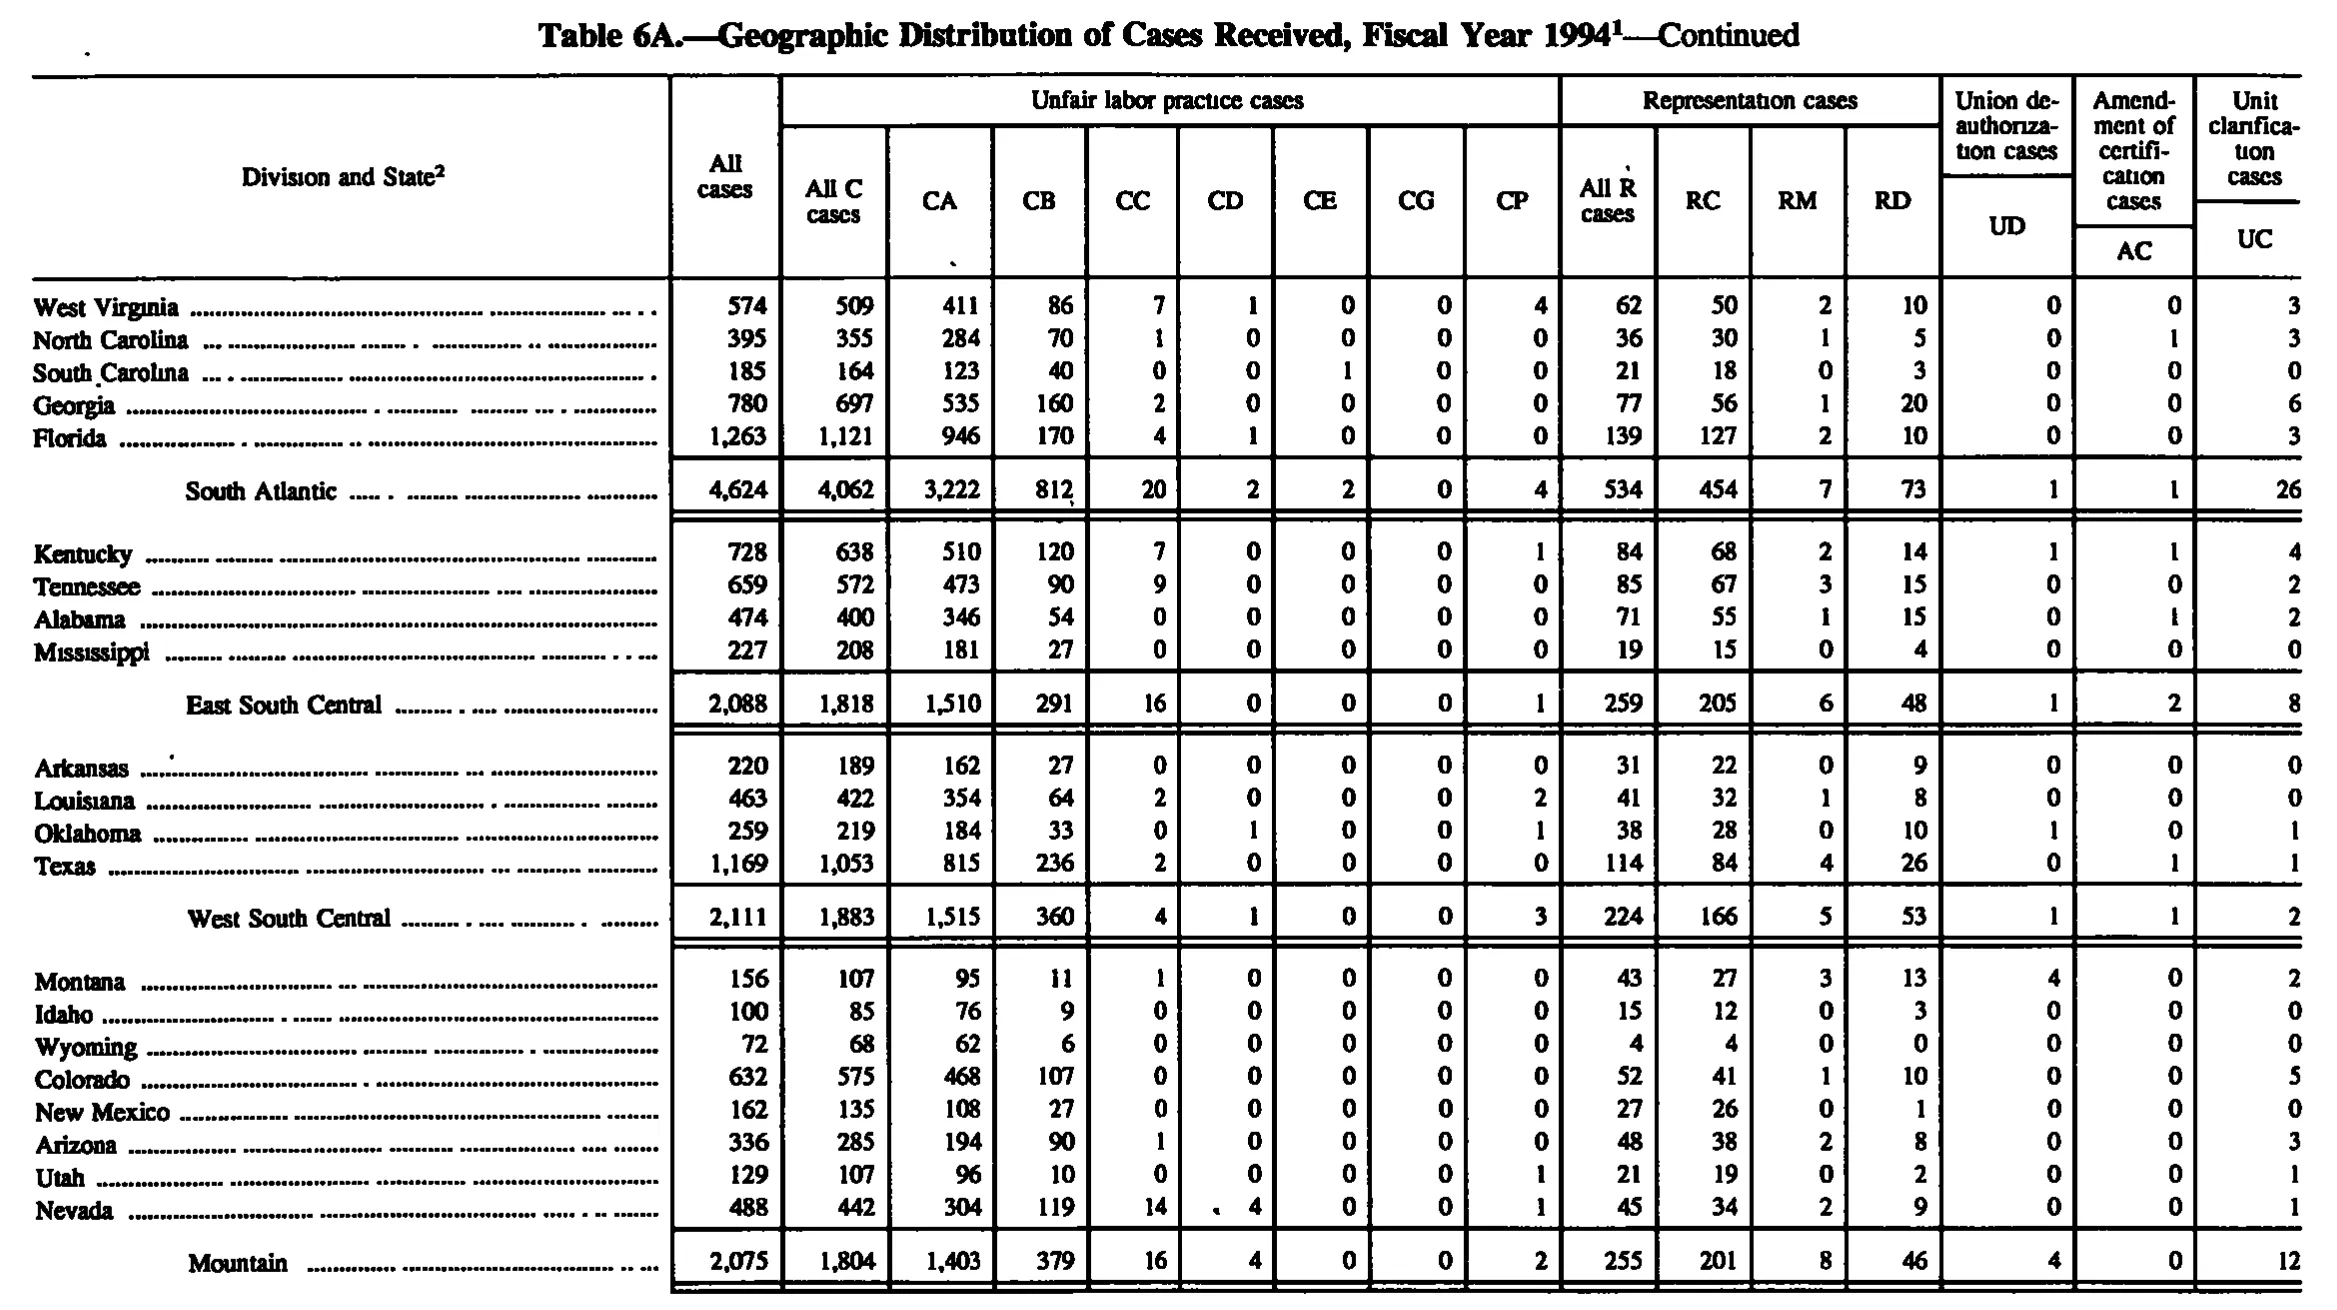
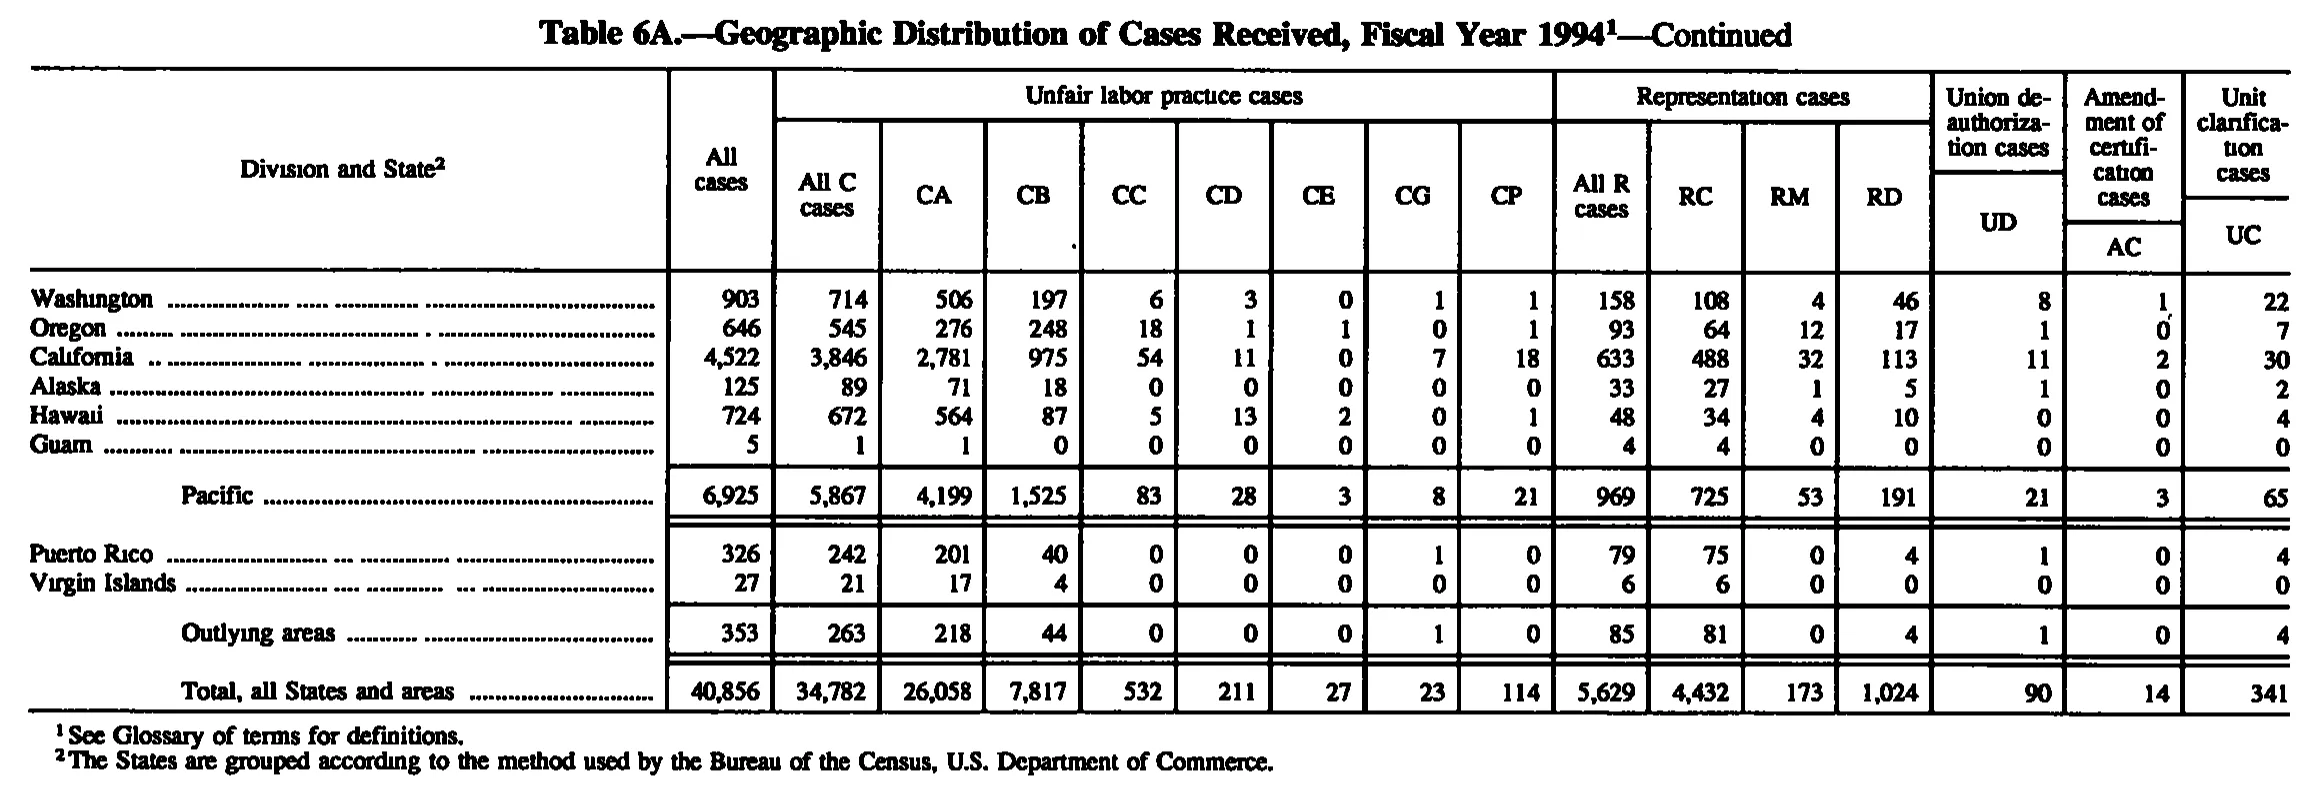
Geographic Distribution of Cases Received, Fiscal Year 1994
Stitched from pp. 114–116.
| Division and State | All cases | Unfair labor practice cases | Representation cases | Union deauthorization cases | Amendment of certification cases | Unit clarification cases | ||||||||||
|---|---|---|---|---|---|---|---|---|---|---|---|---|---|---|---|---|
| Division and State | All cases | All C cases | CA | CB | CC | CD | CE | CG | CP | All R cases | RC | RM | RD | UD | AC | UC |
| Maine | 158 | 132 | 114 | 17 | 0 | 0 | 0 | 1 | 0 | 22 | 18 | 0 | 4 | 0 | 0 | 4 |
| New Hampshire | 83 | 68 | 57 | 9 | 0 | 1 | 1 | 0 | 0 | 14 | 9 | 0 | 5 | 0 | 0 | 1 |
| Vermont | 85 | 81 | 76 | 5 | 0 | 0 | 0 | 0 | 0 | 3 | 3 | 0 | 0 | 0 | 0 | 1 |
| Massachusetts | 1,209 | 1,075 | 867 | 156 | 35 | 12 | 3 | 0 | 2 | 117 | 90 | 3 | 24 | 0 | 1 | 16 |
| Rhode Island | 205 | 175 | 148 | 13 | 12 | 0 | 1 | 0 | 1 | 24 | 19 | 2 | 3 | 1 | 0 | 5 |
| Connecticut | 636 | 535 | 417 | 104 | 10 | 1 | 0 | 1 | 2 | 96 | 85 | 2 | 9 | 2 | 0 | 3 |
| New England | 2,376 | 2,066 | 1,679 | 304 | 57 | 14 | 5 | 2 | 5 | 276 | 224 | 7 | 45 | 3 | 1 | 30 |
| New York | 4,515 | 3,946 | 2,607 | 1,165 | 91 | 51 | 5 | 9 | 18 | 490 | 388 | 16 | 86 | 6 | 2 | 71 |
| New Jersey | 1,692 | 1,393 | 980 | 331 | 43 | 32 | 2 | 0 | 5 | 270 | 214 | 7 | 49 | 11 | 0 | 18 |
| Pennsylvania | 2,567 | 2,153 | 1,617 | 463 | 45 | 18 | 4 | 0 | 6 | 384 | 311 | 14 | 59 | 7 | 1 | 22 |
| Middle Atlantic | 8,774 | 7,492 | 5,204 | 1,959 | 179 | 101 | 11 | 9 | 29 | 1,144 | 913 | 37 | 194 | 24 | 3 | 111 |
| Ohio | 2,356 | 2,013 | 1,582 | 408 | 18 | 1 | 2 | 1 | 1 | 319 | 265 | 5 | 49 | 4 | 0 | 20 |
| Indiana | 1,352 | 1,181 | 902 | 255 | 11 | 5 | 2 | 0 | 6 | 159 | 125 | 5 | 29 | 2 | 0 | 10 |
| Illinois | 2,351 | 1,949 | 1,352 | 475 | 70 | 26 | 0 | 0 | 26 | 383 | 292 | 18 | 73 | 8 | 2 | 9 |
| Michigan | 2,363 | 1,979 | 1,454 | 490 | 23 | 2 | 2 | 2 | 6 | 363 | 292 | 5 | 66 | 10 | 1 | 10 |
| Wisconsin | 698 | 527 | 404 | 114 | 4 | 3 | 0 | 0 | 2 | 157 | 110 | 5 | 42 | 5 | 0 | 9 |
| East North Central | 9,120 | 7,649 | 5,694 | 1,742 | 126 | 37 | 6 | 3 | 41 | 1,381 | 1,084 | 38 | 259 | 29 | 3 | 58 |
| Iowa | 283 | 201 | 164 | 33 | 1 | 3 | 0 | 0 | 0 | 77 | 63 | 2 | 12 | 0 | 0 | 5 |
| Minnesota | 522 | 382 | 264 | 104 | 12 | 1 | 0 | 0 | 1 | 126 | 88 | 1 | 37 | 1 | 0 | 13 |
| Missouri | 1,159 | 943 | 715 | 186 | 18 | 17 | 0 | 0 | 7 | 211 | 160 | 7 | 44 | 4 | 0 | 1 |
| North Dakota | 49 | 43 | 28 | 15 | 0 | 0 | 0 | 0 | 0 | 5 | 1 | 1 | 3 | 0 | 0 | 1 |
| South Dakota | 38 | 29 | 28 | 1 | 0 | 0 | 0 | 0 | 0 | 9 | 9 | 0 | 0 | 0 | 0 | 0 |
| Nebraska | 123 | 95 | 68 | 27 | 0 | 0 | 0 | 0 | 0 | 27 | 20 | 0 | 7 | 0 | 0 | 1 |
| Kansas | 236 | 185 | 147 | 35 | 0 | 3 | 0 | 0 | 0 | 47 | 38 | 1 | 8 | 0 | 0 | 4 |
| West North Central | 2,410 | 1,878 | 1,414 | 401 | 31 | 24 | 0 | 0 | 8 | 502 | 379 | 12 | 111 | 5 | 0 | 25 |
| Delaware | 96 | 80 | 63 | 16 | 1 | 0 | 0 | 0 | 0 | 15 | 10 | 0 | 5 | 0 | 0 | 1 |
| Maryland | 639 | 546 | 393 | 149 | 3 | 0 | 1 | 0 | 0 | 87 | 75 | 0 | 12 | 1 | 0 | 5 |
| District of Columbia | 205 | 174 | 144 | 28 | 2 | 0 | 0 | 0 | 0 | 26 | 26 | 0 | 0 | 0 | 0 | 5 |
| Virginia | 487 | 416 | 323 | 93 | 0 | 0 | 0 | 0 | 0 | 71 | 62 | 1 | 8 | 0 | 0 | 0 |
| West Virginia | 574 | 509 | 411 | 86 | 7 | 1 | 0 | 0 | 4 | 62 | 50 | 2 | 10 | 0 | 0 | 3 |
| North Carolina | 395 | 355 | 284 | 70 | 1 | 0 | 0 | 0 | 0 | 36 | 30 | 1 | 5 | 0 | 1 | 3 |
| South Carolina | 185 | 164 | 123 | 40 | 0 | 0 | 1 | 0 | 0 | 21 | 18 | 0 | 3 | 0 | 0 | 0 |
| Georgia | 780 | 697 | 535 | 160 | 2 | 0 | 0 | 0 | 0 | 77 | 56 | 1 | 20 | 0 | 0 | 6 |
| Florida | 1,263 | 1,121 | 946 | 170 | 4 | 1 | 0 | 0 | 0 | 139 | 127 | 2 | 10 | 0 | 0 | 3 |
| South Atlantic | 4,624 | 4,062 | 3,222 | 812 | 20 | 2 | 2 | 0 | 4 | 534 | 454 | 7 | 73 | 1 | 1 | 26 |
| Kentucky | 728 | 638 | 510 | 120 | 7 | 0 | 0 | 0 | 1 | 84 | 68 | 2 | 14 | 1 | 1 | 4 |
| Tennessee | 659 | 572 | 473 | 90 | 9 | 0 | 0 | 0 | 0 | 85 | 67 | 3 | 15 | 0 | 0 | 2 |
| Alabama | 474 | 400 | 346 | 54 | 0 | 0 | 0 | 0 | 0 | 71 | 55 | 1 | 15 | 0 | 1 | 2 |
| Mississippi | 227 | 208 | 181 | 27 | 0 | 0 | 0 | 0 | 0 | 19 | 15 | 0 | 4 | 0 | 0 | 0 |
| East South Central | 2,088 | 1,818 | 1,510 | 291 | 16 | 0 | 0 | 0 | 1 | 259 | 205 | 6 | 48 | 1 | 2 | 8 |
| Arkansas | 220 | 189 | 162 | 27 | 0 | 0 | 0 | 0 | 0 | 31 | 22 | 0 | 9 | 0 | 0 | 0 |
| Louisiana | 463 | 422 | 354 | 64 | 2 | 0 | 0 | 0 | 2 | 41 | 32 | 1 | 8 | 0 | 0 | 0 |
| Oklahoma | 259 | 219 | 184 | 33 | 0 | 1 | 0 | 0 | 1 | 38 | 28 | 0 | 10 | 1 | 0 | 1 |
| Texas | 1,169 | 1,053 | 815 | 236 | 2 | 0 | 0 | 0 | 0 | 114 | 84 | 4 | 26 | 0 | 1 | 1 |
| West South Central | 2,111 | 1,883 | 1,515 | 360 | 4 | 1 | 0 | 0 | 3 | 224 | 166 | 5 | 53 | 1 | 1 | 2 |
| Montana | 156 | 107 | 95 | 11 | 1 | 0 | 0 | 0 | 0 | 43 | 27 | 3 | 13 | 4 | 0 | 2 |
| Idaho | 100 | 85 | 76 | 9 | 0 | 0 | 0 | 0 | 0 | 15 | 12 | 0 | 3 | 0 | 0 | 0 |
| Wyoming | 72 | 68 | 62 | 6 | 0 | 0 | 0 | 0 | 0 | 4 | 4 | 0 | 0 | 0 | 0 | 0 |
| Colorado | 632 | 575 | 468 | 107 | 0 | 0 | 0 | 0 | 0 | 52 | 41 | 1 | 10 | 0 | 0 | 5 |
| New Mexico | 162 | 135 | 108 | 27 | 0 | 0 | 0 | 0 | 0 | 27 | 26 | 0 | 1 | 0 | 0 | 0 |
| Arizona | 336 | 285 | 194 | 90 | 1 | 0 | 0 | 0 | 0 | 48 | 38 | 2 | 8 | 0 | 0 | 3 |
| Utah | 129 | 107 | 96 | 10 | 0 | 0 | 0 | 0 | 1 | 21 | 19 | 0 | 2 | 0 | 0 | 1 |
| Nevada | 488 | 442 | 304 | 119 | 14 | 4 | 0 | 0 | 1 | 45 | 34 | 2 | 9 | 0 | 0 | 1 |
| Mountain | 2,075 | 1,804 | 1,403 | 379 | 16 | 4 | 0 | 0 | 2 | 255 | 201 | 8 | 46 | 4 | 0 | 12 |
| Washington | 903 | 714 | 506 | 197 | 6 | 3 | 0 | 1 | 1 | 158 | 108 | 4 | 46 | 8 | 1 | 22 |
| Oregon | 646 | 545 | 276 | 248 | 18 | 1 | 1 | 0 | 1 | 93 | 64 | 12 | 17 | 1 | 0 | 7 |
| California | 4,522 | 3,846 | 2,781 | 975 | 54 | 11 | 0 | 7 | 18 | 633 | 488 | 32 | 113 | 11 | 2 | 30 |
| Alaska | 125 | 89 | 71 | 18 | 0 | 0 | 0 | 0 | 0 | 33 | 27 | 1 | 5 | 1 | 0 | 2 |
| Hawaii | 724 | 672 | 564 | 87 | 5 | 13 | 2 | 0 | 1 | 48 | 34 | 4 | 10 | 0 | 0 | 4 |
| Guam | 5 | 1 | 1 | 0 | 0 | 0 | 0 | 0 | 0 | 4 | 4 | 0 | 0 | 0 | 0 | 0 |
| Pacific | 6,925 | 5,867 | 4,199 | 1,525 | 83 | 28 | 3 | 8 | 21 | 969 | 725 | 53 | 191 | 21 | 3 | 65 |
| Puerto Rico | 326 | 242 | 201 | 40 | 0 | 0 | 0 | 1 | 0 | 79 | 75 | 0 | 4 | 1 | 0 | 4 |
| Virgin Islands | 27 | 21 | 17 | 4 | 0 | 0 | 0 | 0 | 0 | 6 | 6 | 0 | 0 | 0 | 0 | 0 |
| Outlying areas | 353 | 263 | 218 | 44 | 0 | 0 | 0 | 1 | 0 | 85 | 81 | 0 | 4 | 1 | 0 | 4 |
| Total, all States and areas | 40,856 | 34,782 | 26,058 | 7,817 | 532 | 211 | 27 | 23 | 114 | 5,629 | 4,432 | 173 | 1,024 | 90 | 14 | 341 |
- 1 See Glossary of terms for definitions.
- 2 The States are grouped according to the method used by the Bureau of the Census, U.S. Department of Commerce.
738 of 738 figures sit in a row or column sum that works out.
Reader’s notes
p. 114. The crop ends mid-table: the last transcribed row (Virginia) sits at the bottom edge, and the remaining South Atlantic states, the later divisions, the U.S. total and any footnote texts continue on the rest of the page / following page. Footnote markers 1 (on the caption) and 2 (on the stub heading "Division and State") are printed, but no footnote text is visible in this crop, so `footnotes` is empty. Heading structure: "All cases" is a tall single heading spanning both heading levels (repeated in both). The three right-hand headings are tall blocks whose code lines sit at different heights — "Union deauthorization cases" over UD, "Amendment of certification cases" over AC, "Unit clarification cases" over UC — and have been split into the two levels as spanner + code. All printed division subtotals (New England, Middle Atlantic, East North Central, West North Central) add up exactly from their member states in every column, and the row identities (All cases = All C + All R + UD + AC + UC; All C = CA+CB+CC+CD+CE+CG+CP) check out on the rows spot-tested, so column alignment is well corroborated. In particular Missouri's UC value of 1 (low relative to its neighbours) is confirmed by both the row total (943+211+4+0+1 = 1,159) and the division UC total (25). The scan uses a dotless-i glyph in many words (Ohıo, Illinoıs, Mıchıgan, Wısconsın, Mıssourı, Pennsylvanıa, Unıon, clarıfıcatıon); these have been transcribed with normal "i".
p. 115. Continuation page of Table 6A (the caption carries "—Continued"); no footnote texts are printed under the table on this crop, although the stub heading carries marker 2 and the caption carries marker 1. The "South Atlantic" subtotal does not equal the sum of the five South Atlantic states shown here (e.g. All C cases 4,062 vs. 509+355+164+697+1,121 = 2,846); the remaining states of that division are printed on the preceding page, so the crop begins mid-division. All other printed subtotals (East South Central, West South Central, Mountain) reconcile with the rows shown, and every row's "All cases" equals the sum of its component columns as printed. The image is a lightly speckled scan: several stray ink specks sit in the data area (e.g. a dot left of the "4" in the Nevada CD column and a dot above the Montana row in the stub), but they are not footnote markers and are not transcribed. Division subtotal labels are indented in the original; the indentation is not reproduced in the stub cells.
p. 116. 17 columns: stub plus 16 numeric columns. The page continues Table 6A from earlier pages, so only the Pacific division, the outlying areas and the grand total appear here; the preceding divisions are on the previous pages. Two heading levels. "Division and State" (carrying footnote marker 2) and "All cases" are tall single headings repeated in both levels; "Unfair labor practice cases" spans the eight columns All C cases through CP, and "Representation cases" spans All R cases through RD. The three right-hand headings are printed stacked over their single code cell and were joined across their hyphenated line breaks: "Union de-/authorization cases" over UD, "Amend-/ment of/certifi-/cation cases" over AC, and "Unit/clarifica-/tion cases" over UC. "Pacific", "Outlying areas" and "Total, all States and areas" are indented subtotal/total lines, printed between rules; their labels are transcribed without the leading indentation. All printed row and column totals on this crop add up correctly (e.g. Pacific all cases 6,925 and the grand total 40,856), so no misprints are suspected. The scan is clean; no cell was doubtful.
Source image
Source data: U.S. NLRB Annual Reports (public domain). Reconstruction by NLRB Stats Archive. Read by claude-opus-5 (effort max, prompt extract_v1) from the 300-dpi scan; stitched by page. Updated October 2026.