NLRB Stats Archive › Annual Reports › FY1993 › Distribution of Unfair Labor Practice Situations Received, by Number of Employees in Establishments, Fiscal Year 1993
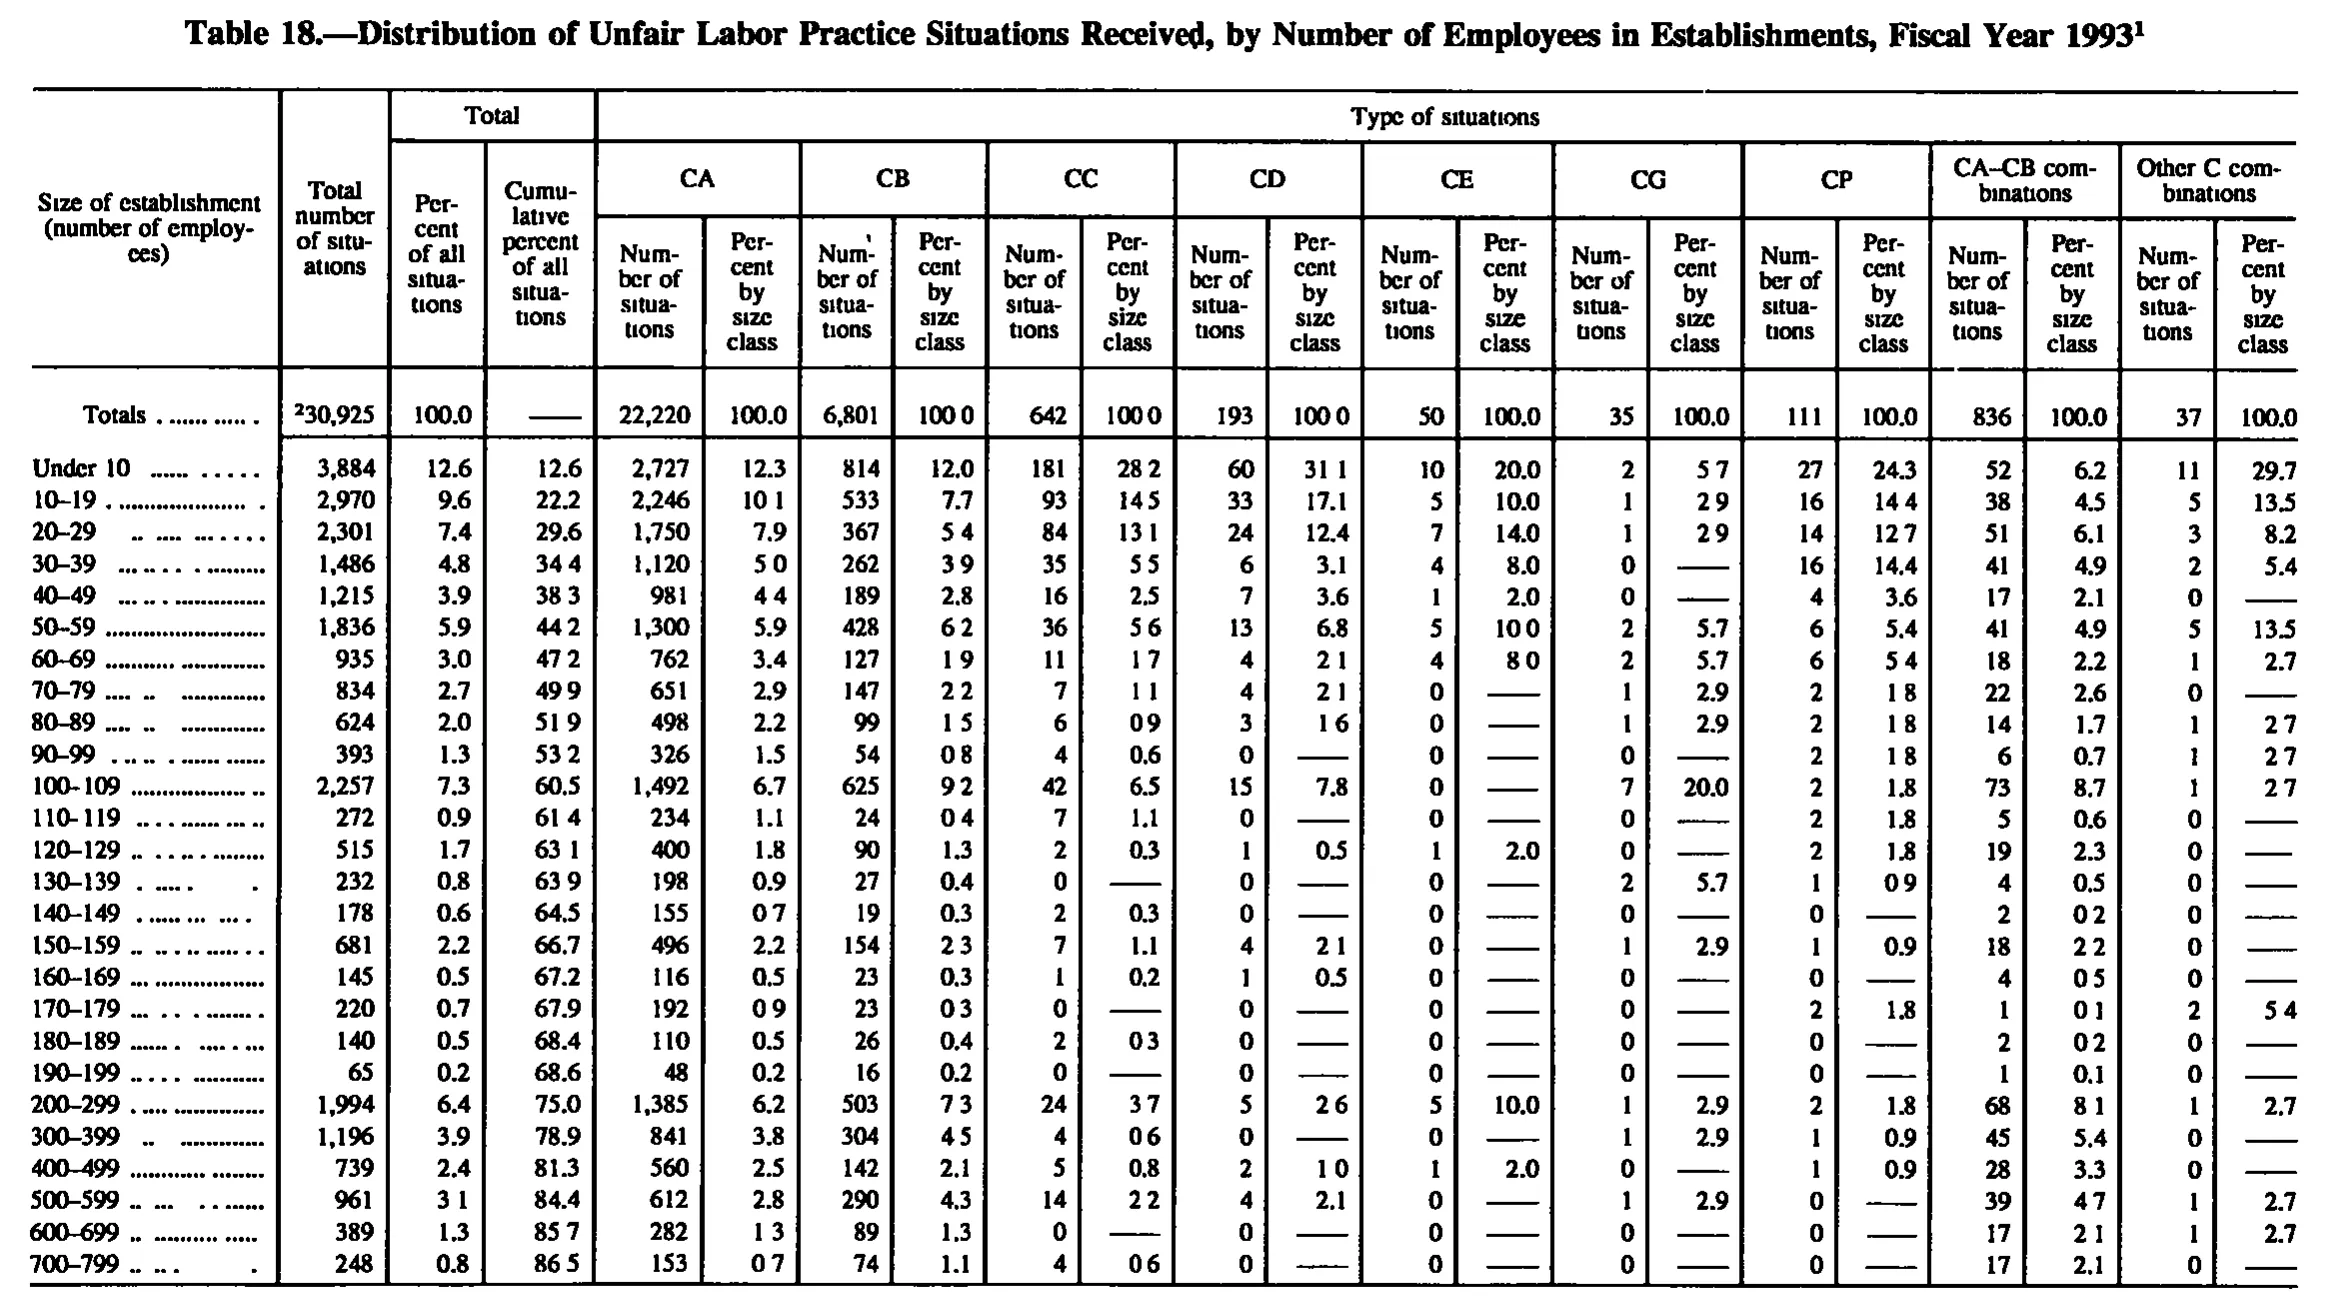
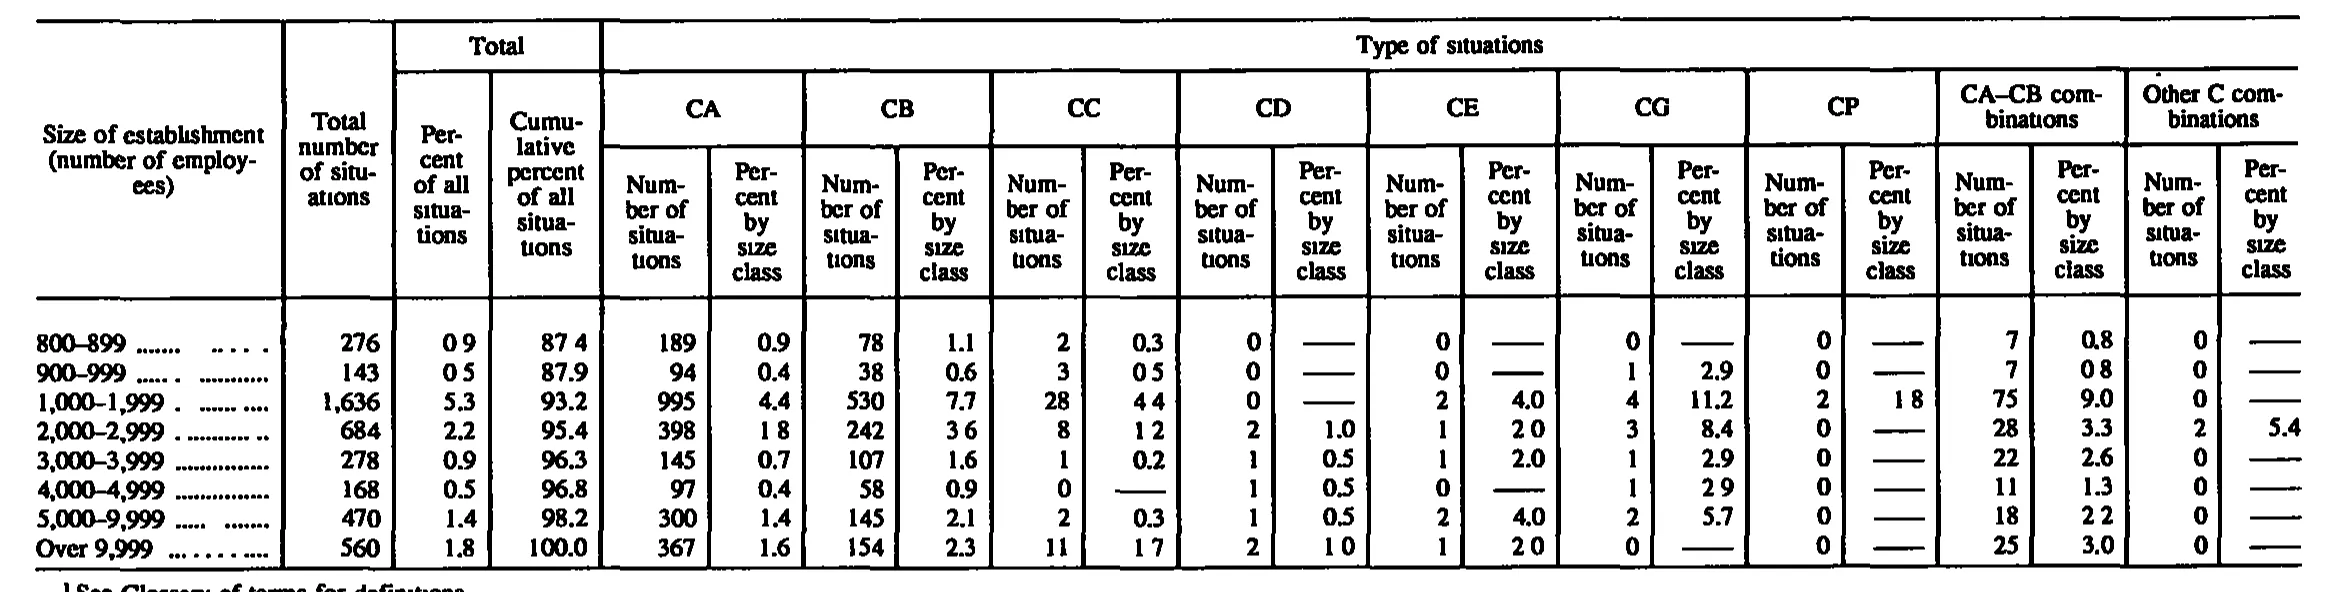
Distribution of Unfair Labor Practice Situations Received, by Number of Employees in Establishments, Fiscal Year 1993
Stitched from pp. 173–174.
| Size of establishment (number of employees) | Total number of situations | Total | Type of situations | ||||||||||||||||||
|---|---|---|---|---|---|---|---|---|---|---|---|---|---|---|---|---|---|---|---|---|---|
| Size of establishment (number of employees) | Total number of situations | Percent of all situations | Cumulative percent of all situations | CA | CB | CC | CD | CE | CG | CP | CA-CB combinations | Other C combinations | |||||||||
| Size of establishment (number of employees) | Total number of situations | Percent of all situations | Cumulative percent of all situations | Number of situations | Percent by size class | Number of situations | Percent by size class | Number of situations | Percent by size class | Number of situations | Percent by size class | Number of situations | Percent by size class | Number of situations | Percent by size class | Number of situations | Percent by size class | Number of situations | Percent by size class | Number of situations | Percent by size class |
| Totals | 30,925 | 100.0 | 22,220 | 100.0 | 6,801 | 100.0 | 642 | 100.0 | 193 | 100.0 | 50 | 100.0 | 35 | 100.0 | 111 | 100.0 | 836 | 100.0 | 37 | 100.0 | |
| Under 10 | 3,884 | 12.6 | 12.6 | 2,727 | 12.3 | 814 | 12.0 | 181 | 28.2 | 60 | 31.1 | 10 | 20.0 | 2 | 5.7 | 27 | 24.3 | 52 | 6.2 | 11 | 29.7 |
| 10–19 | 2,970 | 9.6 | 22.2 | 2,246 | 10.1 | 533 | 7.7 | 93 | 14.5 | 33 | 17.1 | 5 | 10.0 | 1 | 2.9 | 16 | 14.4 | 38 | 4.5 | 5 | 13.5 |
| 20–29 | 2,301 | 7.4 | 29.6 | 1,750 | 7.9 | 367 | 5.4 | 84 | 13.1 | 24 | 12.4 | 7 | 14.0 | 1 | 2.9 | 14 | 12.7 | 51 | 6.1 | 3 | 8.2 |
| 30–39 | 1,486 | 4.8 | 34.4 | 1,120 | 5.0 | 262 | 3.9 | 35 | 5.5 | 6 | 3.1 | 4 | 8.0 | 0 | 16 | 14.4 | 41 | 4.9 | 2 | 5.4 | |
| 40–49 | 1,215 | 3.9 | 38.3 | 981 | 4.4 | 189 | 2.8 | 16 | 2.5 | 7 | 3.6 | 1 | 2.0 | 0 | 4 | 3.6 | 17 | 2.1 | 0 | ||
| 50–59 | 1,836 | 5.9 | 44.2 | 1,300 | 5.9 | 428 | 6.2 | 36 | 5.6 | 13 | 6.8 | 5 | 10.0 | 2 | 5.7 | 6 | 5.4 | 41 | 4.9 | 5 | 13.5 |
| 60–69 | 935 | 3.0 | 47.2 | 762 | 3.4 | 127 | 1.9 | 11 | 1.7 | 4 | 2.1 | 4 | 8.0 | 2 | 5.7 | 6 | 5.4 | 18 | 2.2 | 1 | 2.7 |
| 70–79 | 834 | 2.7 | 49.9 | 651 | 2.9 | 147 | 2.2 | 7 | 1.1 | 4 | 2.1 | 0 | 1 | 2.9 | 2 | 1.8 | 22 | 2.6 | 0 | ||
| 80–89 | 624 | 2.0 | 51.9 | 498 | 2.2 | 99 | 1.5 | 6 | 0.9 | 3 | 1.6 | 0 | 1 | 2.9 | 2 | 1.8 | 14 | 1.7 | 1 | 2.7 | |
| 90–99 | 393 | 1.3 | 53.2 | 326 | 1.5 | 54 | 0.8 | 4 | 0.6 | 0 | 0 | 0 | 2 | 1.8 | 6 | 0.7 | 1 | 2.7 | |||
| 100–109 | 2,257 | 7.3 | 60.5 | 1,492 | 6.7 | 625 | 9.2 | 42 | 6.5 | 15 | 7.8 | 0 | 7 | 20.0 | 2 | 1.8 | 73 | 8.7 | 1 | 2.7 | |
| 110–119 | 272 | 0.9 | 61.4 | 234 | 1.1 | 24 | 0.4 | 7 | 1.1 | 0 | 0 | 0 | 2 | 1.8 | 5 | 0.6 | 0 | ||||
| 120–129 | 515 | 1.7 | 63.1 | 400 | 1.8 | 90 | 1.3 | 2 | 0.3 | 1 | 0.5 | 1 | 2.0 | 0 | 2 | 1.8 | 19 | 2.3 | 0 | ||
| 130–139 | 232 | 0.8 | 63.9 | 198 | 0.9 | 27 | 0.4 | 0 | 0 | 0 | 2 | 5.7 | 1 | 0.9 | 4 | 0.5 | 0 | ||||
| 140–149 | 178 | 0.6 | 64.5 | 155 | 0.7 | 19 | 0.3 | 2 | 0.3 | 0 | 0 | 0 | 0 | 2 | 0.2 | 0 | |||||
| 150–159 | 681 | 2.2 | 66.7 | 496 | 2.2 | 154 | 2.3 | 7 | 1.1 | 4 | 2.1 | 0 | 1 | 2.9 | 1 | 0.9 | 18 | 2.2 | 0 | ||
| 160–169 | 145 | 0.5 | 67.2 | 116 | 0.5 | 23 | 0.3 | 1 | 0.2 | 1 | 0.5 | 0 | 0 | 0 | 4 | 0.5 | 0 | ||||
| 170–179 | 220 | 0.7 | 67.9 | 192 | 0.9 | 23 | 0.3 | 0 | 0 | 0 | 0 | 2 | 1.8 | 1 | 0.1 | 2 | 5.4 | ||||
| 180–189 | 140 | 0.5 | 68.4 | 110 | 0.5 | 26 | 0.4 | 2 | 0.3 | 0 | 0 | 0 | 0 | 2 | 0.2 | 0 | |||||
| 190–199 | 65 | 0.2 | 68.6 | 48 | 0.2 | 16 | 0.2 | 0 | 0 | 0 | 0 | 0 | 1 | 0.1 | 0 | ||||||
| 200–299 | 1,994 | 6.4 | 75.0 | 1,385 | 6.2 | 503 | 7.3 | 24 | 3.7 | 5 | 2.6 | 5 | 10.0 | 1 | 2.9 | 2 | 1.8 | 68 | 8.1 | 1 | 2.7 |
| 300–399 | 1,196 | 3.9 | 78.9 | 841 | 3.8 | 304 | 4.5 | 4 | 0.6 | 0 | 0 | 1 | 2.9 | 1 | 0.9 | 45 | 5.4 | 0 | |||
| 400–499 | 739 | 2.4 | 81.3 | 560 | 2.5 | 142 | 2.1 | 5 | 0.8 | 2 | 1.0 | 1 | 2.0 | 0 | 1 | 0.9 | 28 | 3.3 | 0 | ||
| 500–599 | 961 | 3.1 | 84.4 | 612 | 2.8 | 290 | 4.3 | 14 | 2.2 | 4 | 2.1 | 0 | 1 | 2.9 | 0 | 39 | 4.7 | 1 | 2.7 | ||
| 600–699 | 389 | 1.3 | 85.7 | 282 | 1.3 | 89 | 1.3 | 0 | 0 | 0 | 0 | 0 | 17 | 2.1 | 1 | 2.7 | |||||
| 700–799 | 248 | 0.8 | 86.5 | 153 | 0.7 | 74 | 1.1 | 4 | 0.6 | 0 | 0 | 0 | 0 | 17 | 2.1 | 0 | |||||
| 800–899 | 276 | 0.9 | 87.4 | 189 | 0.9 | 78 | 1.1 | 2 | 0.3 | 0 | 0 | 0 | 0 | 7 | 0.8 | 0 | |||||
| 900–999 | 143 | 0.5 | 87.9 | 94 | 0.4 | 38 | 0.6 | 3 | 0.5 | 0 | 0 | 1 | 2.9 | 0 | 7 | 0.8 | 0 | ||||
| 1,000–1,999 | 1,636 | 5.3 | 93.2 | 995 | 4.4 | 530 | 7.7 | 28 | 4.4 | 0 | 2 | 4.0 | 4 | 11.2 | 2 | 1.8 | 75 | 9.0 | 0 | ||
| 2,000–2,999 | 684 | 2.2 | 95.4 | 398 | 1.8 | 242 | 3.6 | 8 | 1.2 | 2 | 1.0 | 1 | 2.0 | 3 | 8.4 | 0 | 28 | 3.3 | 2 | 5.4 | |
| 3,000–3,999 | 278 | 0.9 | 96.3 | 145 | 0.7 | 107 | 1.6 | 1 | 0.2 | 1 | 0.5 | 1 | 2.0 | 1 | 2.9 | 0 | 22 | 2.6 | 0 | ||
| 4,000–4,999 | 168 | 0.5 | 96.8 | 97 | 0.4 | 58 | 0.9 | 0 | 1 | 0.5 | 0 | 1 | 2.9 | 0 | 11 | 1.3 | 0 | ||||
| 5,000–9,999 | 470 | 1.4 | 98.2 | 300 | 1.4 | 145 | 2.1 | 2 | 0.3 | 1 | 0.5 | 2 | 4.0 | 2 | 5.7 | 0 | 18 | 2.2 | 0 | ||
| Over 9,999 | 560 | 1.8 | 100.0 | 367 | 1.6 | 154 | 2.3 | 11 | 1.7 | 2 | 1.0 | 1 | 2.0 | 0 | 0 | 25 | 3.0 | 0 | |||
- 1 See Glossary of terms for definitions.
264 of 264 figures sit in a row or column sum that works out.
Reader’s notes
p. 173. The crop ends after the "700–799" row; the table continues (larger size classes and any further totals) on the following page, and no footnote text is visible in this crop, so `footnotes` is empty even though markers 1 (on the caption) and 2 (on the Totals "30,925") are printed. 22 printed columns: stub, "Total number of situations", the two "Total" percent columns, and nine Number/Percent pairs (CA, CB, CC, CD, CE, CG, CP, CA-CB combinations, Other C combinations). "Size of establishment" and "Total number of situations" are tall headings spanning all three levels and are repeated in each. Decimal points: in this scan the period is frequently lost, so many percent cells print as e.g. "100 0", "10 1", "28 2", "34 4". I have written them with the decimal point (100.0, 10.1, 28.2, 34.4) because every column is typeset to one decimal place and the cumulative-percent column reconciles exactly with the percent column on this reading (12.6, 22.2, 29.6, 34.4, 38.3, 44.2, 47.2, 49.9, 51.9, 53.2, 60.5, 61.4, 63.1, 63.9, 64.5, 66.7, 67.2, 67.9, 68.4, 68.6, 75.0, 78.9, 81.3, 84.4, 85.7, 86.5). No digits were altered. Doubtful cell: row "20–29", column "CP / Percent by size class" reads as "12 7" (transcribed 12.7); 14 of the CP total of 111 would give 12.6, so this is either a misprint or a 6/7 misread at this resolution. Dash rules ("——") in percent columns, and the "——" in the Totals row's cumulative-percent cell, are transcribed as empty strings; printed zeros are kept as 0. Row-label range dashes are rendered inconsistently in the scan (the "100–109" and "110–119" labels look like short hyphens); I have used an en dash uniformly. The "CA–CB combinations" heading is written with a plain hyphen.
p. 174. This crop is the concluding portion of a table carried over from the preceding page: the column headings are reprinted in full, but the body begins mid-series at the 800-899 size class, so earlier size classes (and any total line) are on the previous page. There is no total/summary row on this crop. Column structure: 22 columns — stub; a tall "Total number of situations" column; "Total" spanning "Percent of all situations" and "Cumulative percent of all situations"; and "Type of situations" spanning nine Number/Percent pairs (CA, CB, CC, CD, CE, CG, CP, CA-CB combinations, Other C combinations). Decimal points: the scan renders many decimal points as a faint gap rather than a visible dot (e.g. the 800-899 percent-of-all prints as "0 9", its cumulative as "87 4"; likewise 900-999 "0 5", the CC percent "0 5", the 1,000-1,999 CC "4 4" and CP "1 8", the 2,000-2,999 CA "1 8" / CB "3 6" / CC "1 2" / CE "2 0", the 4,000-4,999 CG "2 9", the 5,000-9,999 CA-CB "2 2", and the Over 9,999 CC "1 7" / CD "1 0" / CE "2 0"). Given the one-decimal format used throughout these columns, all have been transcribed with a decimal point. Dash rules: every percent-by-size-class cell printed with an em-dash rule (all the zero-count classes) is transcribed as an empty cell. Doubtful cells: in the 1,000-1,999 row the leading "1" of "1,636" is thin and sits low, but the value is legible as 1,636. The footnote line at the foot of the crop is clipped horizontally through the middle of the letters — only the upper halves survive — so its wording ("See Glossary of terms for definitions") is a best reading and the trailing period is inferred; the marker "1" is clear. The footnote marker's anchor is not on this crop (it belongs to the caption or a heading on the preceding page).
Source image
Source data: U.S. NLRB Annual Reports (public domain). Reconstruction by NLRB Stats Archive. Read by claude-opus-5 (effort max, prompt extract_v1) from the 300-dpi scan; stitched by page. Updated October 2026.