NLRB Stats Archive › Annual Reports › FY1993 › Industrial Distribution of Representation Elections Held in Cases Closed, Fiscal Year 1993
Industrial Distribution of Representation Elections Held in Cases Closed, Fiscal Year 1993
Stitched from pp. 168–170.
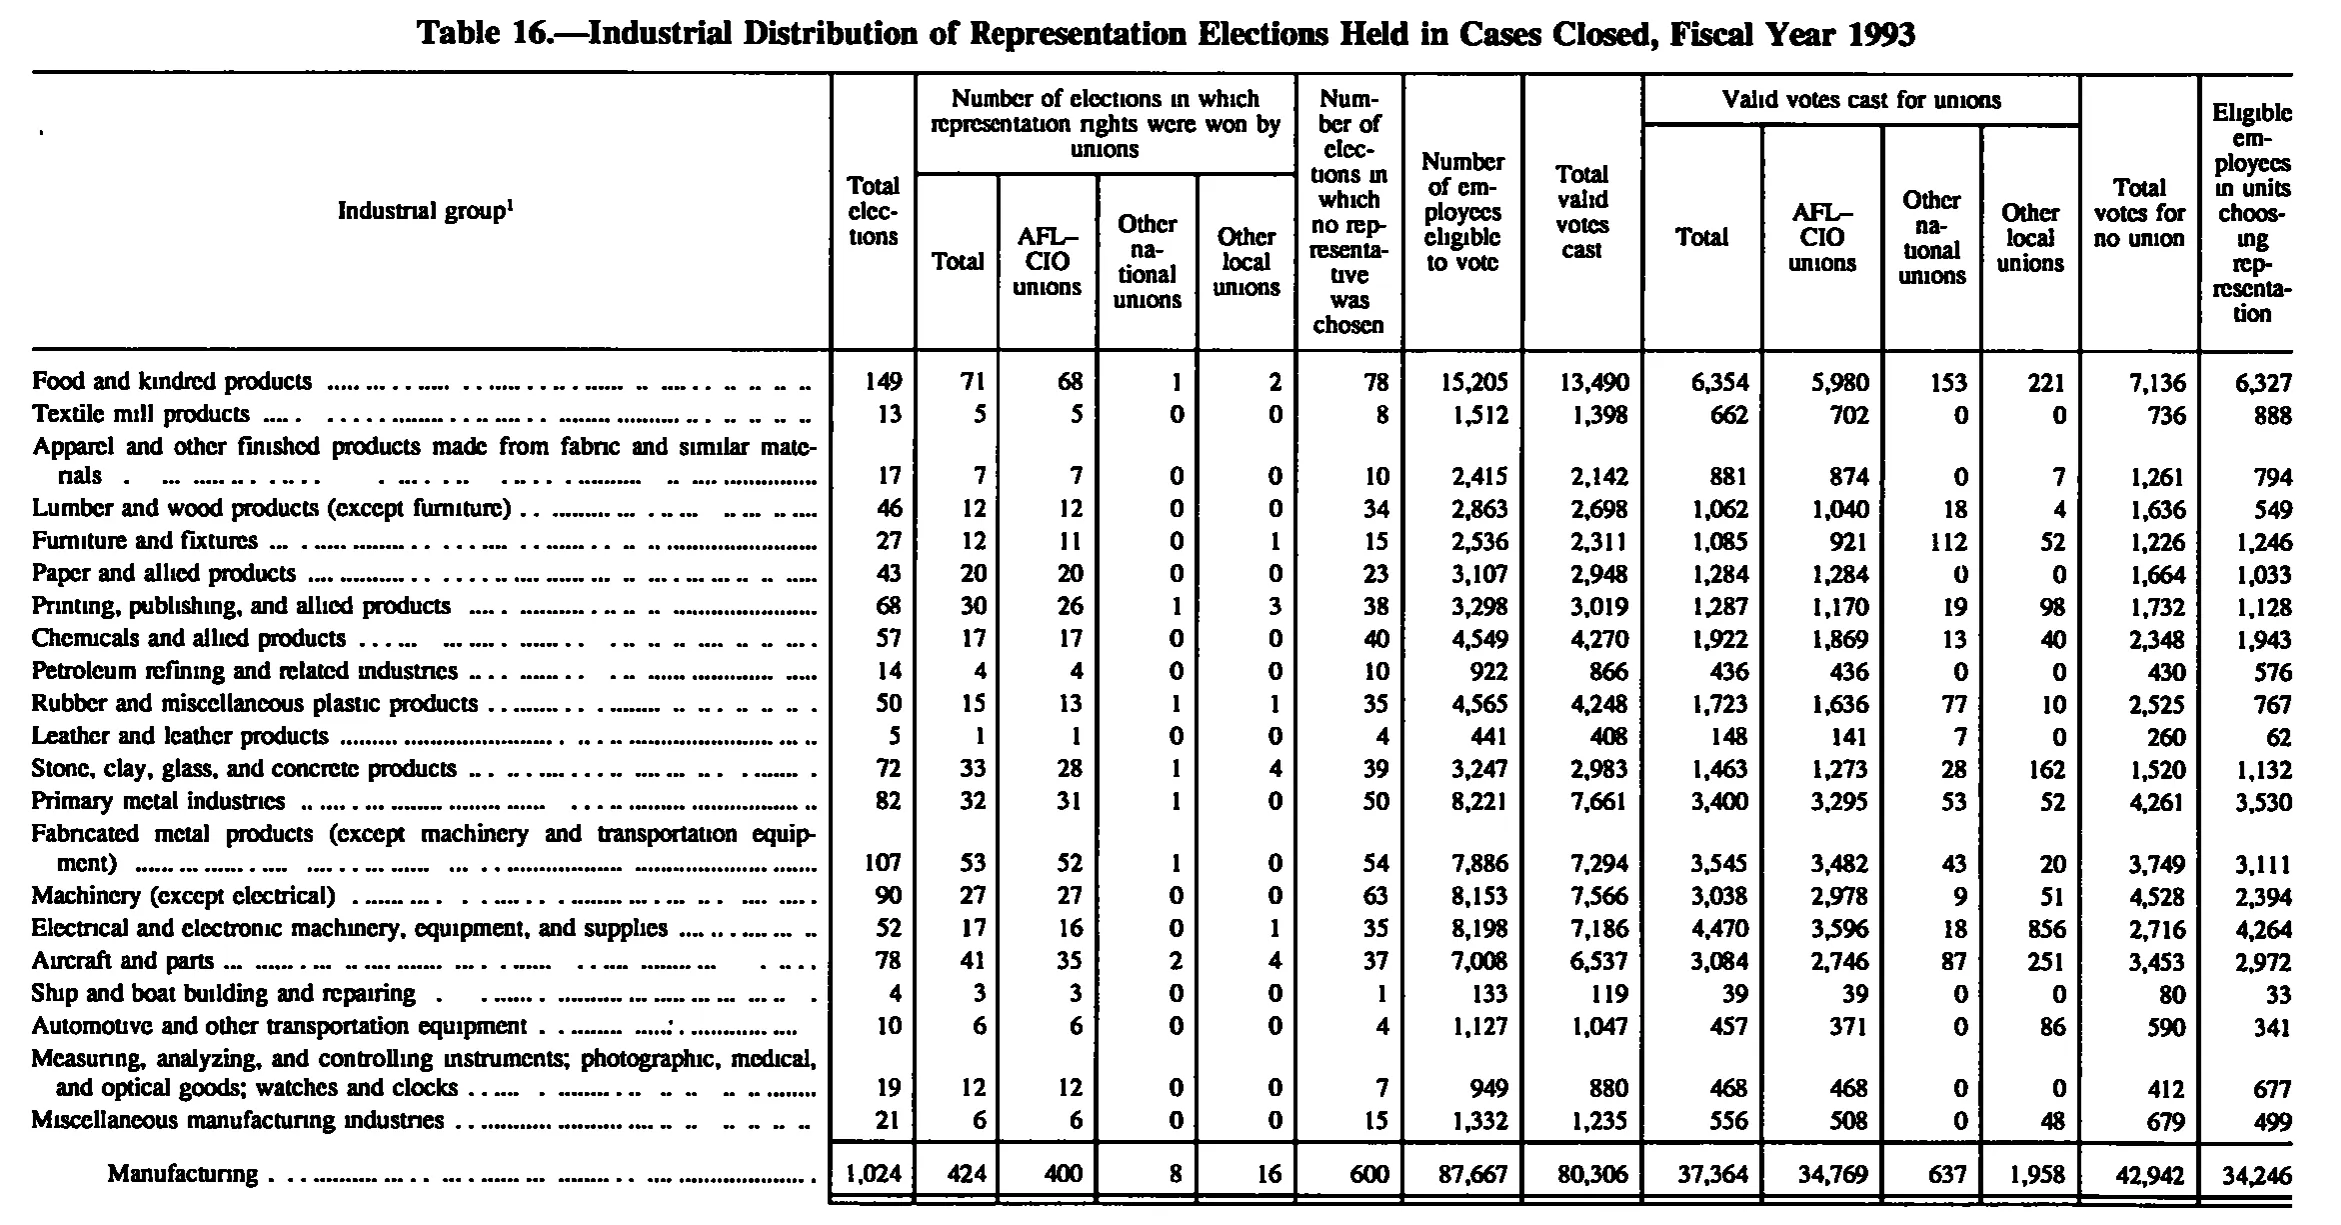
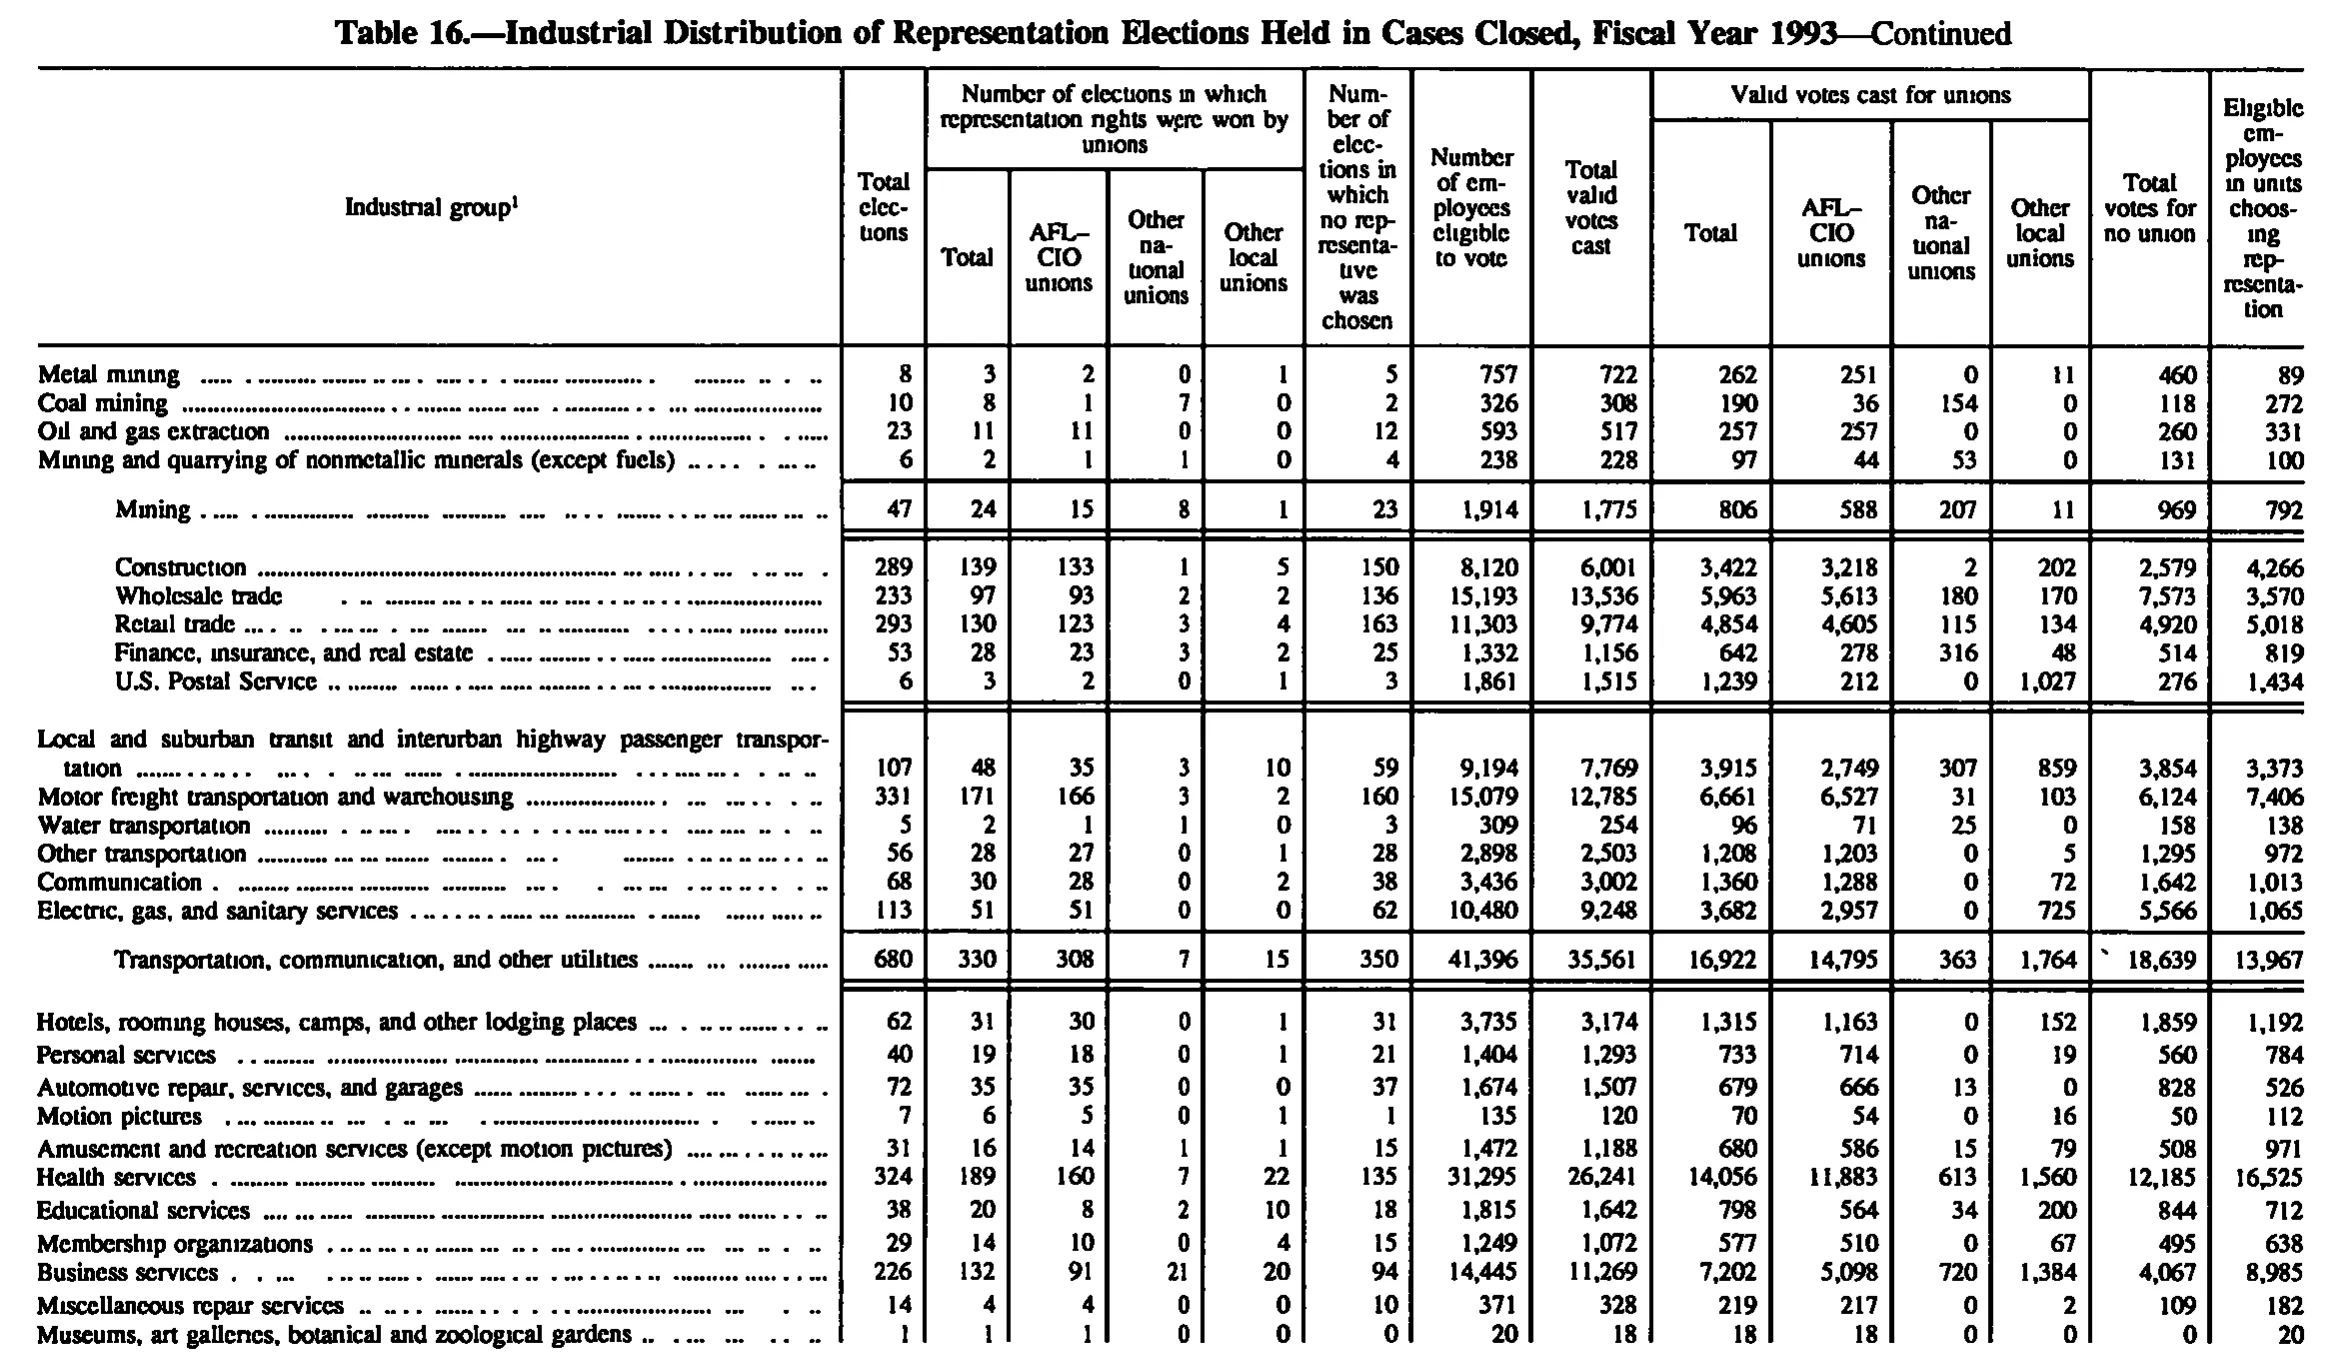
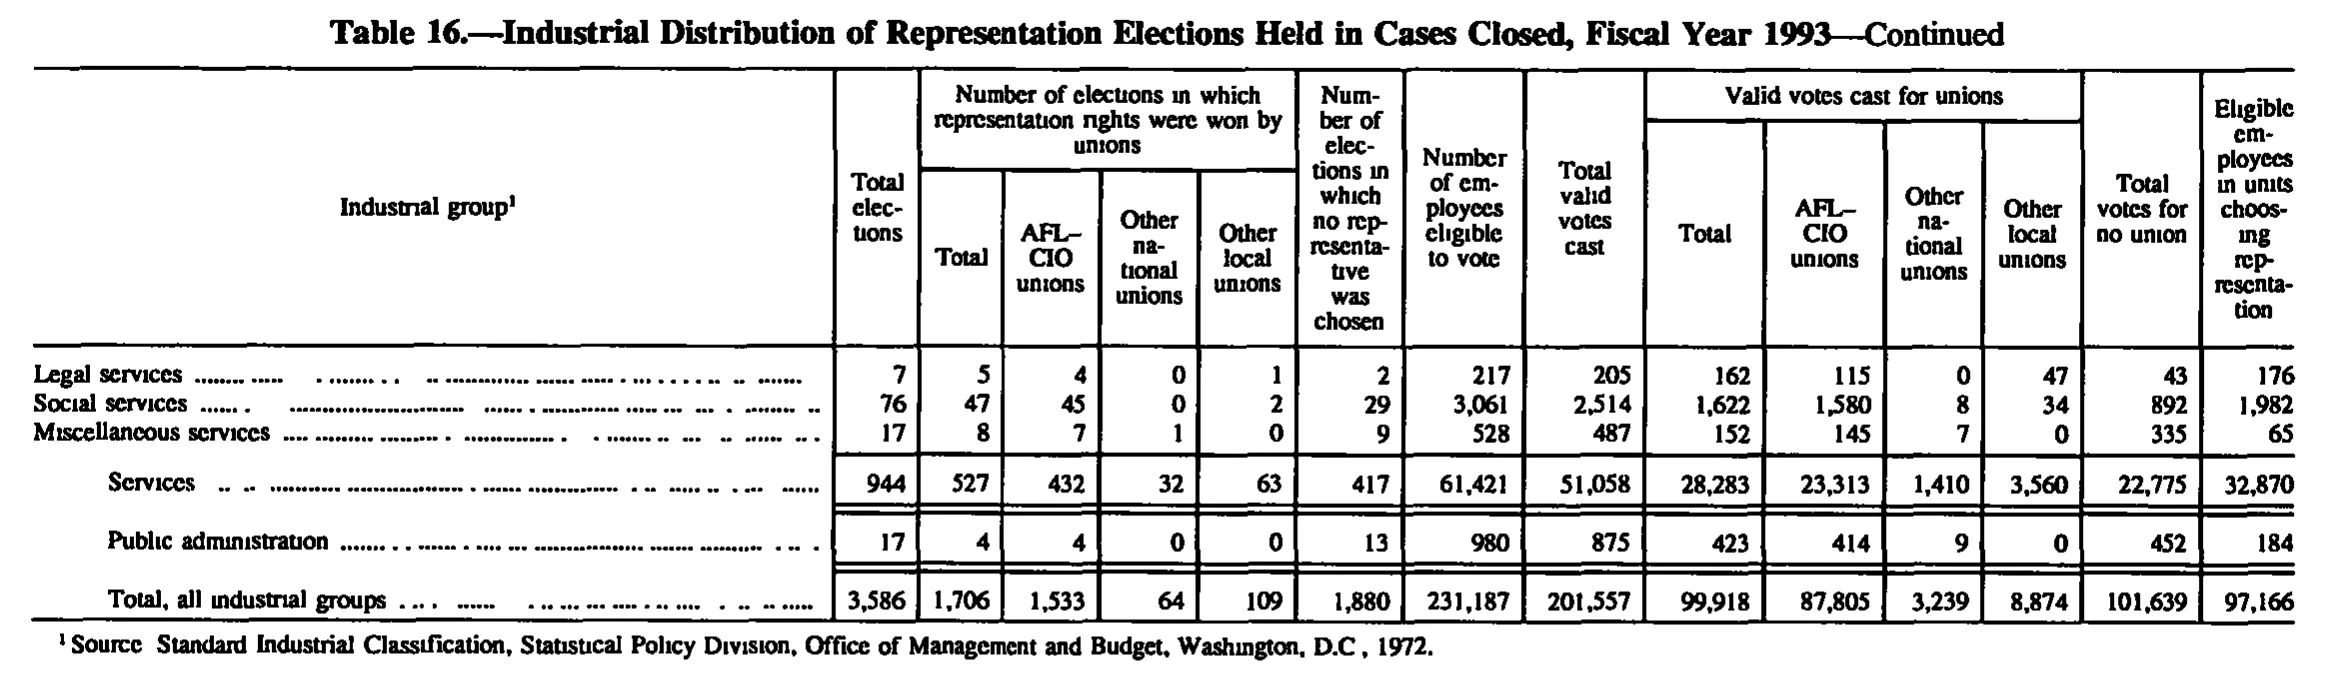
| Industrial group | Total elections | Number of elections in which representation rights were won by unions | Number of elections in which no representative was chosen | Number of employees eligible to vote | Total valid votes cast | Valid votes cast for unions | Total votes for no union | Eligible employees in units choosing representation | ||||||
|---|---|---|---|---|---|---|---|---|---|---|---|---|---|---|
| Industrial group | Total elections | Total | AFL-CIO unions | Other national unions | Other local unions | Number of elections in which no representative was chosen | Number of employees eligible to vote | Total valid votes cast | Total | AFL-CIO unions | Other national unions | Other local unions | Total votes for no union | Eligible employees in units choosing representation |
| Food and kindred products | 149 | 71 | 68 | 1 | 2 | 78 | 15,205 | 13,490 | 6,354 | 5,980 | 153 | 221 | 7,136 | 6,327 |
| Textile mill products | 13 | 5 | 5 | 0 | 0 | 8 | 1,512 | 1,398 | 662 | 702 | 0 | 0 | 736 | 888 |
| Apparel and other finished products made from fabric and similar materials | 17 | 7 | 7 | 0 | 0 | 10 | 2,415 | 2,142 | 881 | 874 | 0 | 7 | 1,261 | 794 |
| Lumber and wood products (except furniture) | 46 | 12 | 12 | 0 | 0 | 34 | 2,863 | 2,698 | 1,062 | 1,040 | 18 | 4 | 1,636 | 549 |
| Furniture and fixtures | 27 | 12 | 11 | 0 | 1 | 15 | 2,536 | 2,311 | 1,085 | 921 | 112 | 52 | 1,226 | 1,246 |
| Paper and allied products | 43 | 20 | 20 | 0 | 0 | 23 | 3,107 | 2,948 | 1,284 | 1,284 | 0 | 0 | 1,664 | 1,033 |
| Printing, publishing, and allied products | 68 | 30 | 26 | 1 | 3 | 38 | 3,298 | 3,019 | 1,287 | 1,170 | 19 | 98 | 1,732 | 1,128 |
| Chemicals and allied products | 57 | 17 | 17 | 0 | 0 | 40 | 4,549 | 4,270 | 1,922 | 1,869 | 13 | 40 | 2,348 | 1,943 |
| Petroleum refining and related industries | 14 | 4 | 4 | 0 | 0 | 10 | 922 | 866 | 436 | 436 | 0 | 0 | 430 | 576 |
| Rubber and miscellaneous plastic products | 50 | 15 | 13 | 1 | 1 | 35 | 4,565 | 4,248 | 1,723 | 1,636 | 77 | 10 | 2,525 | 767 |
| Leather and leather products | 5 | 1 | 1 | 0 | 0 | 4 | 441 | 408 | 148 | 141 | 7 | 0 | 260 | 62 |
| Stone, clay, glass, and concrete products | 72 | 33 | 28 | 1 | 4 | 39 | 3,247 | 2,983 | 1,463 | 1,273 | 28 | 162 | 1,520 | 1,132 |
| Primary metal industries | 82 | 32 | 31 | 1 | 0 | 50 | 8,221 | 7,661 | 3,400 | 3,295 | 53 | 52 | 4,261 | 3,530 |
| Fabricated metal products (except machinery and transportation equipment) | 107 | 53 | 52 | 1 | 0 | 54 | 7,886 | 7,294 | 3,545 | 3,482 | 43 | 20 | 3,749 | 3,111 |
| Machinery (except electrical) | 90 | 27 | 27 | 0 | 0 | 63 | 8,153 | 7,566 | 3,038 | 2,978 | 9 | 51 | 4,528 | 2,394 |
| Electrical and electronic machinery, equipment, and supplies | 52 | 17 | 16 | 0 | 1 | 35 | 8,198 | 7,186 | 4,470 | 3,596 | 18 | 856 | 2,716 | 4,264 |
| Aircraft and parts | 78 | 41 | 35 | 2 | 4 | 37 | 7,008 | 6,537 | 3,084 | 2,746 | 87 | 251 | 3,453 | 2,972 |
| Ship and boat building and repairing | 4 | 3 | 3 | 0 | 0 | 1 | 133 | 119 | 39 | 39 | 0 | 0 | 80 | 33 |
| Automotive and other transportation equipment | 10 | 6 | 6 | 0 | 0 | 4 | 1,127 | 1,047 | 457 | 371 | 0 | 86 | 590 | 341 |
| Measuring, analyzing, and controlling instruments; photographic, medical, and optical goods; watches and clocks | 19 | 12 | 12 | 0 | 0 | 7 | 949 | 880 | 468 | 468 | 0 | 0 | 412 | 677 |
| Miscellaneous manufacturing industries | 21 | 6 | 6 | 0 | 0 | 15 | 1,332 | 1,235 | 556 | 508 | 0 | 48 | 679 | 499 |
| Manufacturing | 1,024 | 424 | 400 | 8 | 16 | 600 | 87,667 | 80,306 | 37,364 | 34,769 | 637 | 1,958 | 42,942 | 34,246 |
| Metal mining | 8 | 3 | 2 | 0 | 1 | 5 | 757 | 722 | 262 | 251 | 0 | 11 | 460 | 89 |
| Coal mining | 10 | 8 | 1 | 7 | 0 | 2 | 326 | 308 | 190 | 36 | 154 | 0 | 118 | 272 |
| Oil and gas extraction | 23 | 11 | 11 | 0 | 0 | 12 | 593 | 517 | 257 | 257 | 0 | 0 | 260 | 331 |
| Mining and quarrying of nonmetallic minerals (except fuels) | 6 | 2 | 1 | 1 | 0 | 4 | 238 | 228 | 97 | 44 | 53 | 0 | 131 | 100 |
| Mining | 47 | 24 | 15 | 8 | 1 | 23 | 1,914 | 1,775 | 806 | 588 | 207 | 11 | 969 | 792 |
| Construction | 289 | 139 | 133 | 1 | 5 | 150 | 8,120 | 6,001 | 3,422 | 3,218 | 2 | 202 | 2,579 | 4,266 |
| Wholesale trade | 233 | 97 | 93 | 2 | 2 | 136 | 15,193 | 13,536 | 5,963 | 5,613 | 180 | 170 | 7,573 | 3,570 |
| Retail trade | 293 | 130 | 123 | 3 | 4 | 163 | 11,303 | 9,774 | 4,854 | 4,605 | 115 | 134 | 4,920 | 5,018 |
| Finance, insurance, and real estate | 53 | 28 | 23 | 3 | 2 | 25 | 1,332 | 1,156 | 642 | 278 | 316 | 48 | 514 | 819 |
| U.S. Postal Service | 6 | 3 | 2 | 0 | 1 | 3 | 1,861 | 1,515 | 1,239 | 212 | 0 | 1,027 | 276 | 1,434 |
| Local and suburban transit and interurban highway passenger transportation | 107 | 48 | 35 | 3 | 10 | 59 | 9,194 | 7,769 | 3,915 | 2,749 | 307 | 859 | 3,854 | 3,373 |
| Motor freight transportation and warehousing | 331 | 171 | 166 | 3 | 2 | 160 | 15,079 | 12,785 | 6,661 | 6,527 | 31 | 103 | 6,124 | 7,406 |
| Water transportation | 5 | 2 | 1 | 1 | 0 | 3 | 309 | 254 | 96 | 71 | 25 | 0 | 158 | 138 |
| Other transportation | 56 | 28 | 27 | 0 | 1 | 28 | 2,898 | 2,503 | 1,208 | 1,203 | 0 | 5 | 1,295 | 972 |
| Communication | 68 | 30 | 28 | 0 | 2 | 38 | 3,436 | 3,002 | 1,360 | 1,288 | 0 | 72 | 1,642 | 1,013 |
| Electric, gas, and sanitary services | 113 | 51 | 51 | 0 | 0 | 62 | 10,480 | 9,248 | 3,682 | 2,957 | 0 | 725 | 5,566 | 1,065 |
| Transportation, communication, and other utilities | 680 | 330 | 308 | 7 | 15 | 350 | 41,396 | 35,561 | 16,922 | 14,795 | 363 | 1,764 | 18,639 | 13,967 |
| Hotels, rooming houses, camps, and other lodging places | 62 | 31 | 30 | 0 | 1 | 31 | 3,735 | 3,174 | 1,315 | 1,163 | 0 | 152 | 1,859 | 1,192 |
| Personal services | 40 | 19 | 18 | 0 | 1 | 21 | 1,404 | 1,293 | 733 | 714 | 0 | 19 | 560 | 784 |
| Automotive repair, services, and garages | 72 | 35 | 35 | 0 | 0 | 37 | 1,674 | 1,507 | 679 | 666 | 13 | 0 | 828 | 526 |
| Motion pictures | 7 | 6 | 5 | 0 | 1 | 1 | 135 | 120 | 70 | 54 | 0 | 16 | 50 | 112 |
| Amusement and recreation services (except motion pictures) | 31 | 16 | 14 | 1 | 1 | 15 | 1,472 | 1,188 | 680 | 586 | 15 | 79 | 508 | 971 |
| Health services | 324 | 189 | 160 | 7 | 22 | 135 | 31,295 | 26,241 | 14,056 | 11,883 | 613 | 1,560 | 12,185 | 16,525 |
| Educational services | 38 | 20 | 8 | 2 | 10 | 18 | 1,815 | 1,642 | 798 | 564 | 34 | 200 | 844 | 712 |
| Membership organizations | 29 | 14 | 10 | 0 | 4 | 15 | 1,249 | 1,072 | 577 | 510 | 0 | 67 | 495 | 638 |
| Business services | 226 | 132 | 91 | 21 | 20 | 94 | 14,445 | 11,269 | 7,202 | 5,098 | 720 | 1,384 | 4,067 | 8,985 |
| Miscellaneous repair services | 14 | 4 | 4 | 0 | 0 | 10 | 371 | 328 | 219 | 217 | 0 | 2 | 109 | 182 |
| Museums, art galleries, botanical and zoological gardens | 1 | 1 | 1 | 0 | 0 | 0 | 20 | 18 | 18 | 18 | 0 | 0 | 0 | 20 |
| Legal services | 7 | 5 | 4 | 0 | 1 | 2 | 217 | 205 | 162 | 115 | 0 | 47 | 43 | 176 |
| Social services | 76 | 47 | 45 | 0 | 2 | 29 | 3,061 | 2,514 | 1,622 | 1,580 | 8 | 34 | 892 | 1,982 |
| Miscellaneous services | 17 | 8 | 7 | 1 | 0 | 9 | 528 | 487 | 152 | 145 | 7 | 0 | 335 | 65 |
| Services | 944 | 527 | 432 | 32 | 63 | 417 | 61,421 | 51,058 | 28,283 | 23,313 | 1,410 | 3,560 | 22,775 | 32,870 |
| Public administration | 17 | 4 | 4 | 0 | 0 | 13 | 980 | 875 | 423 | 414 | 9 | 0 | 452 | 184 |
| Total, all industrial groups | 3,586 | 1,706 | 1,533 | 64 | 109 | 1,880 | 231,187 | 201,557 | 99,918 | 87,805 | 3,239 | 8,874 | 101,639 | 97,166 |
- 1 Source: Standard Industrial Classification, Statistical Policy Division, Office of Management and Budget, Washington, D.C., 1972.
671 of 693 figures sit in a row or column sum that works out. 3 cells break a sum: 'Textile mill products', column 10: prints 662, columns 11 to 13 add to 702; 'Manufacturing', column 11: prints 34,769, rows 'Food and kindred pro' to 'Miscellaneous manufa' add to 34,809; 'Manufacturing', column 15: prints 34,246, rows 'Food and kindred pro' to 'Miscellaneous manufa' add to 34,266.
Reader’s notes
p. 168. 15 columns: stub plus 14 numeric columns. The stub heading carries a raised 1 ("Industrial group^1"), but no footnote text is printed within this crop, so `footnotes` is empty; the note for marker 1 presumably appears at the foot of the full table. The crop ends at the "Manufacturing" subtotal row (closed by a rule), so the table continues on a following page with the nonmanufacturing industry groups and the grand total; only the manufacturing panel is on this image. Two apparent misprints in the source, transcribed exactly as printed: 1. "Textile mill products", column "Valid votes cast for unions / AFL-CIO unions" reads 702, which exceeds that row's union total of 662 and is inconsistent with the row's own breakdown (702 + 0 + 0 should equal the 662 printed under "Valid votes cast for unions / Total"). The 662 figure is the consistent one: 662 + 736 (no union) = 1,398, the printed total valid votes cast, and the column of union totals sums exactly to the printed 37,364. Summing the printed AFL-CIO column gives 34,809 against the printed 34,769; the 40 gap is exactly 702 - 662, so 702 is most likely a typesetting error for 662. The digits were checked twice on the image and read 702 both times. 2. The last column, "Eligible employees in units choosing representation", sums over the 21 industry rows to 34,266, while the "Manufacturing" row prints 34,246, a difference of 20. I could not identify which cell is at fault; every other column checks out exactly against the Manufacturing subtotal, and all per-row internal checks pass (won + no representative = total elections; union subcategories = union total; union votes + no-union votes = total valid votes cast). Heading text was rejoined across the printed line breaks and end-of-line hyphens (e.g. "Num-/ber of elec-/tions in which no rep-/resenta-/tive was chosen" and "Eligible em-/ployees in units choos-/ing rep-/resenta-/tion"). "AFL-CIO" is printed with an en-dash in the heading and is written here with a plain hyphen. Row labels that wrapped onto two lines (Apparel, Fabricated metal products, Measuring/analyzing instruments) were joined and their broken words repaired ("mate-/rials", "equip-/ment)").
p. 169. The crop is a "—Continued" page of Table 16 and is cut off at the bottom: the last transcribed row, "Museums, art galleries, botanical and zoological gardens", sits on the bottom edge of the image (its values are fully legible, but the horizontal rule below it and any further rows, the services subtotal, and the footnote text are not on this crop). The stub heading carries a superscript 1 marker ("Industrial group^1"), but footnote 1 itself is not printed within the crop, so `footnotes` is empty. Fifteen columns, confirmed from the column rules: stub; Total elections; four columns under "Number of elections in which representation rights were won by unions" (Total / AFL-CIO unions / Other national unions / Other local unions); Number of elections in which no representative was chosen; Number of employees eligible to vote; Total valid votes cast; four columns under "Valid votes cast for unions" (same four sub-heads); Total votes for no union; Eligible employees in units choosing representation. In the "Transportation, communication, and other utilities" subtotal row there is a stray ink tick/apostrophe-like mark printed just left of 18,639 in the "Total votes for no union" column. It is a printing artifact, not a digit or footnote marker (18,639 is exactly the sum of the six member rows above it), so it has been dropped from the cell. Row indentation distinguishes two levels: "Mining" and "Transportation, communication, and other utilities" are division subtotal lines, while "Construction", "Wholesale trade", "Retail trade", "Finance, insurance, and real estate" and "U.S. Postal Service" are printed at that same subtotal indent (each is a one-group division with no separate subtotal line). Indentation is not encoded in the cells; labels are given as printed. No scanning ambiguity in any numeral: every row's union breakdown sums to its union total, won + no-representative sums to total elections, union votes + no-union votes sums to total valid votes, and both subtotal lines reconcile exactly against their member rows in all fourteen numeric columns. Nothing was computed or corrected; all values are as printed.
p. 170. The crop is a continuation page of Table 16, so the body starts in the middle of the industry list (the first printed row is "Legal services"); the preceding industrial groups are on earlier pages. Column headings are printed on this page and are transcribed in full. Grid is 15 columns: stub, "Total elections", four columns under "Number of elections in which representation rights were won by unions" (Total / AFL-CIO unions / Other national unions / Other local unions), "Number of elections in which no representative was chosen", "Number of employees eligible to vote", "Total valid votes cast", four columns under "Valid votes cast for unions" (Total / AFL-CIO unions / Other national unions / Other local unions), "Total votes for no union", and "Eligible employees in units choosing representation". "Services", "Public administration" and "Total, all industrial groups" are set off by rules and are indented subtotal/total lines; their indentation is not reproduced in the labels. Internal checks all agree with the printed figures (component union columns sum to each "Total", won + no-representative elections sum to "Total elections", and union votes + no-union votes sum to "Total valid votes cast"), so no misprints are suspected. The scan renders dotted "i" as a dotless glyph and some punctuation faintly; in the footnote the mark after "Source" and the points in "D.C." are faint, and I have transcribed them as the conventional colon and periods used in this series. The footnote marker on "Industrial group" is a raised 1.
Source image
Source data: U.S. NLRB Annual Reports (public domain). Reconstruction by NLRB Stats Archive. Read by claude-opus-5 (effort max, prompt extract_v1) from the 300-dpi scan; stitched by page. Updated October 2026.