NLRB Stats Archive › Annual Reports › FY1993 › Standard Federal Administrative Regional Distribution of Cases Received, Fiscal Year 1993
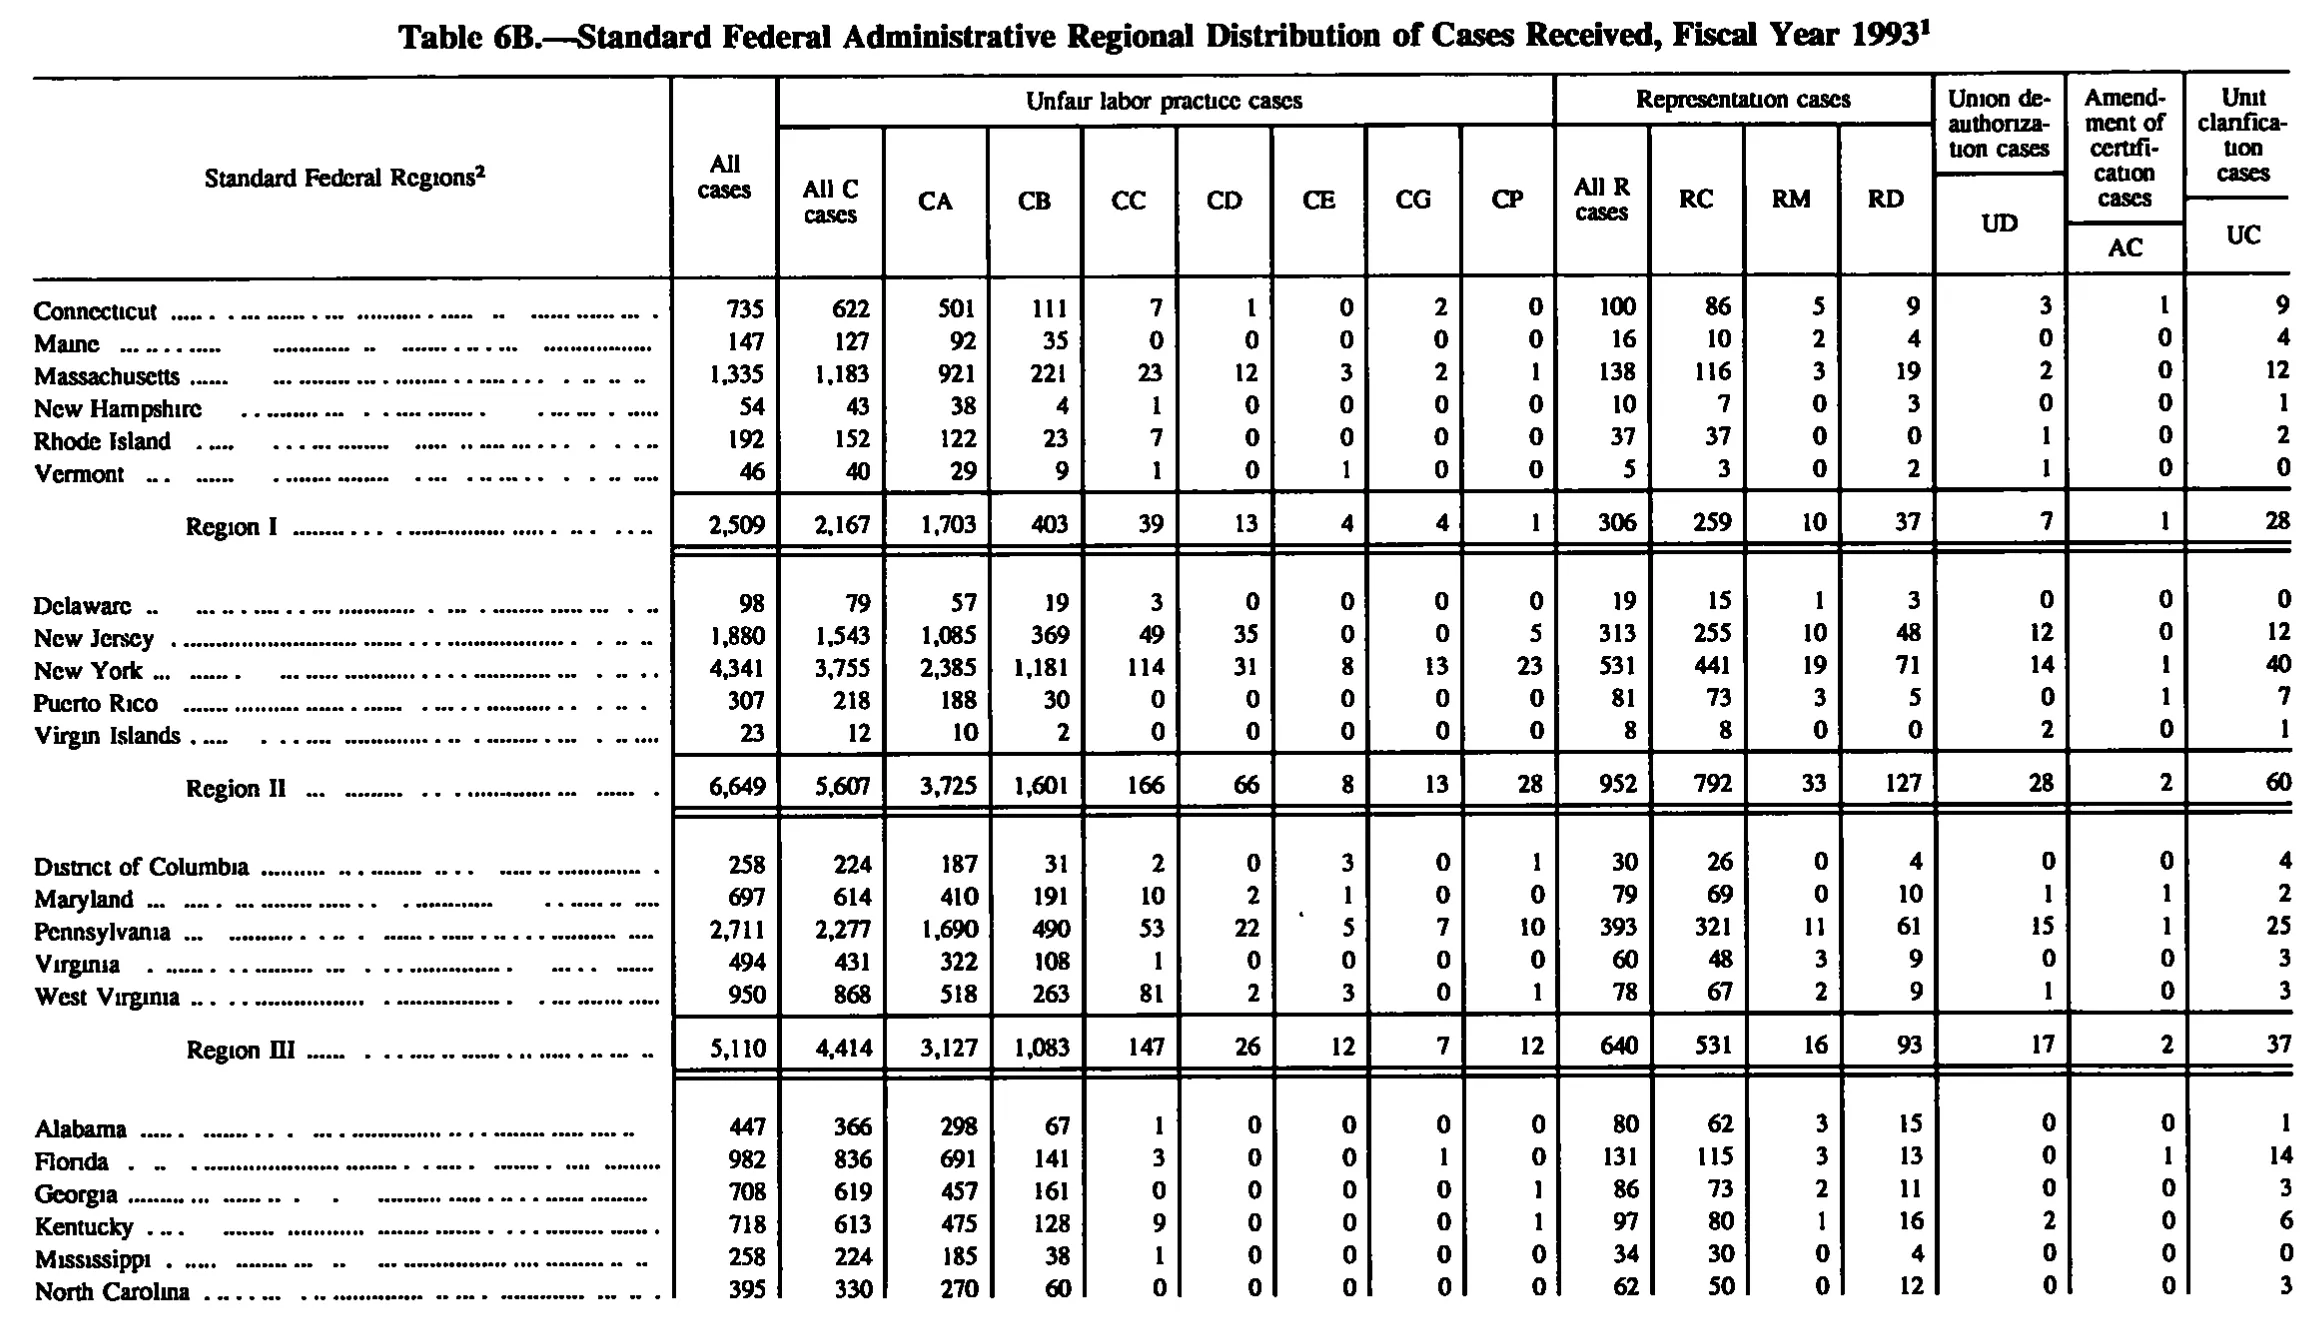
Standard Federal Administrative Regional Distribution of Cases Received, Fiscal Year 1993
Stitched from pp. 136–138.
| Standard Federal Regions | All cases | Unfair labor practice cases | Representation cases | Union deauthorization cases | Amendment of certification cases | Unit clarification cases | ||||||||||
|---|---|---|---|---|---|---|---|---|---|---|---|---|---|---|---|---|
| Standard Federal Regions | All cases | All C cases | CA | CB | CC | CD | CE | CG | CP | All R cases | RC | RM | RD | UD | AC | UC |
| Connecticut | 735 | 622 | 501 | 111 | 7 | 1 | 0 | 2 | 0 | 100 | 86 | 5 | 9 | 3 | 1 | 9 |
| Maine | 147 | 127 | 92 | 35 | 0 | 0 | 0 | 0 | 0 | 16 | 10 | 2 | 4 | 0 | 0 | 4 |
| Massachusetts | 1,335 | 1,183 | 921 | 221 | 23 | 12 | 3 | 2 | 1 | 138 | 116 | 3 | 19 | 2 | 0 | 12 |
| New Hampshire | 54 | 43 | 38 | 4 | 1 | 0 | 0 | 0 | 0 | 10 | 7 | 0 | 3 | 0 | 0 | 1 |
| Rhode Island | 192 | 152 | 122 | 23 | 7 | 0 | 0 | 0 | 0 | 37 | 37 | 0 | 0 | 1 | 0 | 2 |
| Vermont | 46 | 40 | 29 | 9 | 1 | 0 | 1 | 0 | 0 | 5 | 3 | 0 | 2 | 1 | 0 | 0 |
| Region I | 2,509 | 2,167 | 1,703 | 403 | 39 | 13 | 4 | 4 | 1 | 306 | 259 | 10 | 37 | 7 | 1 | 28 |
| Delaware | 98 | 79 | 57 | 19 | 3 | 0 | 0 | 0 | 0 | 19 | 15 | 1 | 3 | 0 | 0 | 0 |
| New Jersey | 1,880 | 1,543 | 1,085 | 369 | 49 | 35 | 0 | 0 | 5 | 313 | 255 | 10 | 48 | 12 | 0 | 12 |
| New York | 4,341 | 3,755 | 2,385 | 1,181 | 114 | 31 | 8 | 13 | 23 | 531 | 441 | 19 | 71 | 14 | 1 | 40 |
| Puerto Rico | 307 | 218 | 188 | 30 | 0 | 0 | 0 | 0 | 0 | 81 | 73 | 3 | 5 | 0 | 1 | 7 |
| Virgin Islands | 23 | 12 | 10 | 2 | 0 | 0 | 0 | 0 | 0 | 8 | 8 | 0 | 0 | 2 | 0 | 1 |
| Region II | 6,649 | 5,607 | 3,725 | 1,601 | 166 | 66 | 8 | 13 | 28 | 952 | 792 | 33 | 127 | 28 | 2 | 60 |
| District of Columbia | 258 | 224 | 187 | 31 | 2 | 0 | 3 | 0 | 1 | 30 | 26 | 0 | 4 | 0 | 0 | 4 |
| Maryland | 697 | 614 | 410 | 191 | 10 | 2 | 1 | 0 | 0 | 79 | 69 | 0 | 10 | 1 | 1 | 2 |
| Pennsylvania | 2,711 | 2,277 | 1,690 | 490 | 53 | 22 | 5 | 7 | 10 | 393 | 321 | 11 | 61 | 15 | 1 | 25 |
| Virginia | 494 | 431 | 322 | 108 | 1 | 0 | 0 | 0 | 0 | 60 | 48 | 3 | 9 | 0 | 0 | 3 |
| West Virginia | 950 | 868 | 518 | 263 | 81 | 2 | 3 | 0 | 1 | 78 | 67 | 2 | 9 | 1 | 0 | 3 |
| Region III | 5,110 | 4,414 | 3,127 | 1,083 | 147 | 26 | 12 | 7 | 12 | 640 | 531 | 16 | 93 | 17 | 2 | 37 |
| Alabama | 447 | 366 | 298 | 67 | 1 | 0 | 0 | 0 | 0 | 80 | 62 | 3 | 15 | 0 | 0 | 1 |
| Florida | 982 | 836 | 691 | 141 | 3 | 0 | 0 | 1 | 0 | 131 | 115 | 3 | 13 | 0 | 1 | 14 |
| Georgia | 708 | 619 | 457 | 161 | 0 | 0 | 0 | 0 | 1 | 86 | 73 | 2 | 11 | 0 | 0 | 3 |
| Kentucky | 718 | 613 | 475 | 128 | 9 | 0 | 0 | 0 | 1 | 97 | 80 | 1 | 16 | 2 | 0 | 6 |
| Mississippi | 258 | 224 | 185 | 38 | 1 | 0 | 0 | 0 | 0 | 34 | 30 | 0 | 4 | 0 | 0 | 0 |
| North Carolina | 395 | 330 | 270 | 60 | 0 | 0 | 0 | 0 | 0 | 62 | 50 | 0 | 12 | 0 | 0 | 3 |
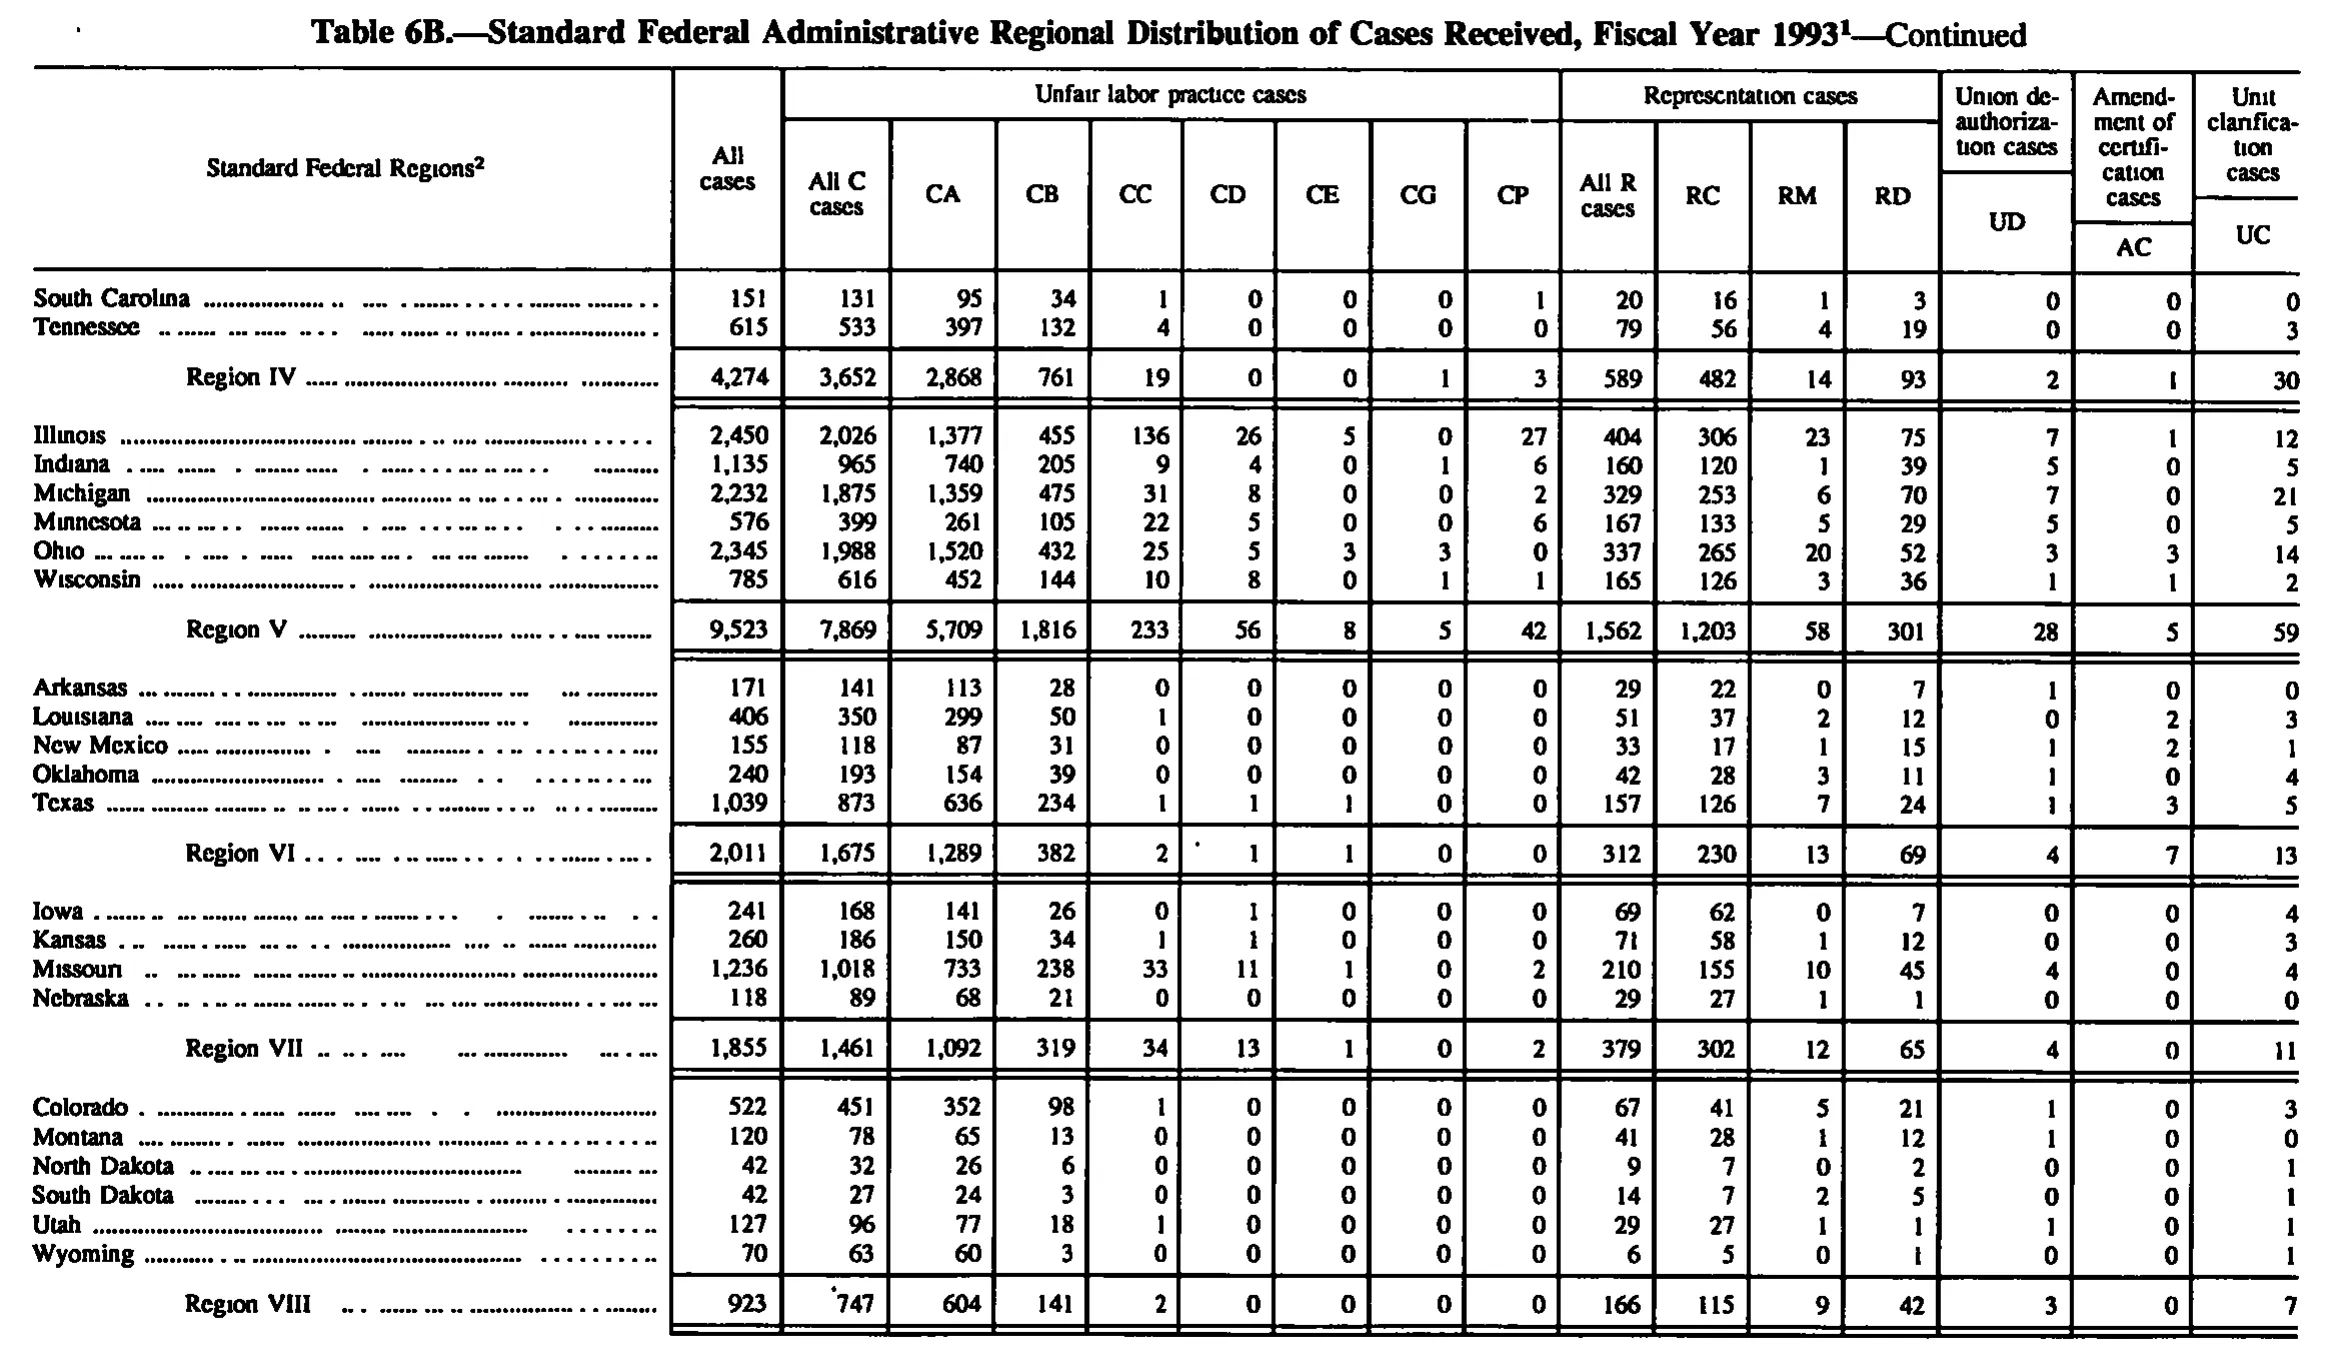
| South Carolina | 151 | 131 | 95 | 34 | 1 | 0 | 0 | 0 | 1 | 20 | 16 | 1 | 3 | 0 | 0 | 0 |
| Tennessee | 615 | 533 | 397 | 132 | 4 | 0 | 0 | 0 | 0 | 79 | 56 | 4 | 19 | 0 | 0 | 3 |
| Region IV | 4,274 | 3,652 | 2,868 | 761 | 19 | 0 | 0 | 1 | 3 | 589 | 482 | 14 | 93 | 2 | 1 | 30 |
| Illinois | 2,450 | 2,026 | 1,377 | 455 | 136 | 26 | 5 | 0 | 27 | 404 | 306 | 23 | 75 | 7 | 1 | 12 |
| Indiana | 1,135 | 965 | 740 | 205 | 9 | 4 | 0 | 1 | 6 | 160 | 120 | 1 | 39 | 5 | 0 | 5 |
| Michigan | 2,232 | 1,875 | 1,359 | 475 | 31 | 8 | 0 | 0 | 2 | 329 | 253 | 6 | 70 | 7 | 0 | 21 |
| Minnesota | 576 | 399 | 261 | 105 | 22 | 5 | 0 | 0 | 6 | 167 | 133 | 5 | 29 | 5 | 0 | 5 |
| Ohio | 2,345 | 1,988 | 1,520 | 432 | 25 | 5 | 3 | 3 | 0 | 337 | 265 | 20 | 52 | 3 | 3 | 14 |
| Wisconsin | 785 | 616 | 452 | 144 | 10 | 8 | 0 | 1 | 1 | 165 | 126 | 3 | 36 | 1 | 1 | 2 |
| Region V | 9,523 | 7,869 | 5,709 | 1,816 | 233 | 56 | 8 | 5 | 42 | 1,562 | 1,203 | 58 | 301 | 28 | 5 | 59 |
| Arkansas | 171 | 141 | 113 | 28 | 0 | 0 | 0 | 0 | 0 | 29 | 22 | 0 | 7 | 1 | 0 | 0 |
| Louisiana | 406 | 350 | 299 | 50 | 1 | 0 | 0 | 0 | 0 | 51 | 37 | 2 | 12 | 0 | 2 | 3 |
| New Mexico | 155 | 118 | 87 | 31 | 0 | 0 | 0 | 0 | 0 | 33 | 17 | 1 | 15 | 1 | 2 | 1 |
| Oklahoma | 240 | 193 | 154 | 39 | 0 | 0 | 0 | 0 | 0 | 42 | 28 | 3 | 11 | 1 | 0 | 4 |
| Texas | 1,039 | 873 | 636 | 234 | 1 | 1 | 1 | 0 | 0 | 157 | 126 | 7 | 24 | 1 | 3 | 5 |
| Region VI | 2,011 | 1,675 | 1,289 | 382 | 2 | 1 | 1 | 0 | 0 | 312 | 230 | 13 | 69 | 4 | 7 | 13 |
| Iowa | 241 | 168 | 141 | 26 | 0 | 1 | 0 | 0 | 0 | 69 | 62 | 0 | 7 | 0 | 0 | 4 |
| Kansas | 260 | 186 | 150 | 34 | 1 | 1 | 0 | 0 | 0 | 71 | 58 | 1 | 12 | 0 | 0 | 3 |
| Missouri | 1,236 | 1,018 | 733 | 238 | 33 | 11 | 1 | 0 | 2 | 210 | 155 | 10 | 45 | 4 | 0 | 4 |
| Nebraska | 118 | 89 | 68 | 21 | 0 | 0 | 0 | 0 | 0 | 29 | 27 | 1 | 1 | 0 | 0 | 0 |
| Region VII | 1,855 | 1,461 | 1,092 | 319 | 34 | 13 | 1 | 0 | 2 | 379 | 302 | 12 | 65 | 4 | 0 | 11 |
| Colorado | 522 | 451 | 352 | 98 | 1 | 0 | 0 | 0 | 0 | 67 | 41 | 5 | 21 | 1 | 0 | 3 |
| Montana | 120 | 78 | 65 | 13 | 0 | 0 | 0 | 0 | 0 | 41 | 28 | 1 | 12 | 1 | 0 | 0 |
| North Dakota | 42 | 32 | 26 | 6 | 0 | 0 | 0 | 0 | 0 | 9 | 7 | 0 | 2 | 0 | 0 | 1 |
| South Dakota | 42 | 27 | 24 | 3 | 0 | 0 | 0 | 0 | 0 | 14 | 7 | 2 | 5 | 0 | 0 | 1 |
| Utah | 127 | 96 | 77 | 18 | 1 | 0 | 0 | 0 | 0 | 29 | 27 | 1 | 1 | 1 | 0 | 1 |
| Wyoming | 70 | 63 | 60 | 3 | 0 | 0 | 0 | 0 | 0 | 6 | 5 | 0 | 1 | 0 | 0 | 1 |
| Region VIII | 923 | 747 | 604 | 141 | 2 | 0 | 0 | 0 | 0 | 166 | 115 | 9 | 42 | 3 | 0 | 7 |
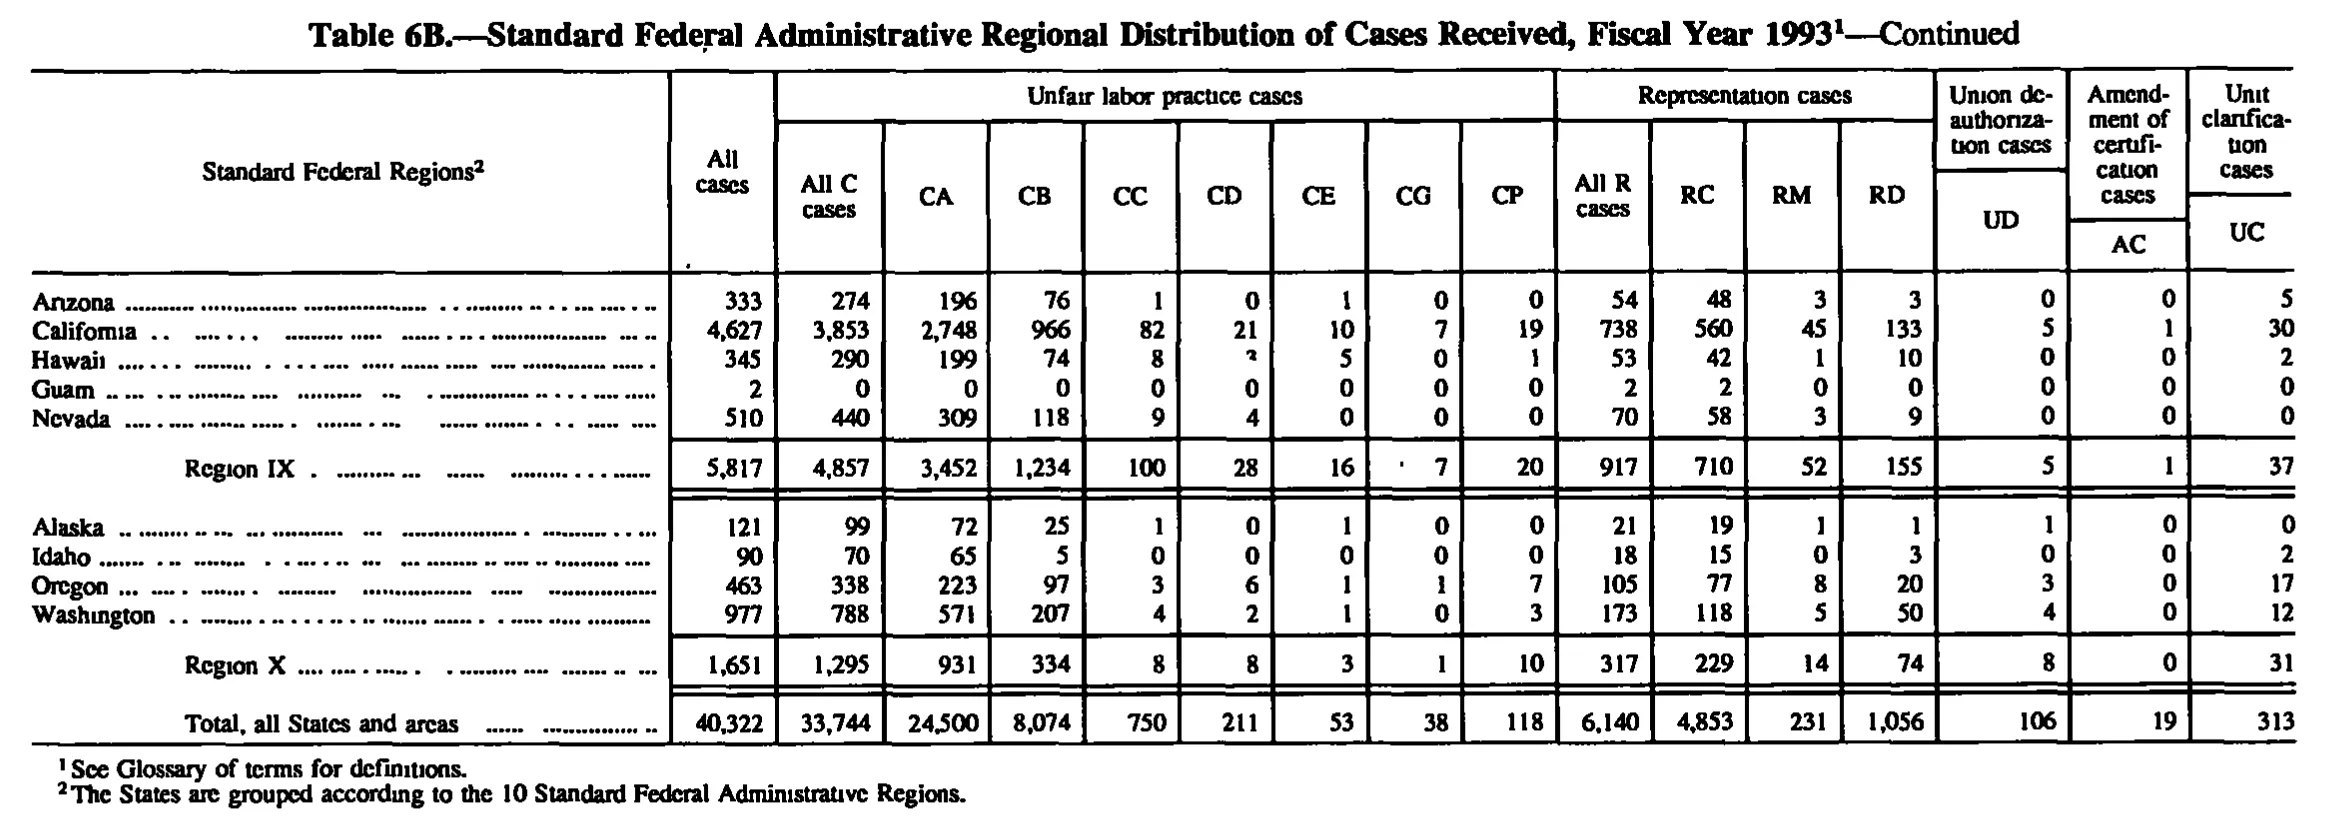
| Arizona | 333 | 274 | 196 | 76 | 1 | 0 | 1 | 0 | 0 | 54 | 48 | 3 | 3 | 0 | 0 | 5 |
| California | 4,627 | 3,853 | 2,748 | 966 | 82 | 21 | 10 | 7 | 19 | 738 | 560 | 45 | 133 | 5 | 1 | 30 |
| Hawaii | 345 | 290 | 199 | 74 | 8 | 3 | 5 | 0 | 1 | 53 | 42 | 1 | 10 | 0 | 0 | 2 |
| Guam | 2 | 0 | 0 | 0 | 0 | 0 | 0 | 0 | 0 | 2 | 2 | 0 | 0 | 0 | 0 | 0 |
| Nevada | 510 | 440 | 309 | 118 | 9 | 4 | 0 | 0 | 0 | 70 | 58 | 3 | 9 | 0 | 0 | 0 |
| Region IX | 5,817 | 4,857 | 3,452 | 1,234 | 100 | 28 | 16 | 7 | 20 | 917 | 710 | 52 | 155 | 5 | 1 | 37 |
| Alaska | 121 | 99 | 72 | 25 | 1 | 0 | 1 | 0 | 0 | 21 | 19 | 1 | 1 | 1 | 0 | 0 |
| Idaho | 90 | 70 | 65 | 5 | 0 | 0 | 0 | 0 | 0 | 18 | 15 | 0 | 3 | 0 | 0 | 2 |
| Oregon | 463 | 338 | 223 | 97 | 3 | 6 | 1 | 1 | 7 | 105 | 77 | 8 | 20 | 3 | 0 | 17 |
| Washington | 977 | 788 | 571 | 207 | 4 | 2 | 1 | 0 | 3 | 173 | 118 | 5 | 50 | 4 | 0 | 12 |
| Region X | 1,651 | 1,295 | 931 | 334 | 8 | 8 | 3 | 1 | 10 | 317 | 229 | 14 | 74 | 8 | 0 | 31 |
| Total, all States and areas | 40,322 | 33,744 | 24,500 | 8,074 | 750 | 211 | 53 | 38 | 118 | 6,140 | 4,853 | 231 | 1,056 | 106 | 19 | 313 |
- 1 See Glossary of terms for definitions.
- 2 The States are grouped according to the 10 Standard Federal Administrative Regions.
768 of 768 figures sit in a row or column sum that works out.
Reader’s notes
p. 136. The crop cuts the table off at the bottom: the fourth region block (Alabama through North Carolina shown) is incomplete — its remaining states and the "Region IV" subtotal line continue on the next image, as do all subsequent regions and the US total. No footnote texts appear on this crop, although footnote markers are printed (a raised 1 on the caption, which is excluded, and a raised 2 on the stub heading "Standard Federal Regions"); the footnote block must be below the crop or on a later page. Column structure: 17 columns — stub, "All cases", eight under the "Unfair labor practice cases" spanner (All C cases, CA, CB, CC, CD, CE, CG, CP), four under "Representation cases" (All R cases, RC, RM, RD), then the three single-column spanners UD, AC and UC. In the printed header "UD", "AC" and "UC" sit on a lower line inside their own spanner boxes; they are transcribed as the second heading level. Arithmetic check: every state row sums across (All C + All R + UD + AC + UC = All cases) and each C and R breakdown sums to its "All C"/"All R" figure; the three subtotal rows (Regions I, II, III) also equal the column sums of their states. No misprints detected. Minor image artifact: a small ink speck sits in the CD column just above the Pennsylvania figure (between the Maryland and Pennsylvania lines); it is not a digit and has been ignored. Row labels are followed by leader dots of varying length, dropped as instructed.
p. 137. This is a continuation page of Table 6B, so no footnote texts are printed on the crop even though footnote markers appear (the caption carries a raised 1, and the stub heading "Standard Federal Regions" carries a raised 2). The crop also begins mid-region: the "Region IV" total row is preceded on this page only by South Carolina and Tennessee, the remaining Region IV states being on the previous page; the table continues past "Region VIII" below the crop. The column structure is 17 columns: stub, "All cases", then eight unfair-labor-practice columns (All C cases, CA, CB, CC, CD, CE, CG, CP), four representation columns (All R cases, RC, RM, RD), and the single columns UD, AC and UC. The headings "Union deauthorization cases", "Amendment of certification cases" and "Unit clarification cases" each sit above their single abbreviation (UD, AC, UC) and are given in the top header level with the abbreviation in the second. Two stray ink specks on the scan are not transcribed as characters: a small dot above and left of the "1" in the CD column of the "Region VI" row, and a small apostrophe-like mark immediately before "747" in the All C cases column of the "Region VIII" row. Arithmetic checks all pass: for every row, All cases = All C + All R + UD + AC + UC, All C = CA+CB+CC+CD+CE+CG+CP, and All R = RC+RM+RD; and every Region total equals the sum of its listed states (Regions V, VI, VII, VIII; Region IV's states are partly on the preceding page). No misprints detected.
p. 138. This crop is a continuation page (the caption carries "—Continued"); it shows only Regions IX and X plus the grand-total line, so Regions I–VIII are on the preceding page(s). The column headings are printed on this page, so they are given. Doubtful cell: Hawaii, column CD. The glyph is printed small and raised/broken in the scan and could be read as 2 or 3; I transcribed it as 3. It is a data value (it sits inside the CD column rules), not a footnote marker. The printed Region IX subtotal for CD is 28 and the other four CD entries in that block sum to 25, which is consistent with 3, but I did not derive the digit from that — it is offered only as a check on an ambiguous glyph. Region IX row, column CG: a small stray ink speck/leader dot precedes the value 7; transcribed as 7 only. The scan's broken serifs make several stub labels look misspelled ("Anzona", "Califomia", "Oregon"/"Orcgon", "Washmgton"); these are dotless-i / damaged-glyph artifacts and the labels are transcribed with their correct printed spellings (Arizona, California, Oregon, Washington). All printed subtotals and the grand total were legible; no internal arithmetic inconsistencies were observed in the two region blocks shown, and nothing was computed or corrected.
Source image
Source data: U.S. NLRB Annual Reports (public domain). Reconstruction by NLRB Stats Archive. Read by claude-opus-5 (effort max, prompt extract_v1) from the 300-dpi scan; stitched by page. Updated October 2026.