NLRB Stats Archive › Annual Reports › FY1992 › Proceedings Decided by Circuit Courts of Appeals on Petitions for Enforcement and/or Review of Board Orders, Fiscal Year 1992, Compared With 5-Year Cumulative Totals, Fiscal Years 1987 Through 1991
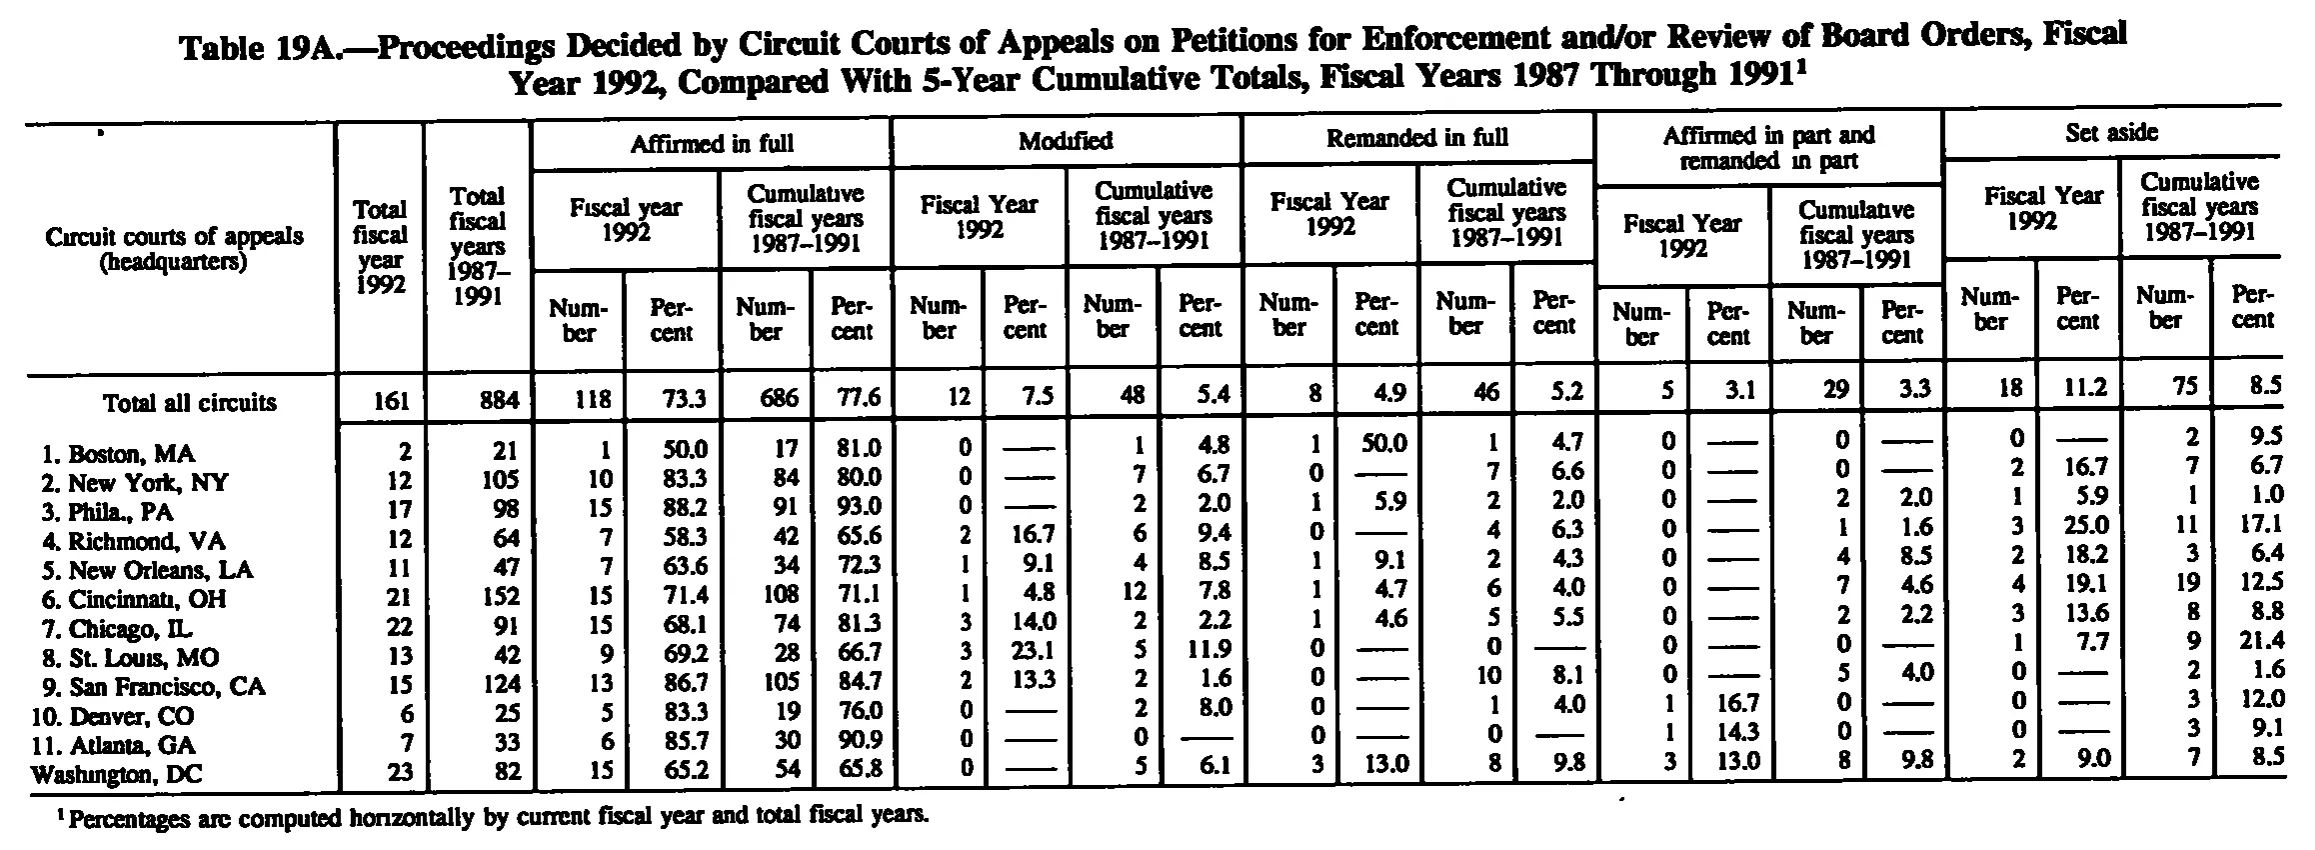
Proceedings Decided by Circuit Courts of Appeals on Petitions for Enforcement and/or Review of Board Orders, Fiscal Year 1992, Compared With 5-Year Cumulative Totals, Fiscal Years 1987 Through 1991
| Circuit courts of appeals (headquarters) | Total fiscal year 1992 | Total fiscal years 1987-1991 | Affirmed in full | Modified | Remanded in full | Affirmed in part and remanded in part | Set aside | |||||||||||||||
|---|---|---|---|---|---|---|---|---|---|---|---|---|---|---|---|---|---|---|---|---|---|---|
| Circuit courts of appeals (headquarters) | Total fiscal year 1992 | Total fiscal years 1987-1991 | Fiscal year 1992 | Cumulative fiscal years 1987-1991 | Fiscal Year 1992 | Cumulative fiscal years 1987-1991 | Fiscal Year 1992 | Cumulative fiscal years 1987-1991 | Fiscal Year 1992 | Cumulative fiscal years 1987-1991 | Fiscal Year 1992 | Cumulative fiscal years 1987-1991 | ||||||||||
| Circuit courts of appeals (headquarters) | Total fiscal year 1992 | Total fiscal years 1987-1991 | Number | Percent | Number | Percent | Number | Percent | Number | Percent | Number | Percent | Number | Percent | Number | Percent | Number | Percent | Number | Percent | Number | Percent |
| Total all circuits | 161 | 884 | 118 | 73.3 | 686 | 77.6 | 12 | 7.5 | 48 | 5.4 | 8 | 4.9 | 46 | 5.2 | 5 | 3.1 | 29 | 3.3 | 18 | 11.2 | 75 | 8.5 |
| 1. Boston, MA | 2 | 21 | 1 | 50.0 | 17 | 81.0 | 0 | 1 | 4.8 | 1 | 50.0 | 1 | 4.7 | 0 | 0 | 0 | 2 | 9.5 | ||||
| 2. New York, NY | 12 | 105 | 10 | 83.3 | 84 | 80.0 | 0 | 7 | 6.7 | 0 | 7 | 6.6 | 0 | 0 | 2 | 16.7 | 7 | 6.7 | ||||
| 3. Phila., PA | 17 | 98 | 15 | 88.2 | 91 | 93.0 | 0 | 2 | 2.0 | 1 | 5.9 | 2 | 2.0 | 0 | 2 | 2.0 | 1 | 5.9 | 1 | 1.0 | ||
| 4. Richmond, VA | 12 | 64 | 7 | 58.3 | 42 | 65.6 | 2 | 16.7 | 6 | 9.4 | 0 | 4 | 6.3 | 0 | 1 | 1.6 | 3 | 25.0 | 11 | 17.1 | ||
| 5. New Orleans, LA | 11 | 47 | 7 | 63.6 | 34 | 72.3 | 1 | 9.1 | 4 | 8.5 | 1 | 9.1 | 2 | 4.3 | 0 | 4 | 8.5 | 2 | 18.2 | 3 | 6.4 | |
| 6. Cincinnati, OH | 21 | 152 | 15 | 71.4 | 108 | 71.1 | 1 | 4.8 | 12 | 7.8 | 1 | 4.7 | 6 | 4.0 | 0 | 7 | 4.6 | 4 | 19.1 | 19 | 12.5 | |
| 7. Chicago, IL | 22 | 91 | 15 | 68.1 | 74 | 81.3 | 3 | 14.0 | 2 | 2.2 | 1 | 4.6 | 5 | 5.5 | 0 | 2 | 2.2 | 3 | 13.6 | 8 | 8.8 | |
| 8. St. Louis, MO | 13 | 42 | 9 | 69.2 | 28 | 66.7 | 3 | 23.1 | 5 | 11.9 | 0 | 0 | 0 | 0 | 1 | 7.7 | 9 | 21.4 | ||||
| 9. San Francisco, CA | 15 | 124 | 13 | 86.7 | 105 | 84.7 | 2 | 13.3 | 2 | 1.6 | 0 | 10 | 8.1 | 0 | 5 | 4.0 | 0 | 2 | 1.6 | |||
| 10. Denver, CO | 6 | 25 | 5 | 83.3 | 19 | 76.0 | 0 | 2 | 8.0 | 0 | 1 | 4.0 | 1 | 16.7 | 0 | 0 | 3 | 12.0 | ||||
| 11. Atlanta, GA | 7 | 33 | 6 | 85.7 | 30 | 90.9 | 0 | 0 | 0 | 0 | 1 | 14.3 | 0 | 0 | 3 | 9.1 | ||||||
| Washington, DC | 23 | 82 | 15 | 65.2 | 54 | 65.8 | 0 | 5 | 6.1 | 3 | 13.0 | 8 | 9.8 | 3 | 13.0 | 8 | 9.8 | 2 | 9.0 | 7 | 8.5 | |
- 1 Percentages are computed horizontally by current fiscal year and total fiscal years.
123 of 123 figures sit in a row or column sum that works out.
Reader’s notes
p. 186. Grid is 23 columns: stub, two "Total" columns, then five spanners (Affirmed in full; Modified; Remanded in full; Affirmed in part and remanded in part; Set aside), each with Fiscal Year 1992 Number/Percent and Cumulative fiscal years 1987-1991 Number/Percent. Every percent cell printed as a dash rule ("——") is transcribed as "". All such cells sit beside a printed count of 0. Arithmetic check: all twelve row sums (the five Number columns against the Total column, for both FY 1992 and the cumulative years) and all ten column sums (against the "Total all circuits" line) reconcile exactly as transcribed, so the counts and their column placement are verified. The last row label is printed flush left as "Washington, DC" with no sequence number, unlike rows 1-11 which are numbered; transcribed as printed. Some printed percentages do not match the printed counts; all are transcribed as printed, not corrected: "Washington, DC" / Set aside, Fiscal Year 1992, Percent reads 9.0 though 2 of 23 is 8.7 (this cell is also the least certain glyph reading on the page; 8.7 cannot be fully ruled out); "3. Phila., PA" / Affirmed in full, Cumulative, Percent reads 93.0 though 91 of 98 is 92.9; "6. Cincinnati, OH" / Set aside, Fiscal Year 1992, Percent reads 19.1 though 4 of 21 is 19.0 (19.0 is a possible alternative reading). The source rounds inconsistently elsewhere too - e.g. "2. New York, NY" prints 6.7 for Modified cumulative and 6.6 for Remanded cumulative, both of which are 7 of 105 - so these are plausibly source quirks rather than scan damage. The caption carries footnote marker 1; the caption itself is omitted per instructions and the footnote text below the table is kept. Header level 2 is printed "Fiscal year 1992" (lowercase y) under "Affirmed in full" but "Fiscal Year 1992" under the other four spanners; kept as printed. Hyphenated headings ("Num-ber", "Per-cent") are rejoined.
Source image
Source data: U.S. NLRB Annual Reports (public domain). Reconstruction by NLRB Stats Archive. Read by claude-opus-5 (effort max, prompt extract_v1) from the 300-dpi scan; stitched by page. Updated October 2026.