NLRB Stats Archive › Annual Reports › FY1992 › Distribution of Unfair Labor Practice Situations Received, by Number of Employees in Establishments, Fiscal Year 1992
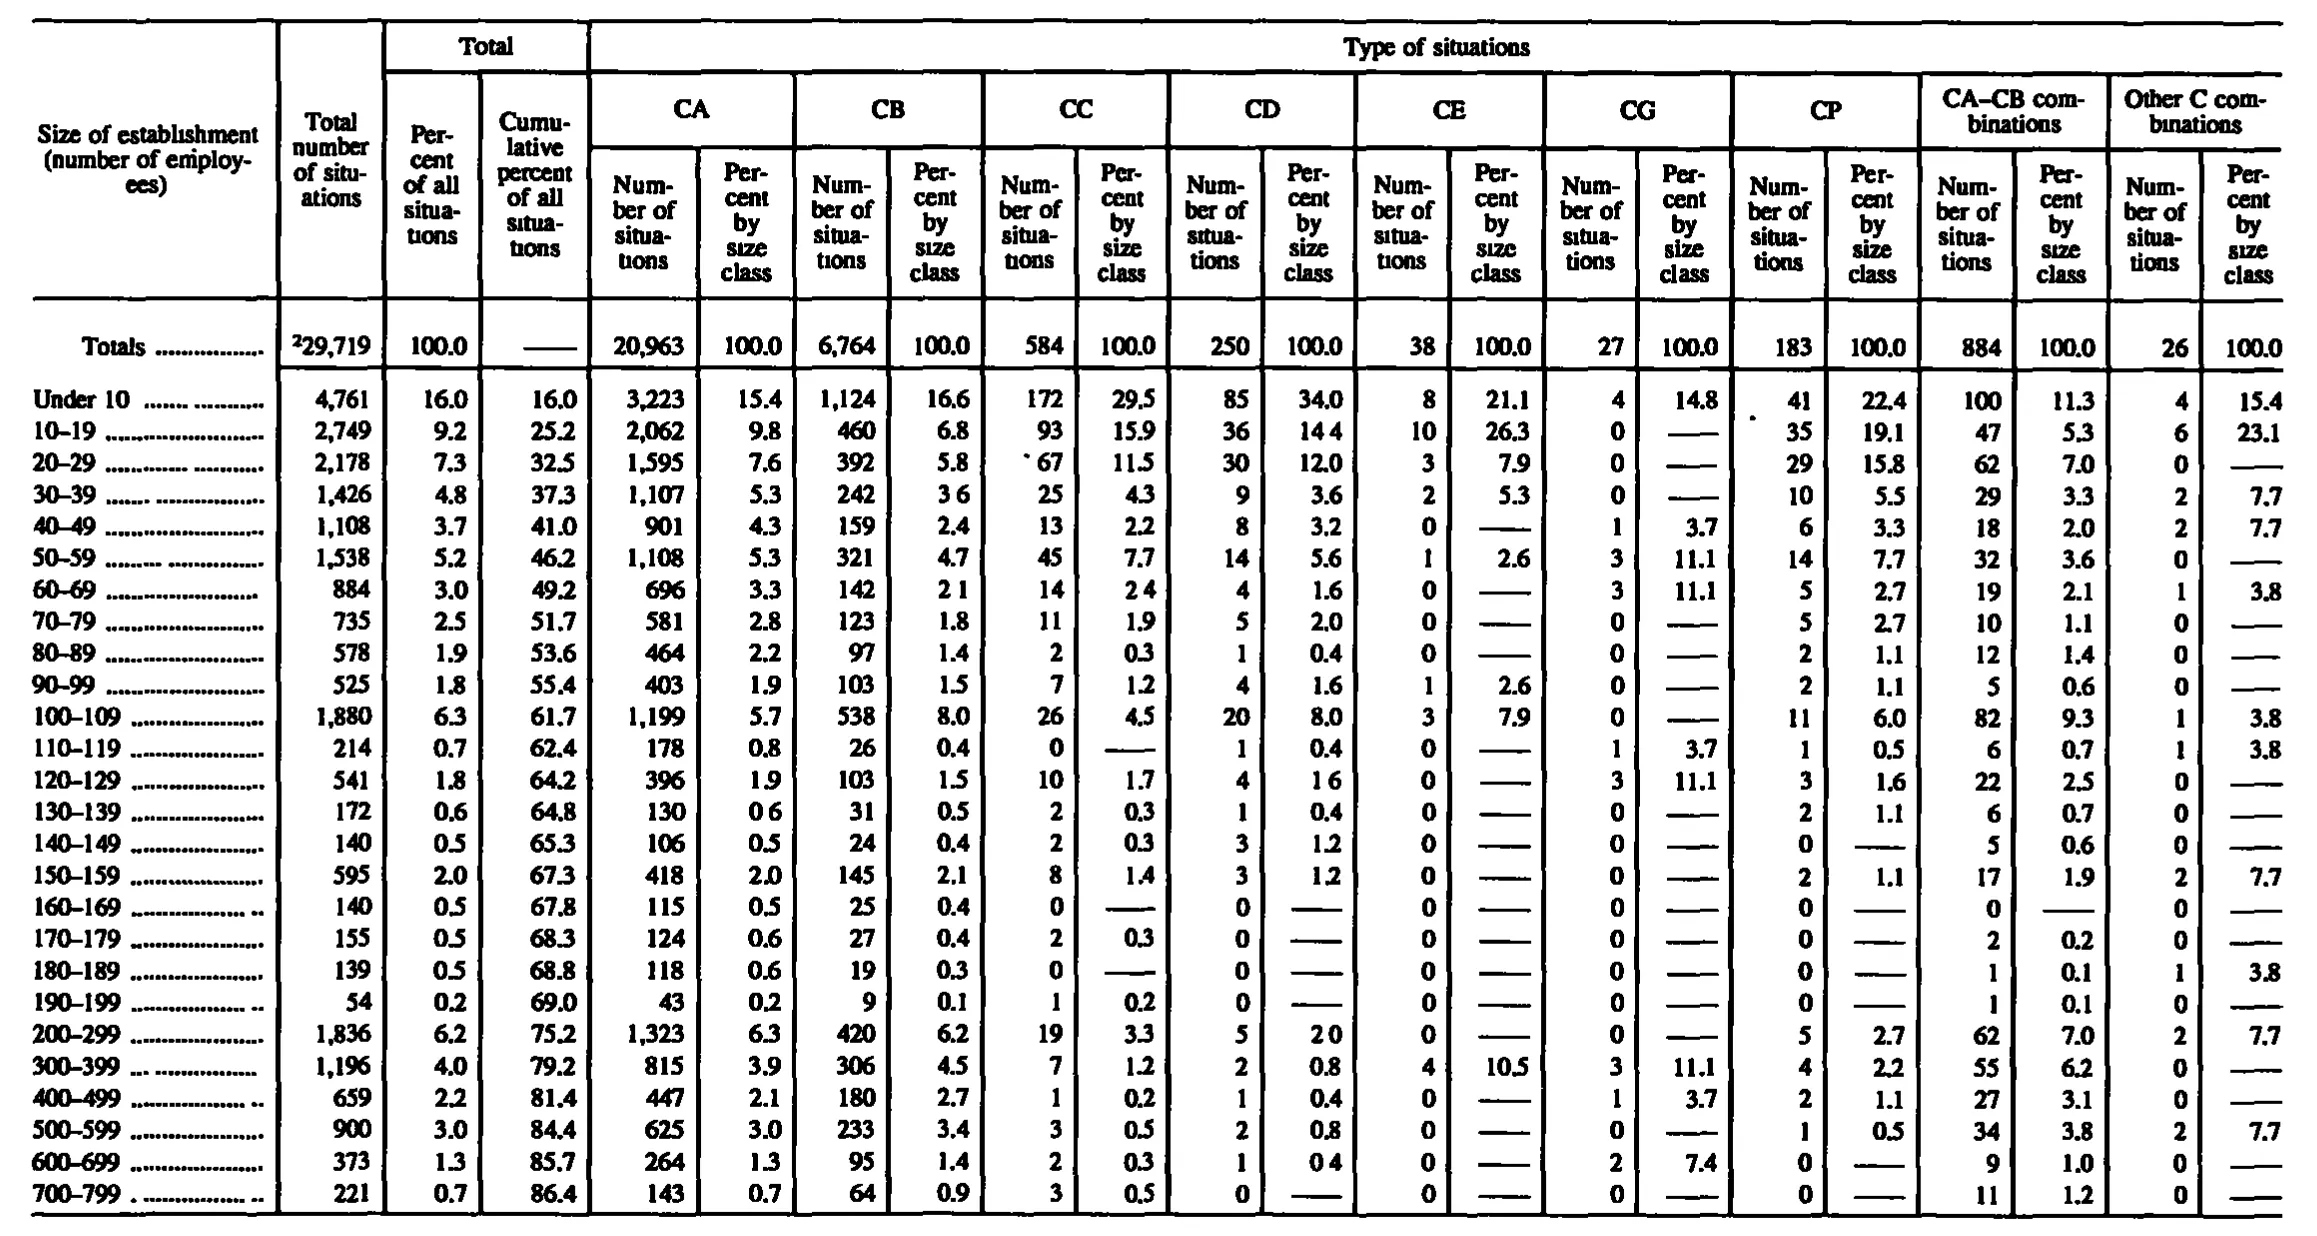
Distribution of Unfair Labor Practice Situations Received, by Number of Employees in Establishments, Fiscal Year 1992
Stitched from pp. 183–184.
| Size of establishment (number of employees) | Total number of situations | Total | Type of situations | ||||||||||||||||||
|---|---|---|---|---|---|---|---|---|---|---|---|---|---|---|---|---|---|---|---|---|---|
| Size of establishment (number of employees) | Total number of situations | Percent of all situations | Cumulative percent of all situations | CA | CB | CC | CD | CE | CG | CP | CA–CB combinations | Other C combinations | |||||||||
| Size of establishment (number of employees) | Total number of situations | Percent of all situations | Cumulative percent of all situations | Number of situations | Percent by size class | Number of situations | Percent by size class | Number of situations | Percent by size class | Number of situations | Percent by size class | Number of situations | Percent by size class | Number of situations | Percent by size class | Number of situations | Percent by size class | Number of situations | Percent by size class | Number of situations | Percent by size class |
| Totals | 29,719 | 100.0 | 20,963 | 100.0 | 6,764 | 100.0 | 584 | 100.0 | 250 | 100.0 | 38 | 100.0 | 27 | 100.0 | 183 | 100.0 | 884 | 100.0 | 26 | 100.0 | |
| Under 10 | 4,761 | 16.0 | 16.0 | 3,223 | 15.4 | 1,124 | 16.6 | 172 | 29.5 | 85 | 34.0 | 8 | 21.1 | 4 | 14.8 | 41 | 22.4 | 100 | 11.3 | 4 | 15.4 |
| 10–19 | 2,749 | 9.2 | 25.2 | 2,062 | 9.8 | 460 | 6.8 | 93 | 15.9 | 36 | 14.4 | 10 | 26.3 | 0 | 35 | 19.1 | 47 | 5.3 | 6 | 23.1 | |
| 20–29 | 2,178 | 7.3 | 32.5 | 1,595 | 7.6 | 392 | 5.8 | 67 | 11.5 | 30 | 12.0 | 3 | 7.9 | 0 | 29 | 15.8 | 62 | 7.0 | 0 | ||
| 30–39 | 1,426 | 4.8 | 37.3 | 1,107 | 5.3 | 242 | 3.6 | 25 | 4.3 | 9 | 3.6 | 2 | 5.3 | 0 | 10 | 5.5 | 29 | 3.3 | 2 | 7.7 | |
| 40–49 | 1,108 | 3.7 | 41.0 | 901 | 4.3 | 159 | 2.4 | 13 | 2.2 | 8 | 3.2 | 0 | 1 | 3.7 | 6 | 3.3 | 18 | 2.0 | 2 | 7.7 | |
| 50–59 | 1,538 | 5.2 | 46.2 | 1,108 | 5.3 | 321 | 4.7 | 45 | 7.7 | 14 | 5.6 | 1 | 2.6 | 3 | 11.1 | 14 | 7.7 | 32 | 3.6 | 0 | |
| 60–69 | 884 | 3.0 | 49.2 | 696 | 3.3 | 142 | 2.1 | 14 | 2.4 | 4 | 1.6 | 0 | 3 | 11.1 | 5 | 2.7 | 19 | 2.1 | 1 | 3.8 | |
| 70–79 | 735 | 2.5 | 51.7 | 581 | 2.8 | 123 | 1.8 | 11 | 1.9 | 5 | 2.0 | 0 | 0 | 5 | 2.7 | 10 | 1.1 | 0 | |||
| 80–89 | 578 | 1.9 | 53.6 | 464 | 2.2 | 97 | 1.4 | 2 | 0.3 | 1 | 0.4 | 0 | 0 | 2 | 1.1 | 12 | 1.4 | 0 | |||
| 90–99 | 525 | 1.8 | 55.4 | 403 | 1.9 | 103 | 1.5 | 7 | 1.2 | 4 | 1.6 | 1 | 2.6 | 0 | 2 | 1.1 | 5 | 0.6 | 0 | ||
| 100–109 | 1,880 | 6.3 | 61.7 | 1,199 | 5.7 | 538 | 8.0 | 26 | 4.5 | 20 | 8.0 | 3 | 7.9 | 0 | 11 | 6.0 | 82 | 9.3 | 1 | 3.8 | |
| 110–119 | 214 | 0.7 | 62.4 | 178 | 0.8 | 26 | 0.4 | 0 | 1 | 0.4 | 0 | 1 | 3.7 | 1 | 0.5 | 6 | 0.7 | 1 | 3.8 | ||
| 120–129 | 541 | 1.8 | 64.2 | 396 | 1.9 | 103 | 1.5 | 10 | 1.7 | 4 | 1.6 | 0 | 3 | 11.1 | 3 | 1.6 | 22 | 2.5 | 0 | ||
| 130–139 | 172 | 0.6 | 64.8 | 130 | 0.6 | 31 | 0.5 | 2 | 0.3 | 1 | 0.4 | 0 | 0 | 2 | 1.1 | 6 | 0.7 | 0 | |||
| 140–149 | 140 | 0.5 | 65.3 | 106 | 0.5 | 24 | 0.4 | 2 | 0.3 | 3 | 1.2 | 0 | 0 | 0 | 5 | 0.6 | 0 | ||||
| 150–159 | 595 | 2.0 | 67.3 | 418 | 2.0 | 145 | 2.1 | 8 | 1.4 | 3 | 1.2 | 0 | 0 | 2 | 1.1 | 17 | 1.9 | 2 | 7.7 | ||
| 160–169 | 140 | 0.5 | 67.8 | 115 | 0.5 | 25 | 0.4 | 0 | 0 | 0 | 0 | 0 | 0 | 0 | |||||||
| 170–179 | 155 | 0.5 | 68.3 | 124 | 0.6 | 27 | 0.4 | 2 | 0.3 | 0 | 0 | 0 | 0 | 2 | 0.2 | 0 | |||||
| 180–189 | 139 | 0.5 | 68.8 | 118 | 0.6 | 19 | 0.3 | 0 | 0 | 0 | 0 | 0 | 1 | 0.1 | 1 | 3.8 | |||||
| 190–199 | 54 | 0.2 | 69.0 | 43 | 0.2 | 9 | 0.1 | 1 | 0.2 | 0 | 0 | 0 | 0 | 1 | 0.1 | 0 | |||||
| 200–299 | 1,836 | 6.2 | 75.2 | 1,323 | 6.3 | 420 | 6.2 | 19 | 3.3 | 5 | 2.0 | 0 | 0 | 5 | 2.7 | 62 | 7.0 | 2 | 7.7 | ||
| 300–399 | 1,196 | 4.0 | 79.2 | 815 | 3.9 | 306 | 4.5 | 7 | 1.2 | 2 | 0.8 | 4 | 10.5 | 3 | 11.1 | 4 | 2.2 | 55 | 6.2 | 0 | |
| 400–499 | 659 | 2.2 | 81.4 | 447 | 2.1 | 180 | 2.7 | 1 | 0.2 | 1 | 0.4 | 0 | 1 | 3.7 | 2 | 1.1 | 27 | 3.1 | 0 | ||
| 500–599 | 900 | 3.0 | 84.4 | 625 | 3.0 | 233 | 3.4 | 3 | 0.5 | 2 | 0.8 | 0 | 0 | 1 | 0.5 | 34 | 3.8 | 2 | 7.7 | ||
| 600–699 | 373 | 1.3 | 85.7 | 264 | 1.3 | 95 | 1.4 | 2 | 0.3 | 1 | 0.4 | 0 | 2 | 7.4 | 0 | 9 | 1.0 | 0 | |||
| 700–799 | 221 | 0.7 | 86.4 | 143 | 0.7 | 64 | 0.9 | 3 | 0.5 | 0 | 0 | 0 | 0 | 11 | 1.2 | 0 | |||||
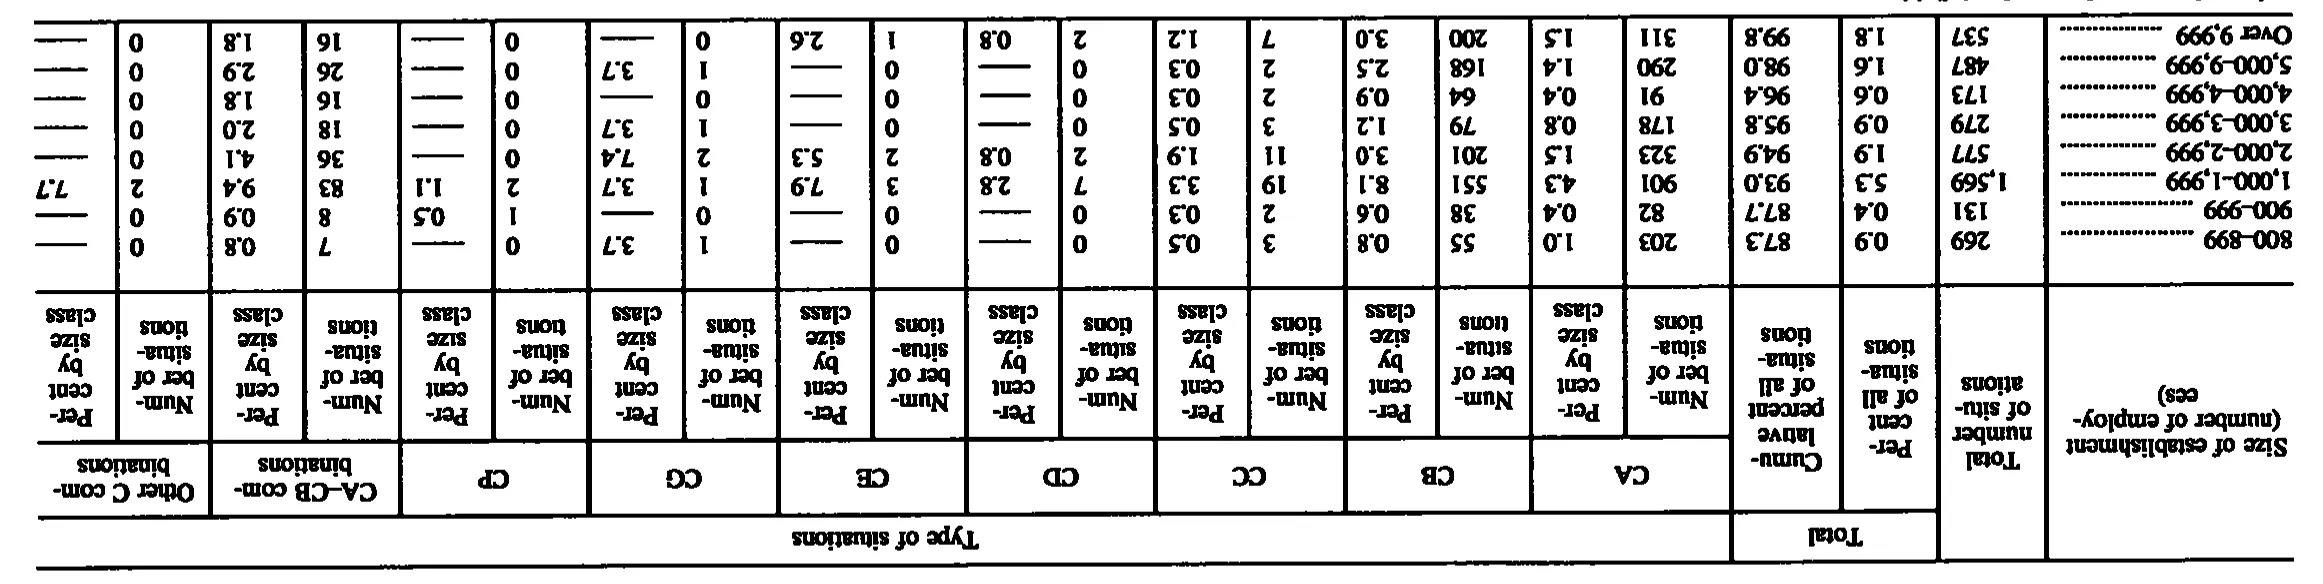
| 800-899 | 269 | 0.9 | 87.3 | 203 | 1.0 | 55 | 0.8 | 3 | 0.5 | 0 | 0 | 1 | 3.7 | 0 | 7 | 0.8 | 0 | ||||
| 900-999 | 131 | 0.4 | 87.7 | 82 | 0.4 | 38 | 0.6 | 2 | 0.3 | 0 | 0 | 0 | 1 | 0.5 | 8 | 0.9 | 0 | ||||
| 1,000-1,999 | 1,569 | 5.3 | 93.0 | 906 | 4.3 | 551 | 8.1 | 19 | 3.3 | 7 | 2.8 | 3 | 7.9 | 1 | 3.7 | 2 | 1.1 | 83 | 9.4 | 2 | 7.7 |
| 2,000-2,999 | 577 | 1.9 | 94.9 | 323 | 1.5 | 201 | 3.0 | 11 | 1.9 | 2 | 0.8 | 2 | 5.3 | 2 | 7.4 | 0 | 36 | 4.1 | 0 | ||
| 3,000-3,999 | 279 | 0.9 | 95.8 | 178 | 0.8 | 79 | 1.2 | 3 | 0.5 | 0 | 0 | 1 | 3.7 | 0 | 18 | 2.0 | 0 | ||||
| 4,000-4,999 | 173 | 0.6 | 96.4 | 91 | 0.4 | 64 | 0.9 | 2 | 0.3 | 0 | 0 | 0 | 0 | 16 | 1.8 | 0 | |||||
| 5,000-9,999 | 487 | 1.6 | 98.0 | 290 | 1.4 | 168 | 2.5 | 2 | 0.3 | 0 | 0 | 1 | 3.7 | 0 | 26 | 2.9 | 0 | ||||
| Over 9,999 | 537 | 1.8 | 99.8 | 311 | 1.5 | 200 | 3.0 | 7 | 1.2 | 2 | 0.8 | 1 | 2.6 | 0 | 0 | 16 | 1.8 | 0 | |||
257 of 258 figures sit in a row or column sum that works out. 2 cells break a sum: '1,000-1,999', column 2: prints 1,569, the subtotals in columns 5 to 21 add to 1,574; 'Totals', column 5: prints 20,963, rows 'Under 10' to 'Over 9,999' add to 20,968.
Reader’s notes
p. 183. Structure: 22 columns — stub, "Total number of situations", a two-column "Total" block (Percent of all situations; Cumulative percent of all situations), then nine two-column pairs under "Type of situations" (CA, CB, CC, CD, CE, CG, CP, CA–CB combinations, Other C combinations), each pair being Number of situations / Percent by size class. "Size of establishment (number of employees)" and "Total number of situations" have no rule above them and run the full height of the header, so they are repeated in all three heading levels; "Percent of all situations" and "Cumulative percent of all situations" are repeated in levels 2 and 3. Crop is cut off at the bottom: the size classes stop at 700–799, so the table continues (further size classes and any footnotes, including the one keyed to the raised 2 on the Totals row) on the following page. No footnote text appears on this image, hence an empty footnotes list. Footnote marker: the Totals row's total is printed with a small raised 2 before the figure ("²29,719"); transcribed as 29,719^2. Dash rules ("——") in the Cumulative percent cell of the Totals row and in many "Percent by size class" cells are transcribed as "". Faint/dropped decimal points in the scan: several percent cells print the point too lightly to resolve as a glyph, appearing as a space. They are unambiguously one-decimal percentages and were transcribed with the point restored — 10–19 CD percent ("14 4" → 14.4), 30–39 CB percent ("3 6" → 3.6), 60–69 CB percent ("2 1" → 2.1), 120–129 CD percent ("1 6" → 1.6), 130–139 CA percent ("0 6" → 0.6), 200–299 CD percent ("2 0" → 2.0), 600–699 CD percent ("0 4" → 0.4). Stray ink specks: a small isolated dot sits left of the "41" in the Under 10 / CP Number of situations cell and left of the "67" in the 20–29 / CC Number of situations cell. Both read as scan speckle, not digits or footnote markers, and were not transcribed. En dashes in the size-class labels and in "CA–CB combinations" are kept as printed.
p. 184. The page is printed upside down in this crop (rotated 180 degrees), not upright; the grid above is the un-rotated reading, so both the row order (smallest size class first) and the column order (stub leftmost) were reversed relative to what the image shows. Continuation page: only the repeated column headings and the last eight size classes are present. The smaller size classes, the table caption and any total line are on the preceding page or outside the crop; the crop ends immediately after the "Over 9,999" row, so no total row and no footnotes are visible. Header structure: in the top heading level "Total" sits over the two percent columns only, while "Total number of situations" and the stub are tall headings running through all three levels; "Percent of all situations" and "Cumulative percent of all situations" are tall headings occupying the lower two levels and are repeated there. Arithmetic check: the nine type-of-situation count columns sum exactly to the printed "Total number of situations" in seven of the eight rows. In the "1,000-1,999" row they sum to 1,574 against a printed total of 1,569 (a difference of 5). Since every other row balances, one digit in that row is suspect - most likely CA number of situations (read as 906), CB number of situations (read as 551), or the printed total (read as 1,569); all three are transcribed exactly as read. The percent columns are consistent with the values as transcribed (e.g. CA 906 at 4.3 percent, CB 551 at 8.1 percent). Dash rules ("------") in the percent-by-size-class cells are transcribed as empty; the adjacent printed zeros are kept as "0". The single "3.7 / 1" pair in the 800-899, 3,000-3,999, 5,000-9,999 and 1,000-1,999 rows was placed in the CG columns (not CE): 1 of about 27 CG situations is 3.7 percent, whereas 1 of about 38 CE situations prints as 2.6 percent, as it does in the "Over 9,999" row.
Source image
Source data: U.S. NLRB Annual Reports (public domain). Reconstruction by NLRB Stats Archive. Read by claude-opus-5 (effort max, prompt extract_v1) from the 300-dpi scan; stitched by page. Updated October 2026.