NLRB Stats Archive › Annual Reports › FY1991 › Proceedings Decided by Circuit Courts of Appeals on Petitions for Enforcement and/or Review of Board Orders, Fiscal Year 1991, Compared With 5-Year Cumulative Totals, Fiscal Years 1986 Through 1990
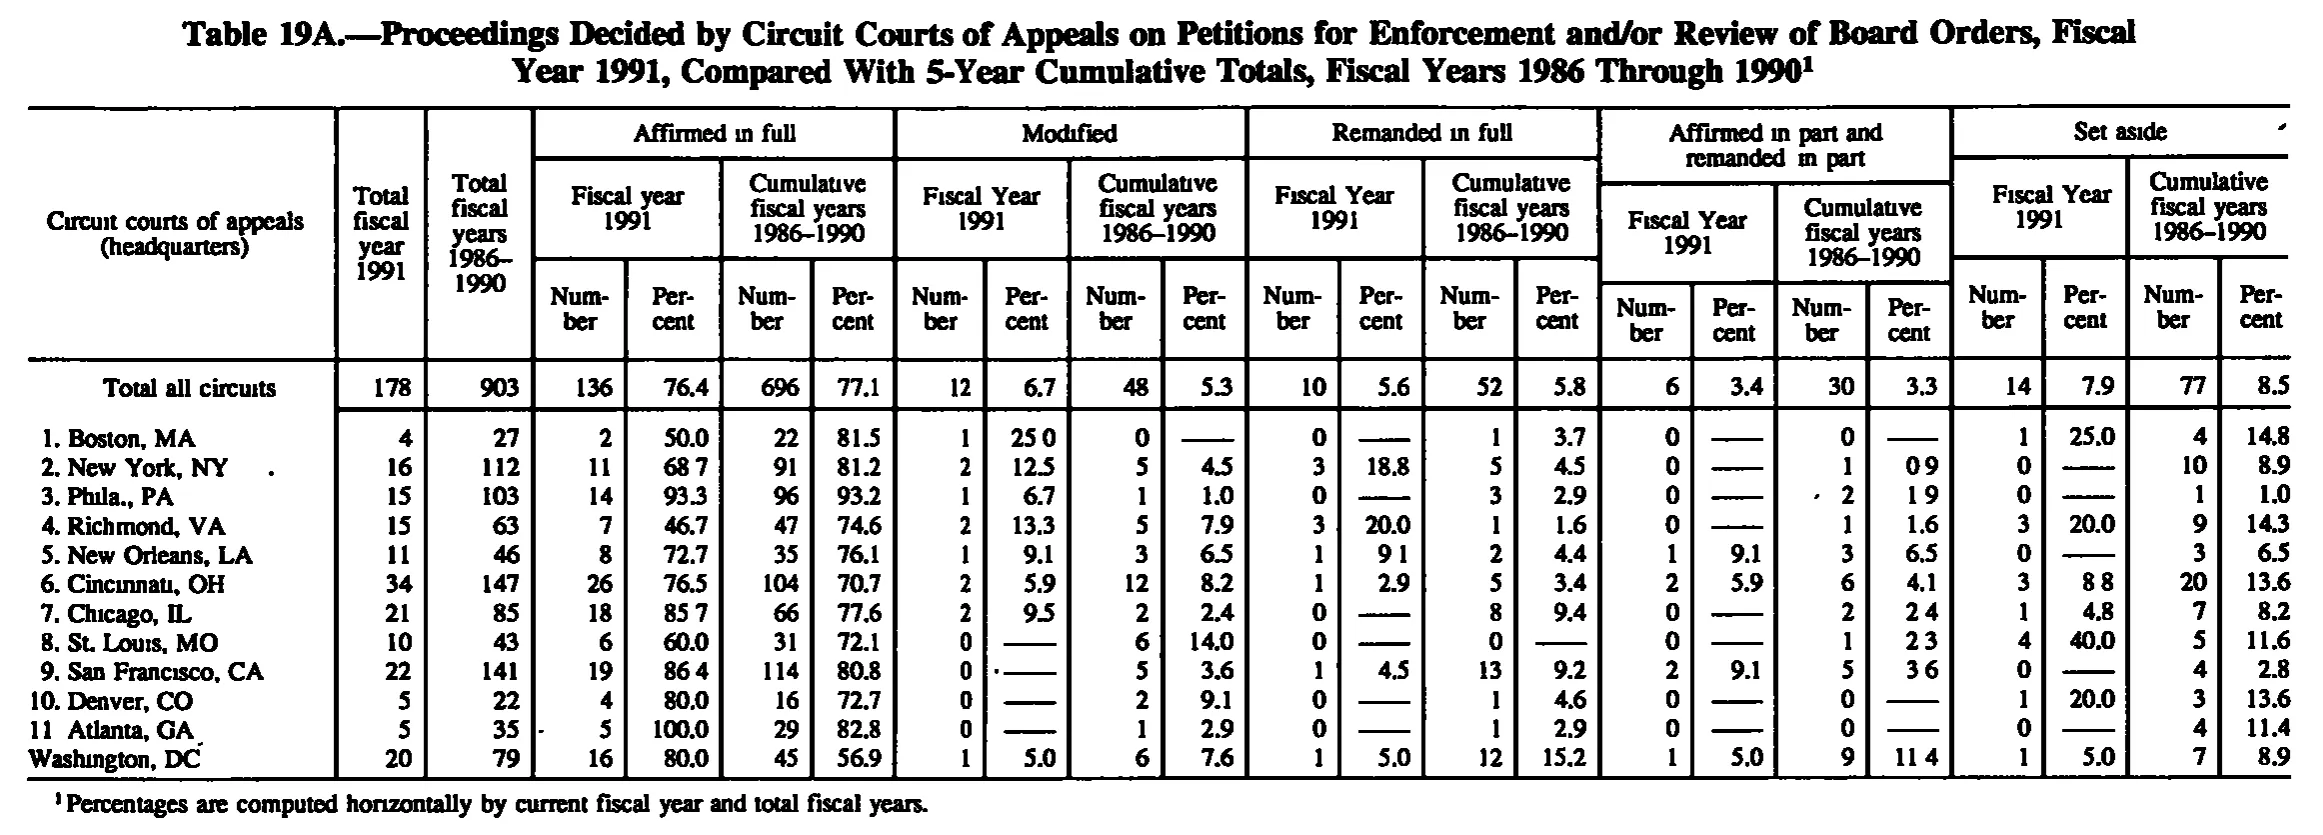
Proceedings Decided by Circuit Courts of Appeals on Petitions for Enforcement and/or Review of Board Orders, Fiscal Year 1991, Compared With 5-Year Cumulative Totals, Fiscal Years 1986 Through 1990
| Circuit courts of appeals (headquarters) | Total fiscal year 1991 | Total fiscal years 1986-1990 | Affirmed in full | Modified | Remanded in full | Affirmed in part and remanded in part | Set aside | |||||||||||||||
|---|---|---|---|---|---|---|---|---|---|---|---|---|---|---|---|---|---|---|---|---|---|---|
| Circuit courts of appeals (headquarters) | Total fiscal year 1991 | Total fiscal years 1986-1990 | Fiscal year 1991 | Cumulative fiscal years 1986-1990 | Fiscal Year 1991 | Cumulative fiscal years 1986-1990 | Fiscal Year 1991 | Cumulative fiscal years 1986-1990 | Fiscal Year 1991 | Cumulative fiscal years 1986-1990 | Fiscal Year 1991 | Cumulative fiscal years 1986-1990 | ||||||||||
| Circuit courts of appeals (headquarters) | Total fiscal year 1991 | Total fiscal years 1986-1990 | Number | Percent | Number | Percent | Number | Percent | Number | Percent | Number | Percent | Number | Percent | Number | Percent | Number | Percent | Number | Percent | Number | Percent |
| Total all circuits | 178 | 903 | 136 | 76.4 | 696 | 77.1 | 12 | 6.7 | 48 | 5.3 | 10 | 5.6 | 52 | 5.8 | 6 | 3.4 | 30 | 3.3 | 14 | 7.9 | 77 | 8.5 |
| 1. Boston, MA | 4 | 27 | 2 | 50.0 | 22 | 81.5 | 1 | 25.0 | 0 | 0 | 1 | 3.7 | 0 | 0 | 1 | 25.0 | 4 | 14.8 | ||||
| 2. New York, NY | 16 | 112 | 11 | 68.7 | 91 | 81.2 | 2 | 12.5 | 5 | 4.5 | 3 | 18.8 | 5 | 4.5 | 0 | 1 | 0.9 | 0 | 10 | 8.9 | ||
| 3. Phila., PA | 15 | 103 | 14 | 93.3 | 96 | 93.2 | 1 | 6.7 | 1 | 1.0 | 0 | 3 | 2.9 | 0 | 2 | 1.9 | 0 | 1 | 1.0 | |||
| 4. Richmond, VA | 15 | 63 | 7 | 46.7 | 47 | 74.6 | 2 | 13.3 | 5 | 7.9 | 3 | 20.0 | 1 | 1.6 | 0 | 1 | 1.6 | 3 | 20.0 | 9 | 14.3 | |
| 5. New Orleans, LA | 11 | 46 | 8 | 72.7 | 35 | 76.1 | 1 | 9.1 | 3 | 6.5 | 1 | 9.1 | 2 | 4.4 | 1 | 9.1 | 3 | 6.5 | 0 | 3 | 6.5 | |
| 6. Cincinnati, OH | 34 | 147 | 26 | 76.5 | 104 | 70.7 | 2 | 5.9 | 12 | 8.2 | 1 | 2.9 | 5 | 3.4 | 2 | 5.9 | 6 | 4.1 | 3 | 8.8 | 20 | 13.6 |
| 7. Chicago, IL | 21 | 85 | 18 | 85.7 | 66 | 77.6 | 2 | 9.5 | 2 | 2.4 | 0 | 8 | 9.4 | 0 | 2 | 2.4 | 1 | 4.8 | 7 | 8.2 | ||
| 8. St. Louis, MO | 10 | 43 | 6 | 60.0 | 31 | 72.1 | 0 | 6 | 14.0 | 0 | 0 | 0 | 1 | 2.3 | 4 | 40.0 | 5 | 11.6 | ||||
| 9. San Francisco, CA | 22 | 141 | 19 | 86.4 | 114 | 80.8 | 0 | 5 | 3.6 | 1 | 4.5 | 13 | 9.2 | 2 | 9.1 | 5 | 3.6 | 0 | 4 | 2.8 | ||
| 10. Denver, CO | 5 | 22 | 4 | 80.0 | 16 | 72.7 | 0 | 2 | 9.1 | 0 | 1 | 4.6 | 0 | 0 | 1 | 20.0 | 3 | 13.6 | ||||
| 11. Atlanta, GA | 5 | 35 | 5 | 100.0 | 29 | 82.8 | 0 | 1 | 2.9 | 0 | 1 | 2.9 | 0 | 0 | 0 | 4 | 11.4 | |||||
| Washington, DC | 20 | 79 | 16 | 80.0 | 45 | 56.9 | 1 | 5.0 | 6 | 7.6 | 1 | 5.0 | 12 | 15.2 | 1 | 5.0 | 9 | 11.4 | 1 | 5.0 | 7 | 8.9 |
- 1 Percentages are computed horizontally by current fiscal year and total fiscal years.
128 of 128 figures sit in a row or column sum that works out.
Reader’s notes
p. 224. Column structure: stub + "Total fiscal year 1991" + "Total fiscal years 1986-1990" + five outcome groups (Affirmed in full; Modified; Remanded in full; Affirmed in part and remanded in part; Set aside), each split into "Fiscal [Y/y]ear 1991" and "Cumulative fiscal years 1986-1990", each with Number and Percent = 23 columns. Decimal points: the scan drops or fades many decimal points in the Percent columns, so they print as e.g. "25 0", "68 7", "85 7", "86 4", "9 1", "8 8", "2 4", "2 3", "3 6", "1 9", "09", "11 4". These are one-decimal percentages in a column of one-decimal percentages, and every one of them is consistent with the printed Number/Total pair, so I transcribed them with the decimal point (25.0, 68.7, 85.7, 86.4, 9.1, 8.8, 2.4, 2.3, 3.6, 1.9, 0.9, 11.4). No digits were changed. Dash rules: a long dash rule ("——") printed in a Percent cell (meaning no percentage, the paired Number being 0) is transcribed as "". Row labels: the last body row is printed flush left as "Washington, DC" with no circuit number, unlike rows 1-11; transcribed as printed. In "11. Atlanta, GA" the period after "11" is faint/possibly absent in the scan; I wrote it with the period to match rows 1-10. A stray ink speck follows "2. New York, NY" and precedes the "2" in the Affirmed-in-part cumulative Number cell of row 3 (Phila., PA) and the dash in the Modified Percent cell of row 9 (San Francisco, CA); these are scan artifacts, not characters. Headings: "Affirmed in full" uses lowercase "Fiscal year 1991" while the other four groups use "Fiscal Year 1991"; transcribed as printed. The year ranges are set with an en dash ("1986–1990"); written with a plain hyphen. A small stray mark sits above the right edge of the "Set aside" spanner rule; it is not a footnote marker. Arithmetic check (not used to alter any cell): all five outcome Numbers sum to the printed row total for every circuit in both periods, the circuit Numbers sum to the "Total all circuits" line in every column, and each printed percent matches its Number/Total ratio — except San Francisco, Affirmed in part and remanded in part, Cumulative Number, where 5/141 = 3.55 and the table prints 3.6.
Source image
Source data: U.S. NLRB Annual Reports (public domain). Reconstruction by NLRB Stats Archive. Read by claude-opus-5 (effort max, prompt extract_v1) from the 300-dpi scan; stitched by page. Updated October 2026.