NLRB Stats Archive › Annual Reports › FY1991 › Distribution of Unfair Labor Practice Situations Received, by Number of Employees in Establishments, Fiscal Year 1991
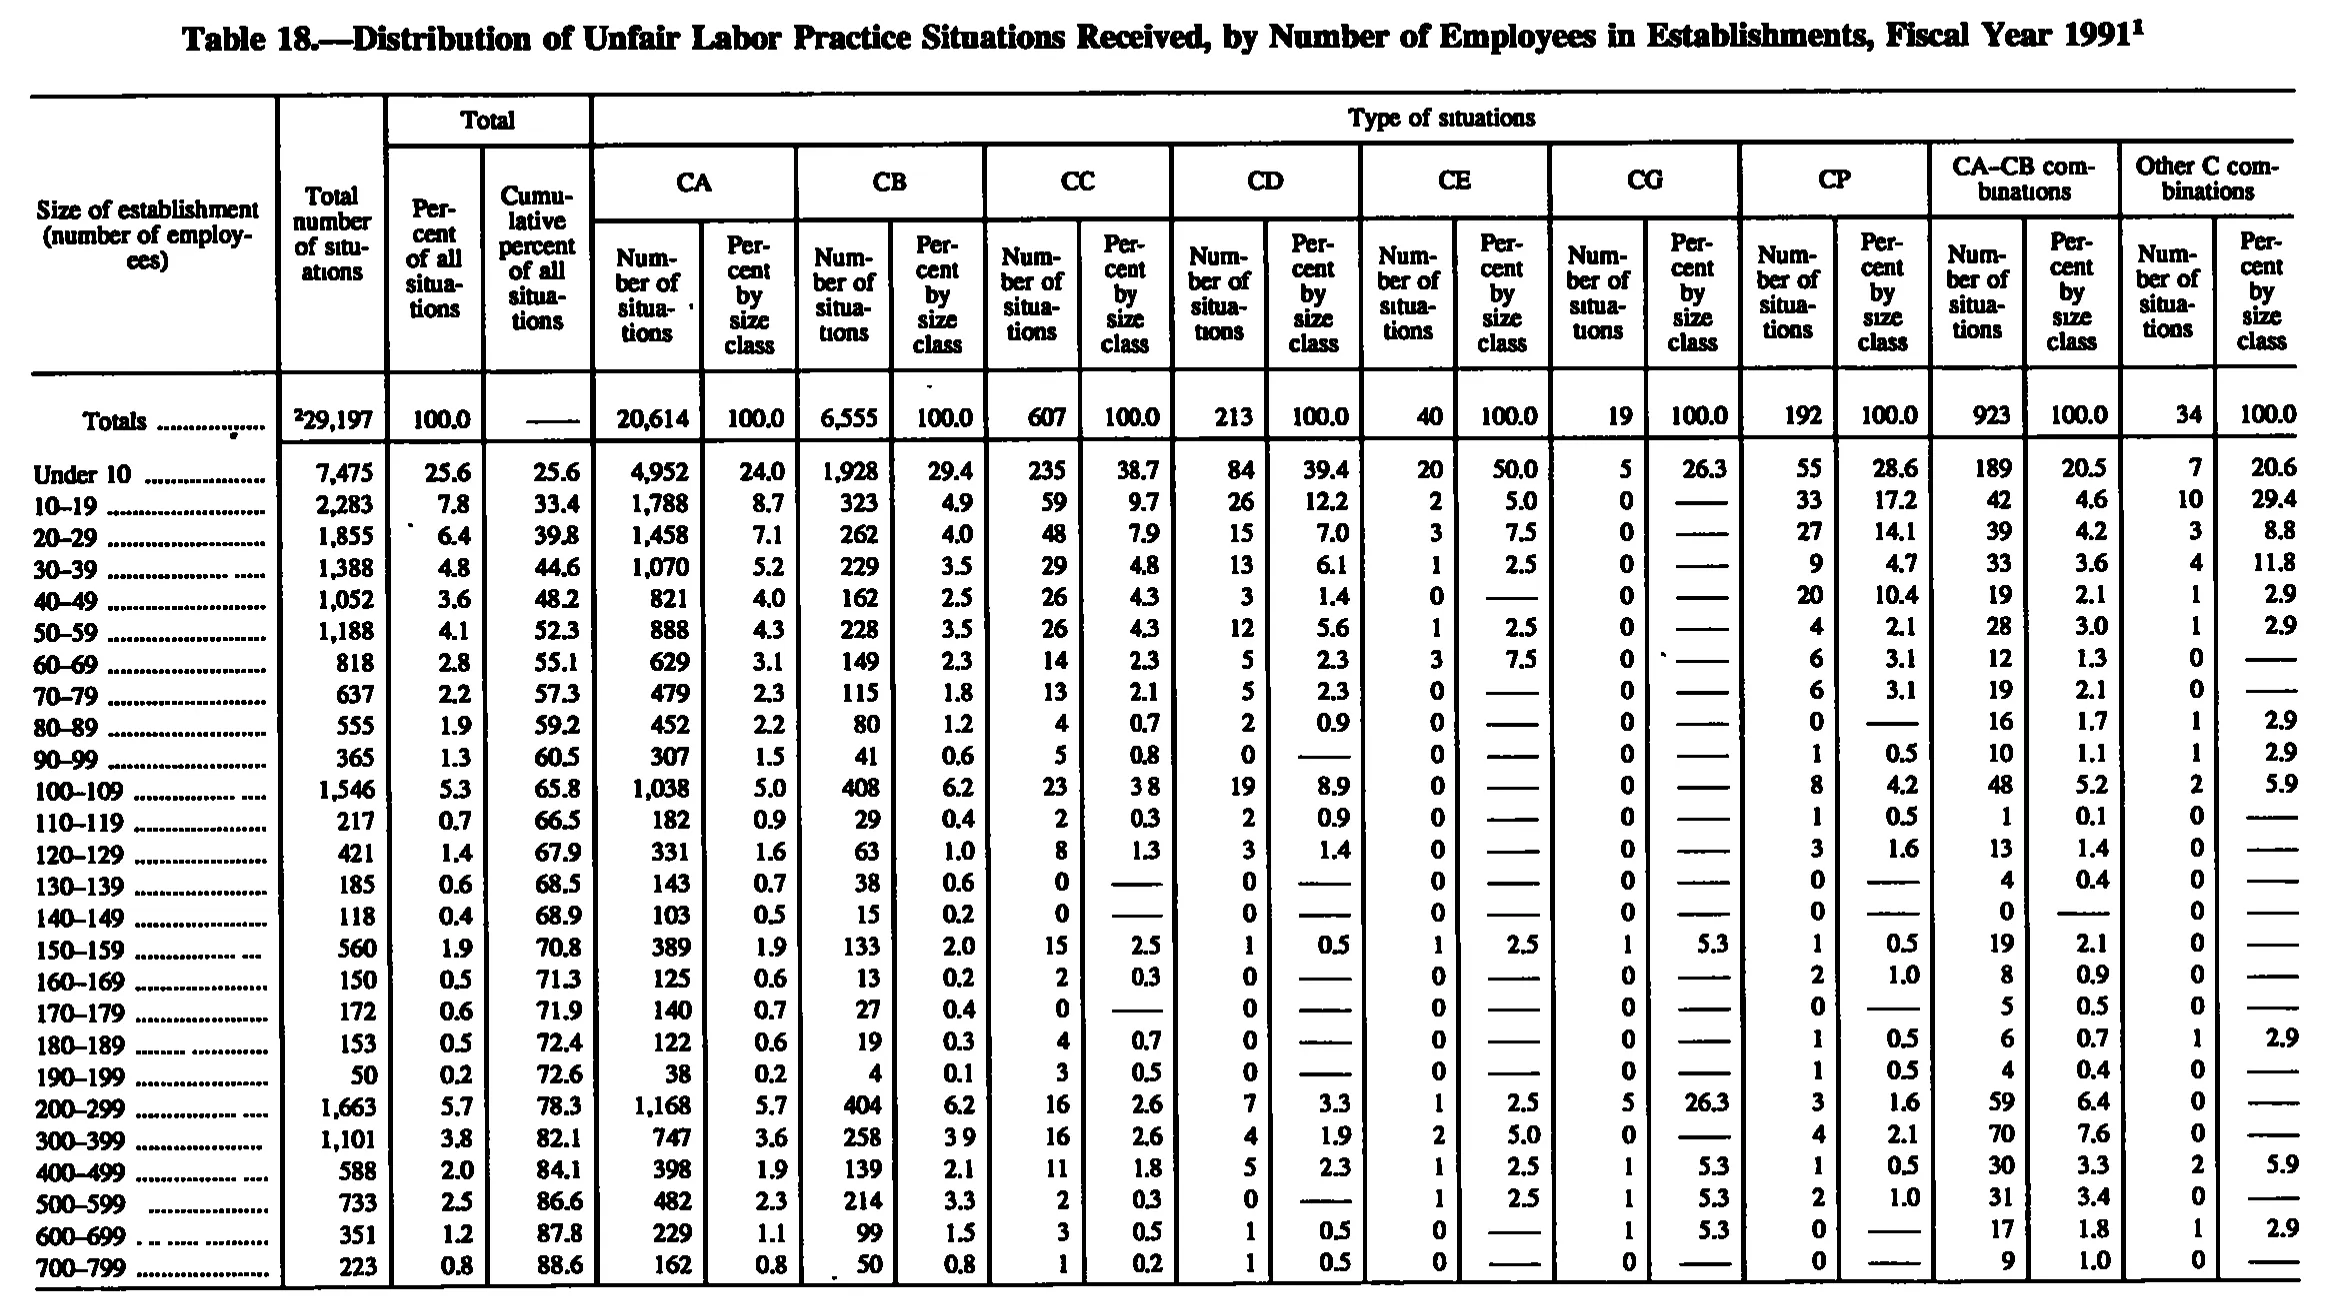
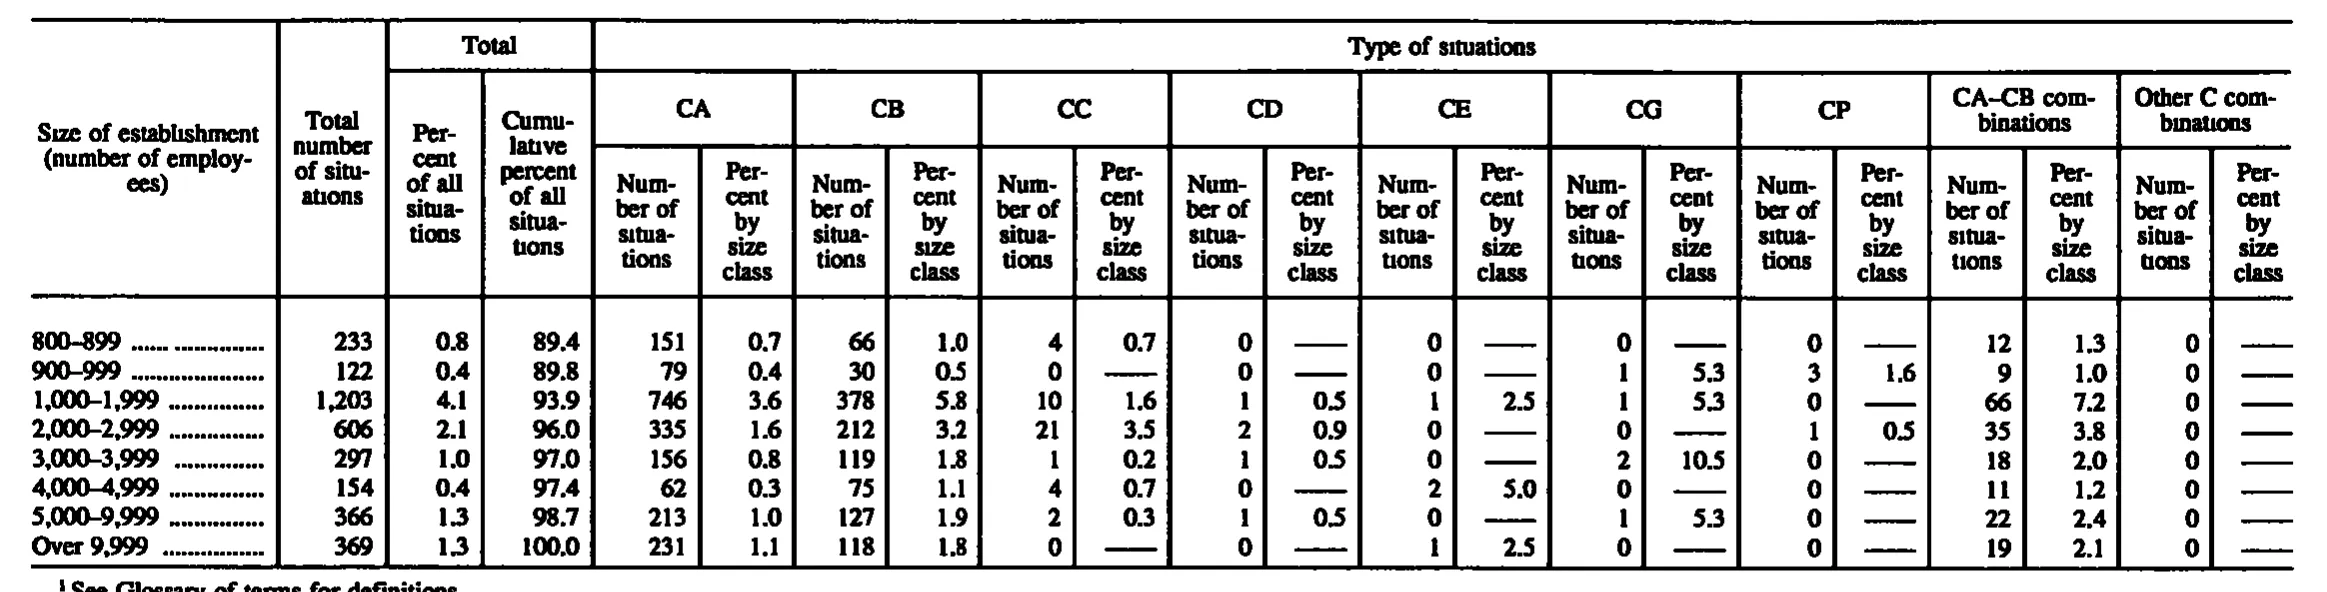
Distribution of Unfair Labor Practice Situations Received, by Number of Employees in Establishments, Fiscal Year 1991
Stitched from pp. 221–222.
| Size of establishment (number of employees) | Total number of situations | Total | Type of situations | ||||||||||||||||||
|---|---|---|---|---|---|---|---|---|---|---|---|---|---|---|---|---|---|---|---|---|---|
| Size of establishment (number of employees) | Total number of situations | Percent of all situations | Cumulative percent of all situations | CA | CB | CC | CD | CE | CG | CP | CA-CB combinations | Other C combinations | |||||||||
| Size of establishment (number of employees) | Total number of situations | Percent of all situations | Cumulative percent of all situations | Number of situations | Percent by size class | Number of situations | Percent by size class | Number of situations | Percent by size class | Number of situations | Percent by size class | Number of situations | Percent by size class | Number of situations | Percent by size class | Number of situations | Percent by size class | Number of situations | Percent by size class | Number of situations | Percent by size class |
| Totals | 29,197 | 100.0 | 20,614 | 100.0 | 6,555 | 100.0 | 607 | 100.0 | 213 | 100.0 | 40 | 100.0 | 19 | 100.0 | 192 | 100.0 | 923 | 100.0 | 34 | 100.0 | |
| Under 10 | 7,475 | 25.6 | 25.6 | 4,952 | 24.0 | 1,928 | 29.4 | 235 | 38.7 | 84 | 39.4 | 20 | 50.0 | 5 | 26.3 | 55 | 28.6 | 189 | 20.5 | 7 | 20.6 |
| 10-19 | 2,283 | 7.8 | 33.4 | 1,788 | 8.7 | 323 | 4.9 | 59 | 9.7 | 26 | 12.2 | 2 | 5.0 | 0 | 33 | 17.2 | 42 | 4.6 | 10 | 29.4 | |
| 20-29 | 1,855 | 6.4 | 39.8 | 1,458 | 7.1 | 262 | 4.0 | 48 | 7.9 | 15 | 7.0 | 3 | 7.5 | 0 | 27 | 14.1 | 39 | 4.2 | 3 | 8.8 | |
| 30-39 | 1,388 | 4.8 | 44.6 | 1,070 | 5.2 | 229 | 3.5 | 29 | 4.8 | 13 | 6.1 | 1 | 2.5 | 0 | 9 | 4.7 | 33 | 3.6 | 4 | 11.8 | |
| 40-49 | 1,052 | 3.6 | 48.2 | 821 | 4.0 | 162 | 2.5 | 26 | 4.3 | 3 | 1.4 | 0 | 0 | 20 | 10.4 | 19 | 2.1 | 1 | 2.9 | ||
| 50-59 | 1,188 | 4.1 | 52.3 | 888 | 4.3 | 228 | 3.5 | 26 | 4.3 | 12 | 5.6 | 1 | 2.5 | 0 | 4 | 2.1 | 28 | 3.0 | 1 | 2.9 | |
| 60-69 | 818 | 2.8 | 55.1 | 629 | 3.1 | 149 | 2.3 | 14 | 2.3 | 5 | 2.3 | 3 | 7.5 | 0 | 6 | 3.1 | 12 | 1.3 | 0 | ||
| 70-79 | 637 | 2.2 | 57.3 | 479 | 2.3 | 115 | 1.8 | 13 | 2.1 | 5 | 2.3 | 0 | 0 | 6 | 3.1 | 19 | 2.1 | 0 | |||
| 80-89 | 555 | 1.9 | 59.2 | 452 | 2.2 | 80 | 1.2 | 4 | 0.7 | 2 | 0.9 | 0 | 0 | 0 | 16 | 1.7 | 1 | 2.9 | |||
| 90-99 | 365 | 1.3 | 60.5 | 307 | 1.5 | 41 | 0.6 | 5 | 0.8 | 0 | 0 | 0 | 1 | 0.5 | 10 | 1.1 | 1 | 2.9 | |||
| 100-109 | 1,546 | 5.3 | 65.8 | 1,038 | 5.0 | 408 | 6.2 | 23 | 3.8 | 19 | 8.9 | 0 | 0 | 8 | 4.2 | 48 | 5.2 | 2 | 5.9 | ||
| 110-119 | 217 | 0.7 | 66.5 | 182 | 0.9 | 29 | 0.4 | 2 | 0.3 | 2 | 0.9 | 0 | 0 | 1 | 0.5 | 1 | 0.1 | 0 | |||
| 120-129 | 421 | 1.4 | 67.9 | 331 | 1.6 | 63 | 1.0 | 8 | 1.3 | 3 | 1.4 | 0 | 0 | 3 | 1.6 | 13 | 1.4 | 0 | |||
| 130-139 | 185 | 0.6 | 68.5 | 143 | 0.7 | 38 | 0.6 | 0 | 0 | 0 | 0 | 0 | 4 | 0.4 | 0 | ||||||
| 140-149 | 118 | 0.4 | 68.9 | 103 | 0.5 | 15 | 0.2 | 0 | 0 | 0 | 0 | 0 | 0 | 0 | |||||||
| 150-159 | 560 | 1.9 | 70.8 | 389 | 1.9 | 133 | 2.0 | 15 | 2.5 | 1 | 0.5 | 1 | 2.5 | 1 | 5.3 | 1 | 0.5 | 19 | 2.1 | 0 | |
| 160-169 | 150 | 0.5 | 71.3 | 125 | 0.6 | 13 | 0.2 | 2 | 0.3 | 0 | 0 | 0 | 2 | 1.0 | 8 | 0.9 | 0 | ||||
| 170-179 | 172 | 0.6 | 71.9 | 140 | 0.7 | 27 | 0.4 | 0 | 0 | 0 | 0 | 0 | 5 | 0.5 | 0 | ||||||
| 180-189 | 153 | 0.5 | 72.4 | 122 | 0.6 | 19 | 0.3 | 4 | 0.7 | 0 | 0 | 0 | 1 | 0.5 | 6 | 0.7 | 1 | 2.9 | |||
| 190-199 | 50 | 0.2 | 72.6 | 38 | 0.2 | 4 | 0.1 | 3 | 0.5 | 0 | 0 | 0 | 1 | 0.5 | 4 | 0.4 | 0 | ||||
| 200-299 | 1,663 | 5.7 | 78.3 | 1,168 | 5.7 | 404 | 6.2 | 16 | 2.6 | 7 | 3.3 | 1 | 2.5 | 5 | 26.3 | 3 | 1.6 | 59 | 6.4 | 0 | |
| 300-399 | 1,101 | 3.8 | 82.1 | 747 | 3.6 | 258 | 3.9 | 16 | 2.6 | 4 | 1.9 | 2 | 5.0 | 0 | 4 | 2.1 | 70 | 7.6 | 0 | ||
| 400-499 | 588 | 2.0 | 84.1 | 398 | 1.9 | 139 | 2.1 | 11 | 1.8 | 5 | 2.3 | 1 | 2.5 | 1 | 5.3 | 1 | 0.5 | 30 | 3.3 | 2 | 5.9 |
| 500-599 | 733 | 2.5 | 86.6 | 482 | 2.3 | 214 | 3.3 | 2 | 0.3 | 0 | 1 | 2.5 | 1 | 5.3 | 2 | 1.0 | 31 | 3.4 | 0 | ||
| 600-699 | 351 | 1.2 | 87.8 | 229 | 1.1 | 99 | 1.5 | 3 | 0.5 | 1 | 0.5 | 0 | 1 | 5.3 | 0 | 17 | 1.8 | 1 | 2.9 | ||
| 700-799 | 223 | 0.8 | 88.6 | 162 | 0.8 | 50 | 0.8 | 1 | 0.2 | 1 | 0.5 | 0 | 0 | 0 | 9 | 1.0 | 0 | ||||
| 800–899 | 233 | 0.8 | 89.4 | 151 | 0.7 | 66 | 1.0 | 4 | 0.7 | 0 | 0 | 0 | 0 | 12 | 1.3 | 0 | |||||
| 900–999 | 122 | 0.4 | 89.8 | 79 | 0.4 | 30 | 0.5 | 0 | 0 | 0 | 1 | 5.3 | 3 | 1.6 | 9 | 1.0 | 0 | ||||
| 1,000–1,999 | 1,203 | 4.1 | 93.9 | 746 | 3.6 | 378 | 5.8 | 10 | 1.6 | 1 | 0.5 | 1 | 2.5 | 1 | 5.3 | 0 | 66 | 7.2 | 0 | ||
| 2,000–2,999 | 606 | 2.1 | 96.0 | 335 | 1.6 | 212 | 3.2 | 21 | 3.5 | 2 | 0.9 | 0 | 0 | 1 | 0.5 | 35 | 3.8 | 0 | |||
| 3,000–3,999 | 297 | 1.0 | 97.0 | 156 | 0.8 | 119 | 1.8 | 1 | 0.2 | 1 | 0.5 | 0 | 2 | 10.5 | 0 | 18 | 2.0 | 0 | |||
| 4,000–4,999 | 154 | 0.4 | 97.4 | 62 | 0.3 | 75 | 1.1 | 4 | 0.7 | 0 | 2 | 5.0 | 0 | 0 | 11 | 1.2 | 0 | ||||
| 5,000–9,999 | 366 | 1.3 | 98.7 | 213 | 1.0 | 127 | 1.9 | 2 | 0.3 | 1 | 0.5 | 0 | 1 | 5.3 | 0 | 22 | 2.4 | 0 | |||
| Over 9,999 | 369 | 1.3 | 100.0 | 231 | 1.1 | 118 | 1.8 | 0 | 0 | 1 | 2.5 | 0 | 0 | 19 | 2.1 | 0 | |||||
- 1 See Glossary of terms for definitions.
254 of 254 figures sit in a row or column sum that works out.
Reader’s notes
p. 221. The crop is cut off at the bottom: the body ends mid-table at the "700-799" size class (the cumulative percent is only 88.6, so further size classes follow on the rest of the page), and no footnote text is visible, although footnote markers 1 (on the caption) and 2 (on the Totals "Total number of situations" cell) are printed. 22 columns: stub, "Total number of situations", two "Total" percent columns, and a Number/Percent pair for each of CA, CB, CC, CD, CE, CG, CP, CA-CB combinations and Other C combinations. Many percent cells print a long dash rule instead of a value (alongside a printed 0 in the matching number column); these are transcribed as "", including the Totals row's cumulative-percent cell. Two decimal points are nearly invisible in the scan and read as a blank space: "100-109" x CC "Percent by size class" prints as "3 8" and "300-399" x CB "Percent by size class" prints as "3 9". I transcribed them as 3.8 and 3.9; both are confirmed by the column's own arithmetic (23/607 = 3.8, 258/6,555 = 3.9) and by the uniform one-decimal format of every other percent cell. The stub labels use a short dash that I transcribed as a plain hyphen ("10-19"); the same choice was made in the heading "CA-CB combinations", where the printed dash is slightly longer and may be an en dash. Internal checks: every row's nine type-of-situation counts sum exactly to that row's "Total number of situations", the cumulative percents chain correctly down the column, and the nine column totals sum to 29,197. No misprints detected.
p. 222. The crop is a continuation page: the column headings are reprinted here, but the body begins at size class 800–899, so the smaller size classes (and any total line) are on the preceding page. The body ends at "Over 9,999", where the cumulative percent reaches 100.0, so no total row is printed on this page. Column count is 22: stub, "Total number of situations", two columns under "Total" (percent of all situations; cumulative percent of all situations), and 18 columns under "Type of situations" (nine two-column pairs: CA, CB, CC, CD, CE, CG, CP, CA–CB combinations, Other C combinations). Many "Percent by size class" cells hold a printed em-dash rule (——) rather than a value; these are transcribed as empty cells per instruction. The entire "Other C combinations" pair is 0 / dash-rule for every row. Doubtful cell: row "4,000–4,999", column "Percent of all situations", read as 0.4. All other rows imply a grand total near 29,300 situations, which would make 154 about 0.5 percent, and the cumulative column also advances by 0.4 (97.0 to 97.4), so the printed figure may be a rounding artifact or a misprint. Transcribed as printed, not corrected. The footnote line is clipped by the bottom edge of the crop (only the upper half of the letters is visible) but is legible as "See Glossary of terms for definitions"; the terminal period is inferred from the partial glyph. Row-label ranges and the "CA–CB" heading are printed with en dashes; transcribed as such.
Source image
Source data: U.S. NLRB Annual Reports (public domain). Reconstruction by NLRB Stats Archive. Read by claude-opus-5 (effort max, prompt extract_v1) from the 300-dpi scan; stitched by page. Updated October 2026.