NLRB Stats Archive › Annual Reports › FY1991 › Standard Federal Administrative Regional Distribution of Cases Received, Fiscal Year 1991
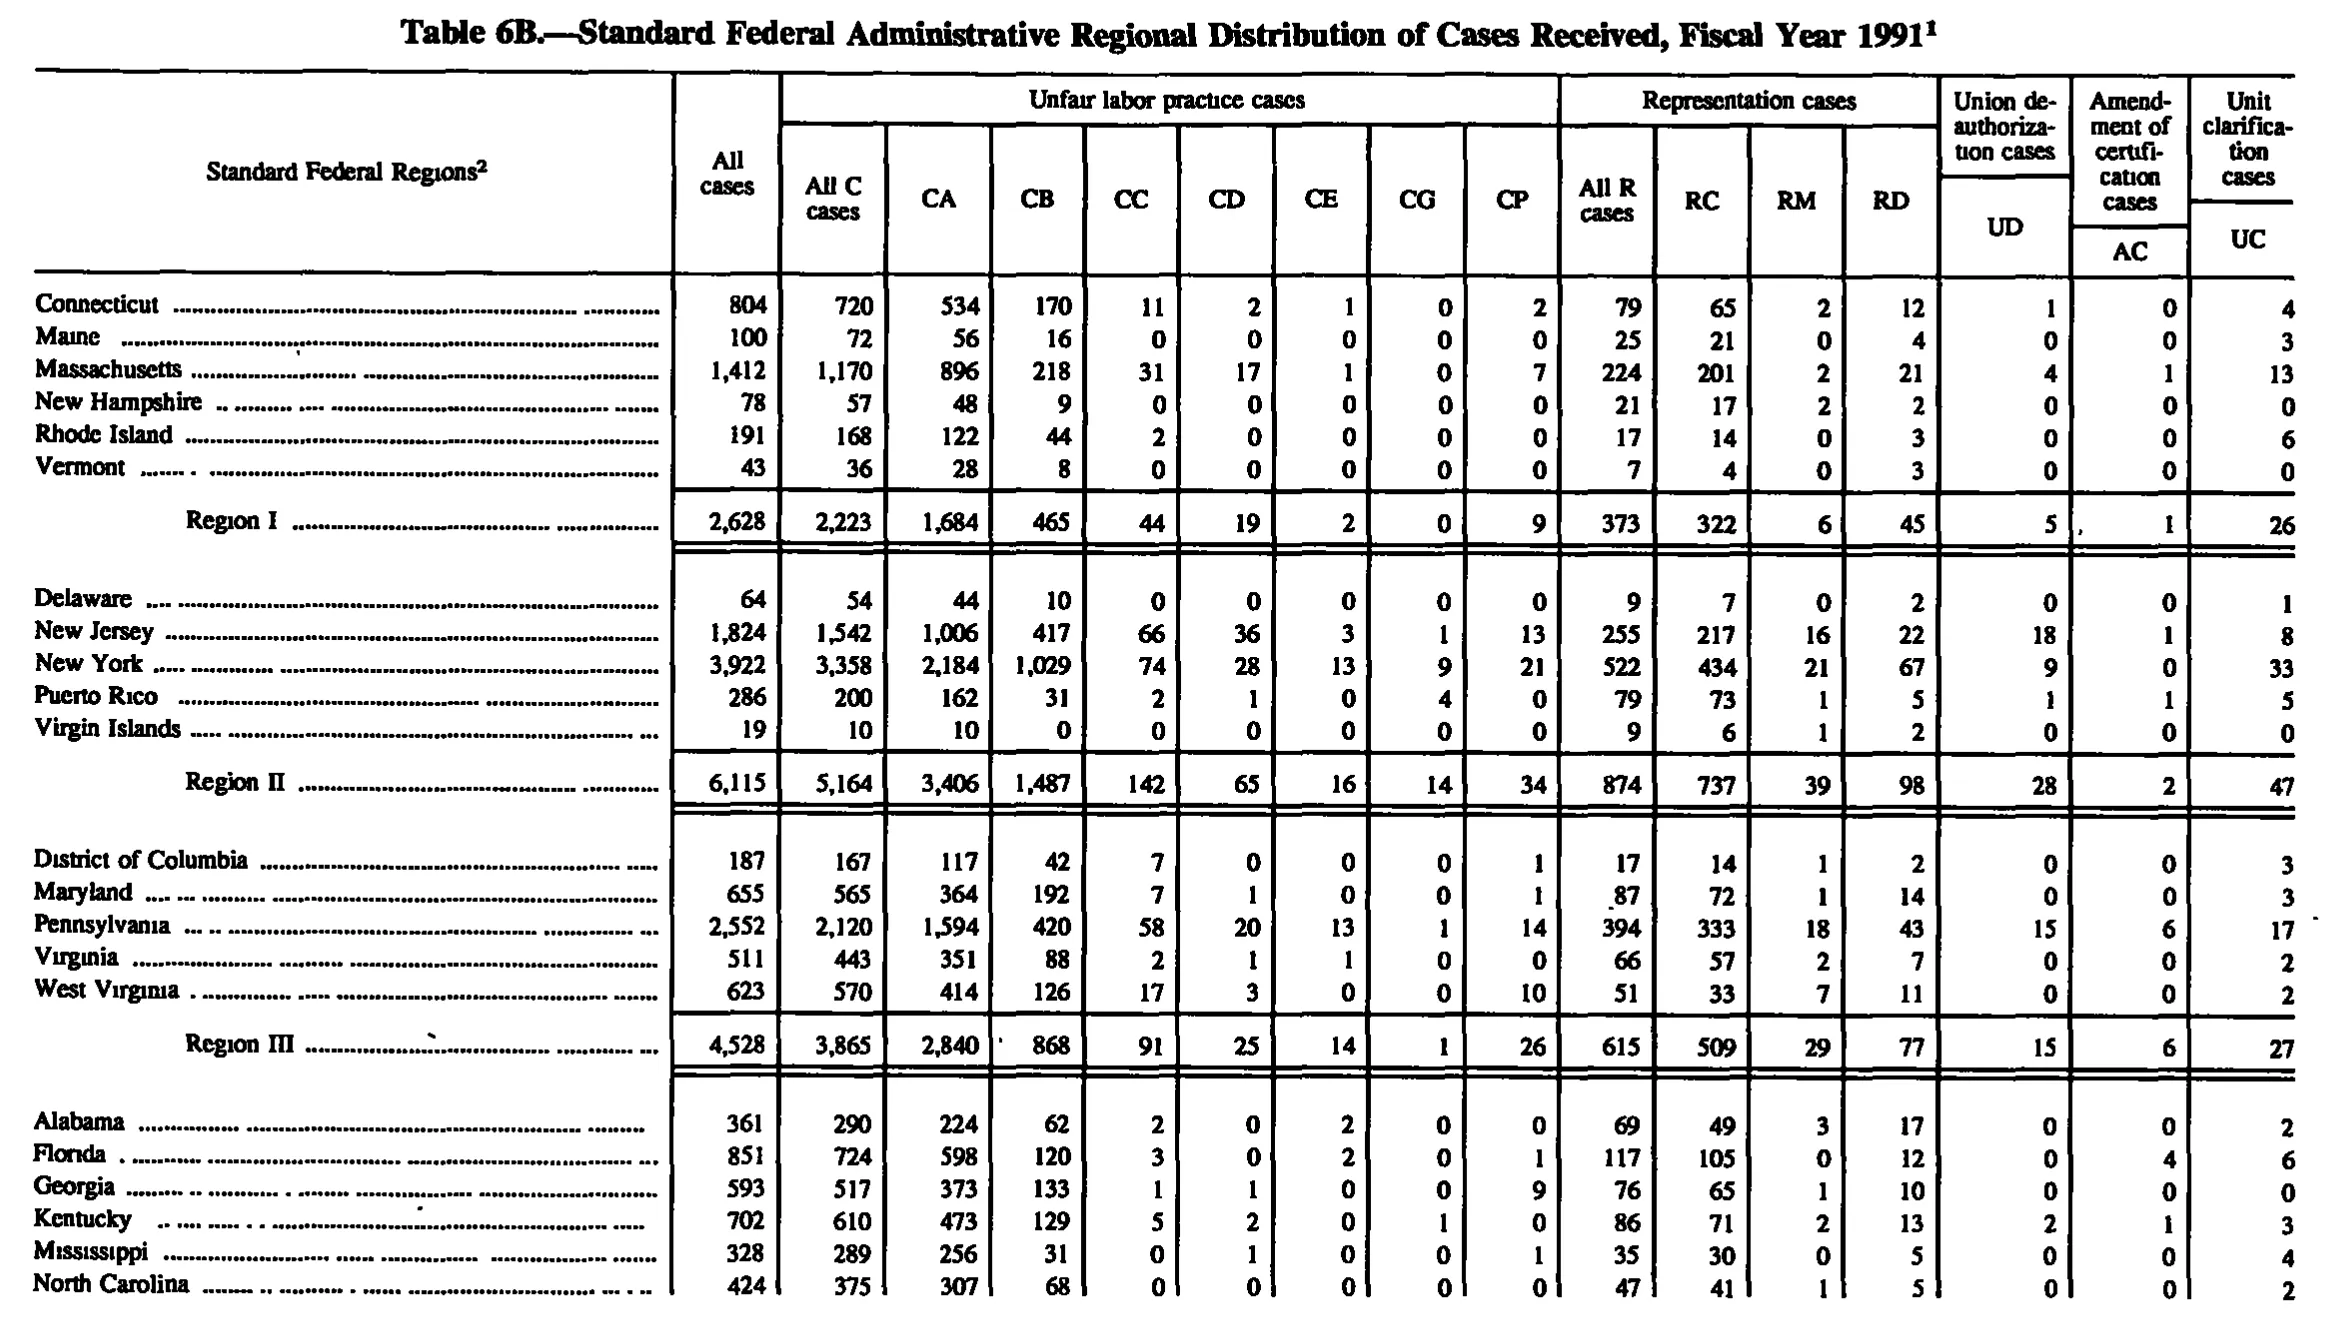
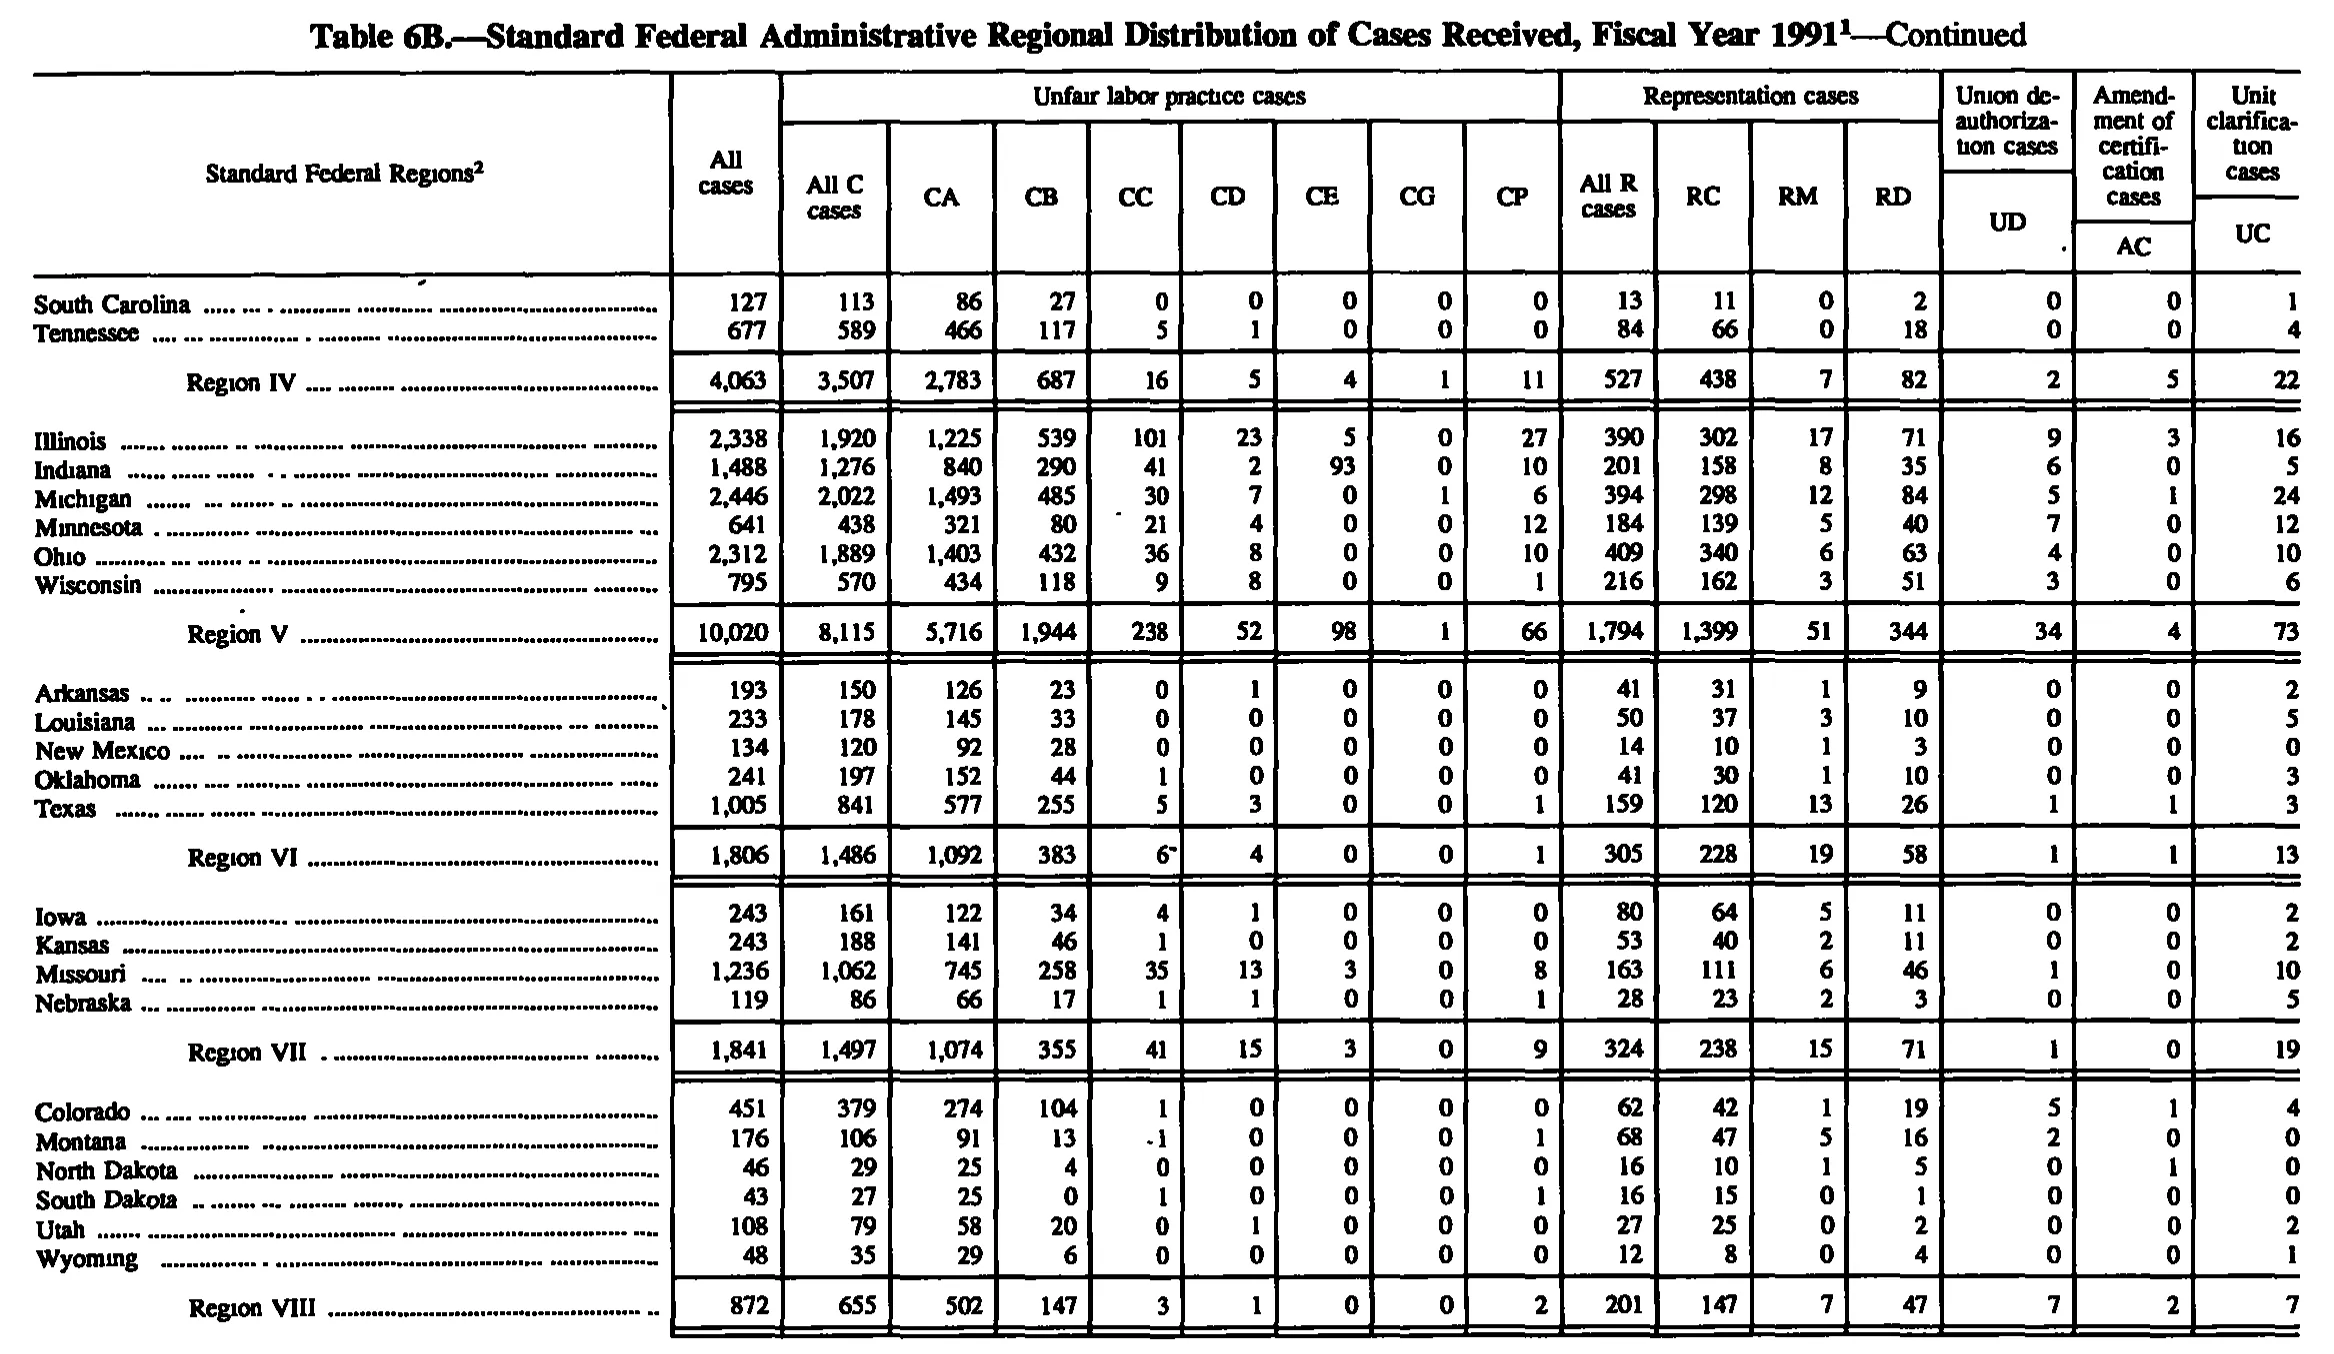
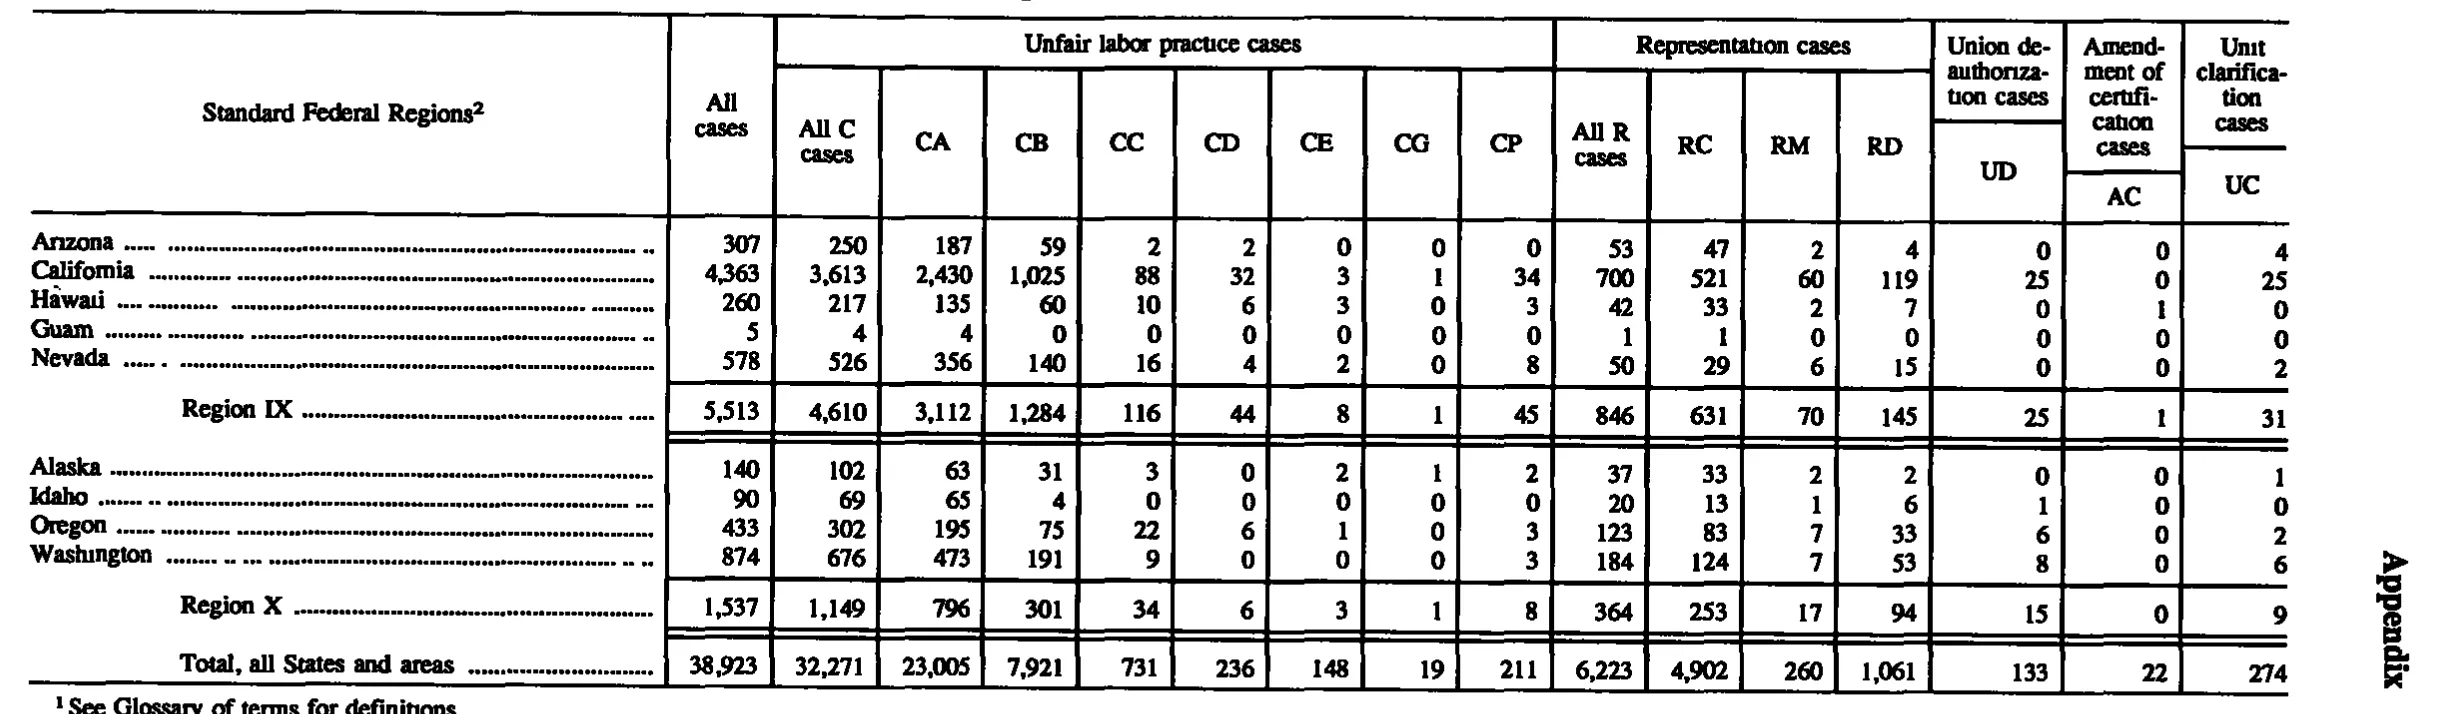
Standard Federal Administrative Regional Distribution of Cases Received, Fiscal Year 1991
Stitched from pp. 184–186.
| Standard Federal Regions | All cases | Unfair labor practice cases | Representation cases | Union deauthorization cases | Amendment of certification cases | Unit clarification cases | ||||||||||
|---|---|---|---|---|---|---|---|---|---|---|---|---|---|---|---|---|
| Standard Federal Regions | All cases | All C cases | CA | CB | CC | CD | CE | CG | CP | All R cases | RC | RM | RD | UD | AC | UC |
| Connecticut | 804 | 720 | 534 | 170 | 11 | 2 | 1 | 0 | 2 | 79 | 65 | 2 | 12 | 1 | 0 | 4 |
| Maine | 100 | 72 | 56 | 16 | 0 | 0 | 0 | 0 | 0 | 25 | 21 | 0 | 4 | 0 | 0 | 3 |
| Massachusetts | 1,412 | 1,170 | 896 | 218 | 31 | 17 | 1 | 0 | 7 | 224 | 201 | 2 | 21 | 4 | 1 | 13 |
| New Hampshire | 78 | 57 | 48 | 9 | 0 | 0 | 0 | 0 | 0 | 21 | 17 | 2 | 2 | 0 | 0 | 0 |
| Rhode Island | 191 | 168 | 122 | 44 | 2 | 0 | 0 | 0 | 0 | 17 | 14 | 0 | 3 | 0 | 0 | 6 |
| Vermont | 43 | 36 | 28 | 8 | 0 | 0 | 0 | 0 | 0 | 7 | 4 | 0 | 3 | 0 | 0 | 0 |
| Region I | 2,628 | 2,223 | 1,684 | 465 | 44 | 19 | 2 | 0 | 9 | 373 | 322 | 6 | 45 | 5 | 1 | 26 |
| Delaware | 64 | 54 | 44 | 10 | 0 | 0 | 0 | 0 | 0 | 9 | 7 | 0 | 2 | 0 | 0 | 1 |
| New Jersey | 1,824 | 1,542 | 1,006 | 417 | 66 | 36 | 3 | 1 | 13 | 255 | 217 | 16 | 22 | 18 | 1 | 8 |
| New York | 3,922 | 3,358 | 2,184 | 1,029 | 74 | 28 | 13 | 9 | 21 | 522 | 434 | 21 | 67 | 9 | 0 | 33 |
| Puerto Rico | 286 | 200 | 162 | 31 | 2 | 1 | 0 | 4 | 0 | 79 | 73 | 1 | 5 | 1 | 1 | 5 |
| Virgin Islands | 19 | 10 | 10 | 0 | 0 | 0 | 0 | 0 | 0 | 9 | 6 | 1 | 2 | 0 | 0 | 0 |
| Region II | 6,115 | 5,164 | 3,406 | 1,487 | 142 | 65 | 16 | 14 | 34 | 874 | 737 | 39 | 98 | 28 | 2 | 47 |
| District of Columbia | 187 | 167 | 117 | 42 | 7 | 0 | 0 | 0 | 1 | 17 | 14 | 1 | 2 | 0 | 0 | 3 |
| Maryland | 655 | 565 | 364 | 192 | 7 | 1 | 0 | 0 | 1 | 87 | 72 | 1 | 14 | 0 | 0 | 3 |
| Pennsylvania | 2,552 | 2,120 | 1,594 | 420 | 58 | 20 | 13 | 1 | 14 | 394 | 333 | 18 | 43 | 15 | 6 | 17 |
| Virginia | 511 | 443 | 351 | 88 | 2 | 1 | 1 | 0 | 0 | 66 | 57 | 2 | 7 | 0 | 0 | 2 |
| West Virginia | 623 | 570 | 414 | 126 | 17 | 3 | 0 | 0 | 10 | 51 | 33 | 7 | 11 | 0 | 0 | 2 |
| Region III | 4,528 | 3,865 | 2,840 | 868 | 91 | 25 | 14 | 1 | 26 | 615 | 509 | 29 | 77 | 15 | 6 | 27 |
| Alabama | 361 | 290 | 224 | 62 | 2 | 0 | 2 | 0 | 0 | 69 | 49 | 3 | 17 | 0 | 0 | 2 |
| Florida | 851 | 724 | 598 | 120 | 3 | 0 | 2 | 0 | 1 | 117 | 105 | 0 | 12 | 0 | 4 | 6 |
| Georgia | 593 | 517 | 373 | 133 | 1 | 1 | 0 | 0 | 9 | 76 | 65 | 1 | 10 | 0 | 0 | 0 |
| Kentucky | 702 | 610 | 473 | 129 | 5 | 2 | 0 | 1 | 0 | 86 | 71 | 2 | 13 | 2 | 1 | 3 |
| Mississippi | 328 | 289 | 256 | 31 | 0 | 1 | 0 | 0 | 1 | 35 | 30 | 0 | 5 | 0 | 0 | 4 |
| North Carolina | 424 | 375 | 307 | 68 | 0 | 0 | 0 | 0 | 0 | 47 | 41 | 1 | 5 | 0 | 0 | 2 |
| South Carolina | 127 | 113 | 86 | 27 | 0 | 0 | 0 | 0 | 0 | 13 | 11 | 0 | 2 | 0 | 0 | 1 |
| Tennessee | 677 | 589 | 466 | 117 | 5 | 1 | 0 | 0 | 0 | 84 | 66 | 0 | 18 | 0 | 0 | 4 |
| Region IV | 4,063 | 3,507 | 2,783 | 687 | 16 | 5 | 4 | 1 | 11 | 527 | 438 | 7 | 82 | 2 | 5 | 22 |
| Illinois | 2,338 | 1,920 | 1,225 | 539 | 101 | 23 | 5 | 0 | 27 | 390 | 302 | 17 | 71 | 9 | 3 | 16 |
| Indiana | 1,488 | 1,276 | 840 | 290 | 41 | 2 | 93 | 0 | 10 | 201 | 158 | 8 | 35 | 6 | 0 | 5 |
| Michigan | 2,446 | 2,022 | 1,493 | 485 | 30 | 7 | 0 | 1 | 6 | 394 | 298 | 12 | 84 | 5 | 1 | 24 |
| Minnesota | 641 | 438 | 321 | 80 | 21 | 4 | 0 | 0 | 12 | 184 | 139 | 5 | 40 | 7 | 0 | 12 |
| Ohio | 2,312 | 1,889 | 1,403 | 432 | 36 | 8 | 0 | 0 | 10 | 409 | 340 | 6 | 63 | 4 | 0 | 10 |
| Wisconsin | 795 | 570 | 434 | 118 | 9 | 8 | 0 | 0 | 1 | 216 | 162 | 3 | 51 | 3 | 0 | 6 |
| Region V | 10,020 | 8,115 | 5,716 | 1,944 | 238 | 52 | 98 | 1 | 66 | 1,794 | 1,399 | 51 | 344 | 34 | 4 | 73 |
| Arkansas | 193 | 150 | 126 | 23 | 0 | 1 | 0 | 0 | 0 | 41 | 31 | 1 | 9 | 0 | 0 | 2 |
| Louisiana | 233 | 178 | 145 | 33 | 0 | 0 | 0 | 0 | 0 | 50 | 37 | 3 | 10 | 0 | 0 | 5 |
| New Mexico | 134 | 120 | 92 | 28 | 0 | 0 | 0 | 0 | 0 | 14 | 10 | 1 | 3 | 0 | 0 | 0 |
| Oklahoma | 241 | 197 | 152 | 44 | 1 | 0 | 0 | 0 | 0 | 41 | 30 | 1 | 10 | 0 | 0 | 3 |
| Texas | 1,005 | 841 | 577 | 255 | 5 | 3 | 0 | 0 | 1 | 159 | 120 | 13 | 26 | 1 | 1 | 3 |
| Region VI | 1,806 | 1,486 | 1,092 | 383 | 6 | 4 | 0 | 0 | 1 | 305 | 228 | 19 | 58 | 1 | 1 | 13 |
| Iowa | 243 | 161 | 122 | 34 | 4 | 1 | 0 | 0 | 0 | 80 | 64 | 5 | 11 | 0 | 0 | 2 |
| Kansas | 243 | 188 | 141 | 46 | 1 | 0 | 0 | 0 | 0 | 53 | 40 | 2 | 11 | 0 | 0 | 2 |
| Missouri | 1,236 | 1,062 | 745 | 258 | 35 | 13 | 3 | 0 | 8 | 163 | 111 | 6 | 46 | 1 | 0 | 10 |
| Nebraska | 119 | 86 | 66 | 17 | 1 | 1 | 0 | 0 | 1 | 28 | 23 | 2 | 3 | 0 | 0 | 5 |
| Region VII | 1,841 | 1,497 | 1,074 | 355 | 41 | 15 | 3 | 0 | 9 | 324 | 238 | 15 | 71 | 1 | 0 | 19 |
| Colorado | 451 | 379 | 274 | 104 | 1 | 0 | 0 | 0 | 0 | 62 | 42 | 1 | 19 | 5 | 1 | 4 |
| Montana | 176 | 106 | 91 | 13 | 1 | 0 | 0 | 0 | 1 | 68 | 47 | 5 | 16 | 2 | 0 | 0 |
| North Dakota | 46 | 29 | 25 | 4 | 0 | 0 | 0 | 0 | 0 | 16 | 10 | 1 | 5 | 0 | 1 | 0 |
| South Dakota | 43 | 27 | 25 | 0 | 1 | 0 | 0 | 0 | 1 | 16 | 15 | 0 | 1 | 0 | 0 | 0 |
| Utah | 108 | 79 | 58 | 20 | 0 | 1 | 0 | 0 | 0 | 27 | 25 | 0 | 2 | 0 | 0 | 2 |
| Wyoming | 48 | 35 | 29 | 6 | 0 | 0 | 0 | 0 | 0 | 12 | 8 | 0 | 4 | 0 | 0 | 1 |
| Region VIII | 872 | 655 | 502 | 147 | 3 | 1 | 0 | 0 | 2 | 201 | 147 | 7 | 47 | 7 | 2 | 7 |
| Arizona | 307 | 250 | 187 | 59 | 2 | 2 | 0 | 0 | 0 | 53 | 47 | 2 | 4 | 0 | 0 | 4 |
| California | 4,363 | 3,613 | 2,430 | 1,025 | 88 | 32 | 3 | 1 | 34 | 700 | 521 | 60 | 119 | 25 | 0 | 25 |
| Hawaii | 260 | 217 | 135 | 60 | 10 | 6 | 3 | 0 | 3 | 42 | 33 | 2 | 7 | 0 | 1 | 0 |
| Guam | 5 | 4 | 4 | 0 | 0 | 0 | 0 | 0 | 0 | 1 | 1 | 0 | 0 | 0 | 0 | 0 |
| Nevada | 578 | 526 | 356 | 140 | 16 | 4 | 2 | 0 | 8 | 50 | 29 | 6 | 15 | 0 | 0 | 2 |
| Region IX | 5,513 | 4,610 | 3,112 | 1,284 | 116 | 44 | 8 | 1 | 45 | 846 | 631 | 70 | 145 | 25 | 1 | 31 |
| Alaska | 140 | 102 | 63 | 31 | 3 | 0 | 2 | 1 | 2 | 37 | 33 | 2 | 2 | 0 | 0 | 1 |
| Idaho | 90 | 69 | 65 | 4 | 0 | 0 | 0 | 0 | 0 | 20 | 13 | 1 | 6 | 1 | 0 | 0 |
| Oregon | 433 | 302 | 195 | 75 | 22 | 6 | 1 | 0 | 3 | 123 | 83 | 7 | 33 | 6 | 0 | 2 |
| Washington | 874 | 676 | 473 | 191 | 9 | 0 | 0 | 0 | 3 | 184 | 124 | 7 | 53 | 8 | 0 | 6 |
| Region X | 1,537 | 1,149 | 796 | 301 | 34 | 6 | 3 | 1 | 8 | 364 | 253 | 17 | 94 | 15 | 0 | 9 |
| Total, all States and areas | 38,923 | 32,271 | 23,005 | 7,921 | 731 | 236 | 148 | 19 | 211 | 6,223 | 4,902 | 260 | 1,061 | 133 | 22 | 274 |
- 1 See Glossary of terms for definitions.
780 of 780 figures sit in a row or column sum that works out.
Reader’s notes
p. 184. The crop is cut off at the bottom: the table continues past the "North Carolina" row (the Region IV block is incomplete, with no Region IV total and no later regions shown), and no footnote texts appear on this page, so `footnotes` is empty even though markers 1 (on the caption) and 2 (on the stub heading "Standard Federal Regions") are printed. Column structure: 17 columns — stub, "All cases", eight "Unfair labor practice cases" columns (All C cases, CA, CB, CC, CD, CE, CG, CP), four "Representation cases" columns (All R cases, RC, RM, RD), then UD, AC and UC, each under its own tall heading ("Union de-authorization cases", "Amend-ment of certifi-cation cases", "Unit clarifica-tion cases"), joined here with the end-of-line hyphens repaired. Scan artifacts, none affecting a value: a stray comma-like speck sits between the UD "5" and AC "1" in the "Region I" total row; a stray dot precedes "868" in the CB column of the "Region III" row; a stray tick appears above the right margin near the Pennsylvania row. The leader dots after each row label and the small superscript 2 after the stub heading were handled per the instructions. All row and column arithmetic checks internally (each state's All C = CA+CB+CC+CD+CE+CG+CP, All R = RC+RM+RD, All cases = All C + All R + UD + AC + UC, and each Region total equals the sum of its listed states), which supports the digit readings; nothing was computed or altered.
p. 185. This crop is a "—Continued" page: it begins mid-table with the last two states of Region IV (South Carolina, Tennessee) followed by the Region IV total line, whose earlier member states are on the preceding page. The table also continues past the bottom of the crop (no Region IX/X or grand total is shown here). Footnote markers 1 (in the caption) and 2 (on the stub heading "Standard Federal Regions") appear, but no footnote texts are printed on this page, so `footnotes` is empty. Column-header structure: the three right-hand columns each print a descriptive name over a code box ("Union deauthorization cases"/UD, "Amendment of certification cases"/AC, "Unit clarification cases"/UC); these are recorded as the two heading levels used by the "Unfair labor practice cases" and "Representation cases" groups. Hyphenated line breaks in the headings were repaired ("Union de-authorization" -> "Union deauthorization", "Amend-ment of certifi-cation cases" -> "Amendment of certification cases", "Unit clarifica-tion cases" -> "Unit clarification cases"). Doubtful ink: the CC cell of "Region VI" has a small stray mark immediately to the right of the 6, and the CC cell of "Montana" has a stray dot immediately to the left of the 1; in both cases the surrounding ink reads as scanner speckle, not a footnote marker or digit. Both readings are confirmed by arithmetic: Montana's CC=1 makes its C components sum to its All C of 106, and Region VI CC = 0+0+0+1+5 = 6 from its member states. Likewise a faint speck sits just left of the CC value for Minnesota; the cell reads 21 and is consistent with the Region V CC total of 238. No printed total on this page disagrees with the sum of its parts: every region line (IV, V, VI, VII, VIII) was checked against its member states, and every row's "All cases" against All C + All R + UD + AC + UC, with no discrepancies found.
p. 186. The crop is the final portion of a table continued from earlier pages: it begins mid-body with the Region IX states (no section label row is printed above Arizona), but the full column headings are repeated on this page, so they are transcribed. 17 printed columns: stub, All cases, eight unfair-labor-practice columns (All C cases, CA, CB, CC, CD, CE, CG, CP), four representation columns (All R cases, RC, RM, RD), then UD, AC and UC, each under its own spanning long heading. Footnote 1 is clipped by the bottom edge of the crop — the descenders of its last line are cut, but the wording "See Glossary of terms for definitions" is legible; the closing period is inferred from the cut baseline. The stub heading carries a raised 2 ("Standard Federal Regions^2"), but footnote 2 itself is not visible on this crop (it would fall below the cut). The table caption and any footnote marker on it are above the crop. Scan artifacts: the Hawaii row label is printed with a speck over the "a" (reads "Hàwaii"); it is "Hawaii". Leader dots after the row labels and the vertical/horizontal rules were dropped. The word "Appendix" at the right edge is the running head and is excluded. All internal arithmetic checks: every state row's All C cases equals its CA–CP sum, All R cases equals RC+RM+RD, All cases equals All C + All R + UD + AC + UC; the Region IX, Region X and grand-total rows equal the sums of their components. No misprints detected.
Source image
Source data: U.S. NLRB Annual Reports (public domain). Reconstruction by NLRB Stats Archive. Read by claude-opus-5 (effort max, prompt extract_v1) from the 300-dpi scan; stitched by page. Updated October 2026.