NLRB Stats Archive › Annual Reports › FY1990 › Proceedings Decided by Circuit Courts of Appeals on Petitions for Enforcement and/or Review of Board Orders, Fiscal Year 1990, Compared With 5-Year Cumulative Totals, Fiscal Years 1985 Through 1989
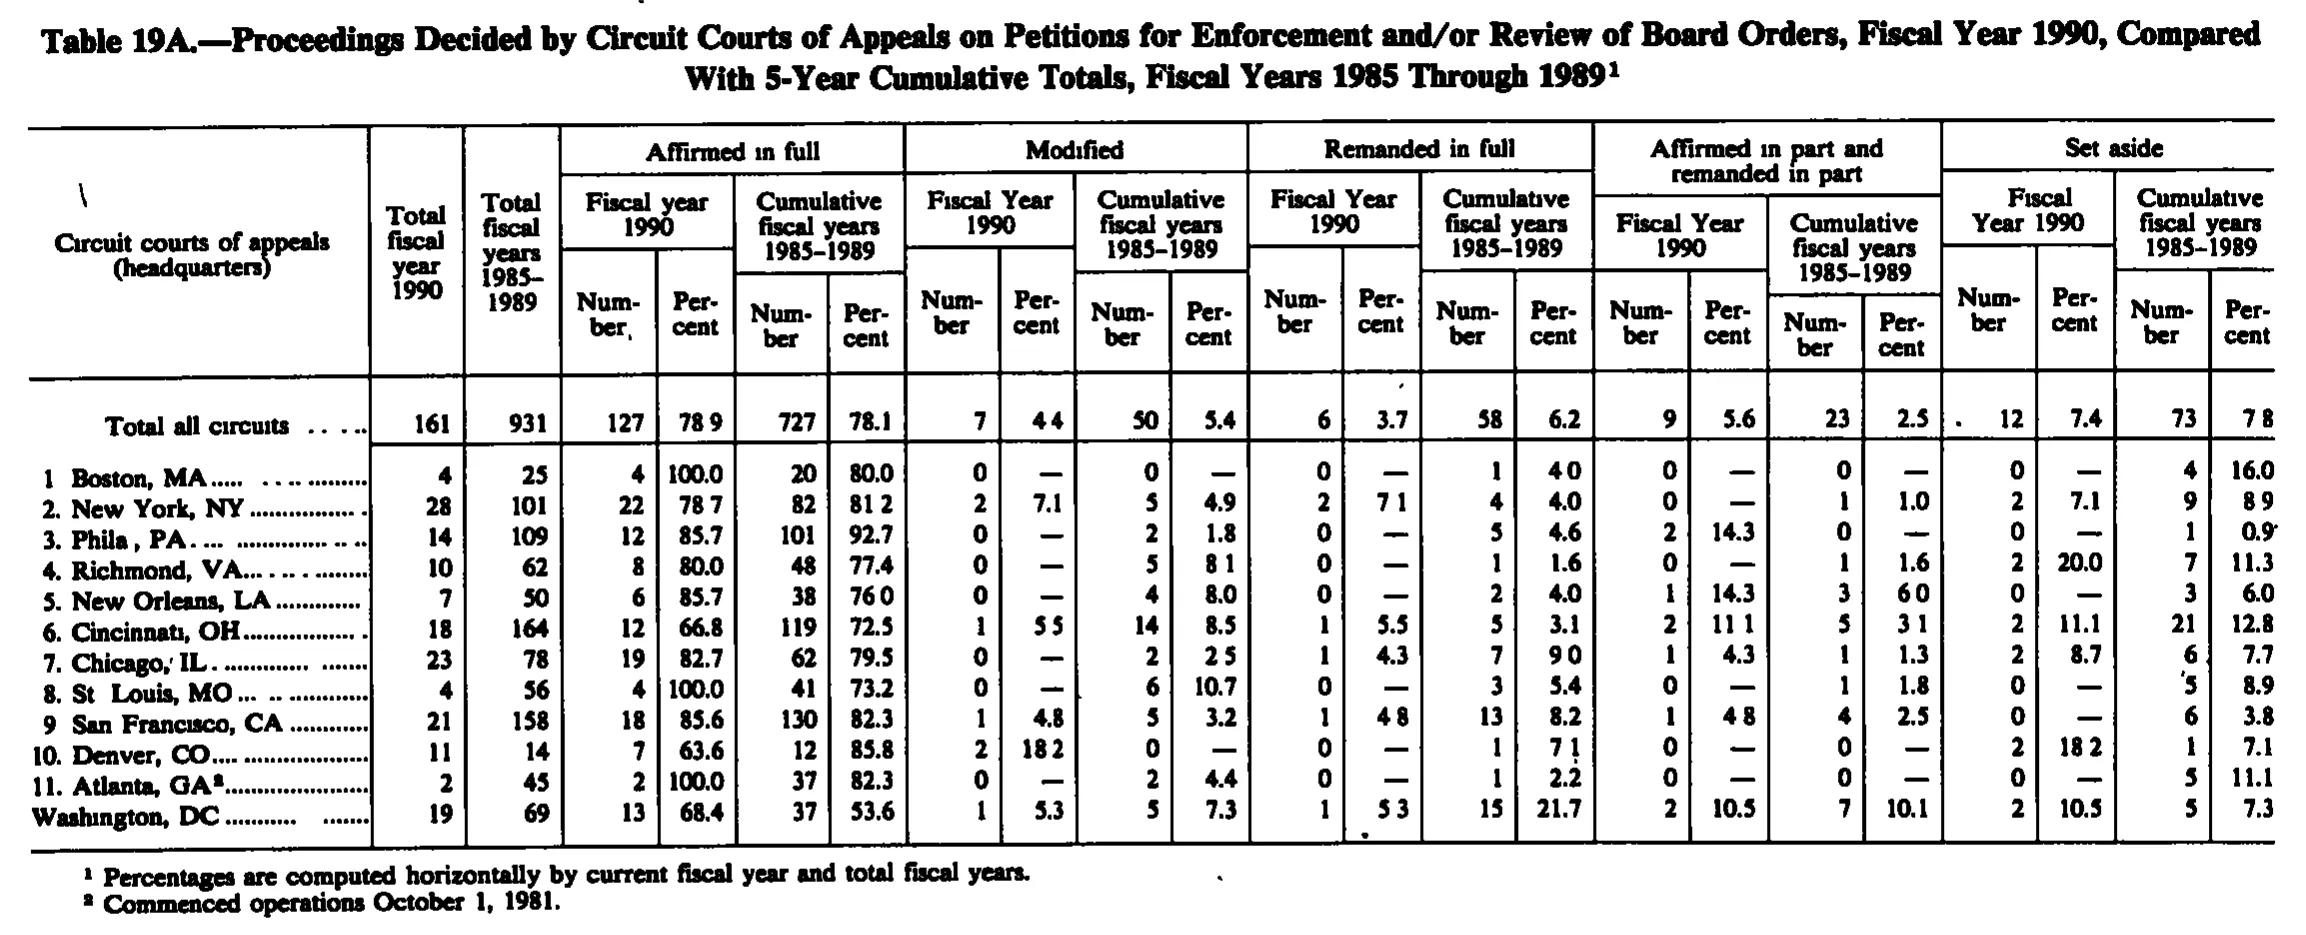
Proceedings Decided by Circuit Courts of Appeals on Petitions for Enforcement and/or Review of Board Orders, Fiscal Year 1990, Compared With 5-Year Cumulative Totals, Fiscal Years 1985 Through 1989
| Circuit courts of appeals (headquarters) | Total fiscal year 1990 | Total fiscal years 1985-1989 | Affirmed in full | Modified | Remanded in full | Affirmed in part and remanded in part | Set aside | |||||||||||||||
|---|---|---|---|---|---|---|---|---|---|---|---|---|---|---|---|---|---|---|---|---|---|---|
| Circuit courts of appeals (headquarters) | Total fiscal year 1990 | Total fiscal years 1985-1989 | Fiscal year 1990 | Cumulative fiscal years 1985-1989 | Fiscal Year 1990 | Cumulative fiscal years 1985-1989 | Fiscal Year 1990 | Cumulative fiscal years 1985-1989 | Fiscal Year 1990 | Cumulative fiscal years 1985-1989 | Fiscal Year 1990 | Cumulative fiscal years 1985-1989 | ||||||||||
| Circuit courts of appeals (headquarters) | Total fiscal year 1990 | Total fiscal years 1985-1989 | Number | Percent | Number | Percent | Number | Percent | Number | Percent | Number | Percent | Number | Percent | Number | Percent | Number | Percent | Number | Percent | Number | Percent |
| Total all circuits | 161 | 931 | 127 | 78.9 | 727 | 78.1 | 7 | 4.4 | 50 | 5.4 | 6 | 3.7 | 58 | 6.2 | 9 | 5.6 | 23 | 2.5 | 12 | 7.4 | 73 | 7.8 |
| 1. Boston, MA | 4 | 25 | 4 | 100.0 | 20 | 80.0 | 0 | 0 | 0 | 1 | 4.0 | 0 | 0 | 0 | 4 | 16.0 | ||||||
| 2. New York, NY | 28 | 101 | 22 | 78.7 | 82 | 81.2 | 2 | 7.1 | 5 | 4.9 | 2 | 7.1 | 4 | 4.0 | 0 | 1 | 1.0 | 2 | 7.1 | 9 | 8.9 | |
| 3. Phila., PA | 14 | 109 | 12 | 85.7 | 101 | 92.7 | 0 | 2 | 1.8 | 0 | 5 | 4.6 | 2 | 14.3 | 0 | 0 | 1 | 0.9 | ||||
| 4. Richmond, VA | 10 | 62 | 8 | 80.0 | 48 | 77.4 | 0 | 5 | 8.1 | 0 | 1 | 1.6 | 0 | 1 | 1.6 | 2 | 20.0 | 7 | 11.3 | |||
| 5. New Orleans, LA | 7 | 50 | 6 | 85.7 | 38 | 76.0 | 0 | 4 | 8.0 | 0 | 2 | 4.0 | 1 | 14.3 | 3 | 6.0 | 0 | 3 | 6.0 | |||
| 6. Cincinnati, OH | 18 | 164 | 12 | 66.8 | 119 | 72.5 | 1 | 5.5 | 14 | 8.5 | 1 | 5.5 | 5 | 3.1 | 2 | 11.1 | 5 | 3.1 | 2 | 11.1 | 21 | 12.8 |
| 7. Chicago, IL | 23 | 78 | 19 | 82.7 | 62 | 79.5 | 0 | 2 | 2.5 | 1 | 4.3 | 7 | 9.0 | 1 | 4.3 | 1 | 1.3 | 2 | 8.7 | 6 | 7.7 | |
| 8. St. Louis, MO | 4 | 56 | 4 | 100.0 | 41 | 73.2 | 0 | 6 | 10.7 | 0 | 3 | 5.4 | 0 | 1 | 1.8 | 0 | 5 | 8.9 | ||||
| 9. San Francisco, CA | 21 | 158 | 18 | 85.6 | 130 | 82.3 | 1 | 4.8 | 5 | 3.2 | 1 | 4.8 | 13 | 8.2 | 1 | 4.8 | 4 | 2.5 | 0 | 6 | 3.8 | |
| 10. Denver, CO | 11 | 14 | 7 | 63.6 | 12 | 85.8 | 2 | 18.2 | 0 | 0 | 1 | 7.1 | 0 | 0 | 2 | 18.2 | 1 | 7.1 | ||||
| 11. Atlanta, GA | 2 | 45 | 2 | 100.0 | 37 | 82.3 | 0 | 2 | 4.4 | 0 | 1 | 2.2 | 0 | 0 | 0 | 5 | 11.1 | |||||
| Washington, DC | 19 | 69 | 13 | 68.4 | 37 | 53.6 | 1 | 5.3 | 5 | 7.3 | 1 | 5.3 | 15 | 21.7 | 2 | 10.5 | 7 | 10.1 | 2 | 10.5 | 5 | 7.3 |
- 1 Percentages are computed horizontally by current fiscal year and total fiscal years.
- 2 Commenced operations October 1, 1981.
124 of 124 figures sit in a row or column sum that works out.
Reader’s notes
p. 205. 23 columns: stub, two "Total" columns, then five disposition groups (Affirmed in full; Modified; Remanded in full; Affirmed in part and remanded in part; Set aside), each with a Fiscal Year 1990 Number/Percent pair and a Cumulative fiscal years 1985-1989 Number/Percent pair. The level-2 heading is printed "Fiscal year 1990" under "Affirmed in full" but "Fiscal Year 1990" under the other four groups; both are kept as printed. Decimal points: this 1-bit scan drops many periods in the percent columns, so cells print as e.g. "78 9", "4 4", "7 8", "5 5", "18 2", "4 8", "9 0", "76 0", "8 1", "3 1", "6 0", "40", "71", "53". All have been written with the decimal point ("78.9", "4.4", ...). This is confirmed arithmetically: every row of percents sums to 100.0 and every column of counts foots exactly to the "Total all circuits" line (e.g. FY1990 counts 127+7+6+9+12=161; cumulative 727+50+58+23+73=931; and each of the 12 circuit rows' counts sums to its own two totals). So the column placement and digits are verified, not merely read. Em dashes: every blank percent cell in the body is printed as an em dash "—" (the table's nil symbol, always paired with a printed 0 in the Number column to its left). Per the instruction to treat dash cells as empty, these are transcribed as "". A reader who needs the distinction should know the image shows "—" there, never a truly blank cell. Row labels: the period after the circuit number and in "Phila., PA" / "St. Louis, MO" is faint or lost in the scan ("1 Boston, MA", "3. Phila , PA", "8. St Louis, MO", "9 San Francisco, CA"); punctuation has been regularised to the table's evident style. The last row, the D.C. Circuit, carries no number as printed. Printed roundings that do not match the division, transcribed as printed (they appear to be forced so each row sums to 100.0): Cincinnati, OH "Affirmed in full / Fiscal year 1990 / Percent" = 66.8 (12/18 = 66.7); San Francisco, CA same column = 85.6 (18/21 = 85.7); Denver, CO "Affirmed in full / Cumulative / Percent" = 85.8 (12/14 = 85.7); Atlanta, GA same column = 82.3 (37/45 = 82.2). Minor scan artifacts, not transcribed: a stray comma in the column heading "Num- ber," over Affirmed in full / Fiscal year 1990; specks before "12" (Total row, Set aside FY1990 Number), before "5" (St. Louis, Set aside Cumulative Number) and after "0.9" (Phila., Set aside Cumulative Percent); a speck under the Washington, DC remanded cells.
Source image
Source data: U.S. NLRB Annual Reports (public domain). Reconstruction by NLRB Stats Archive. Read by claude-opus-5 (effort max, prompt extract_v1) from the 300-dpi scan; stitched by page. Updated October 2026.