NLRB Stats Archive › Annual Reports › FY1990 › Size of Units in Representation Elections in Cases Closed, Fiscal Year 1990
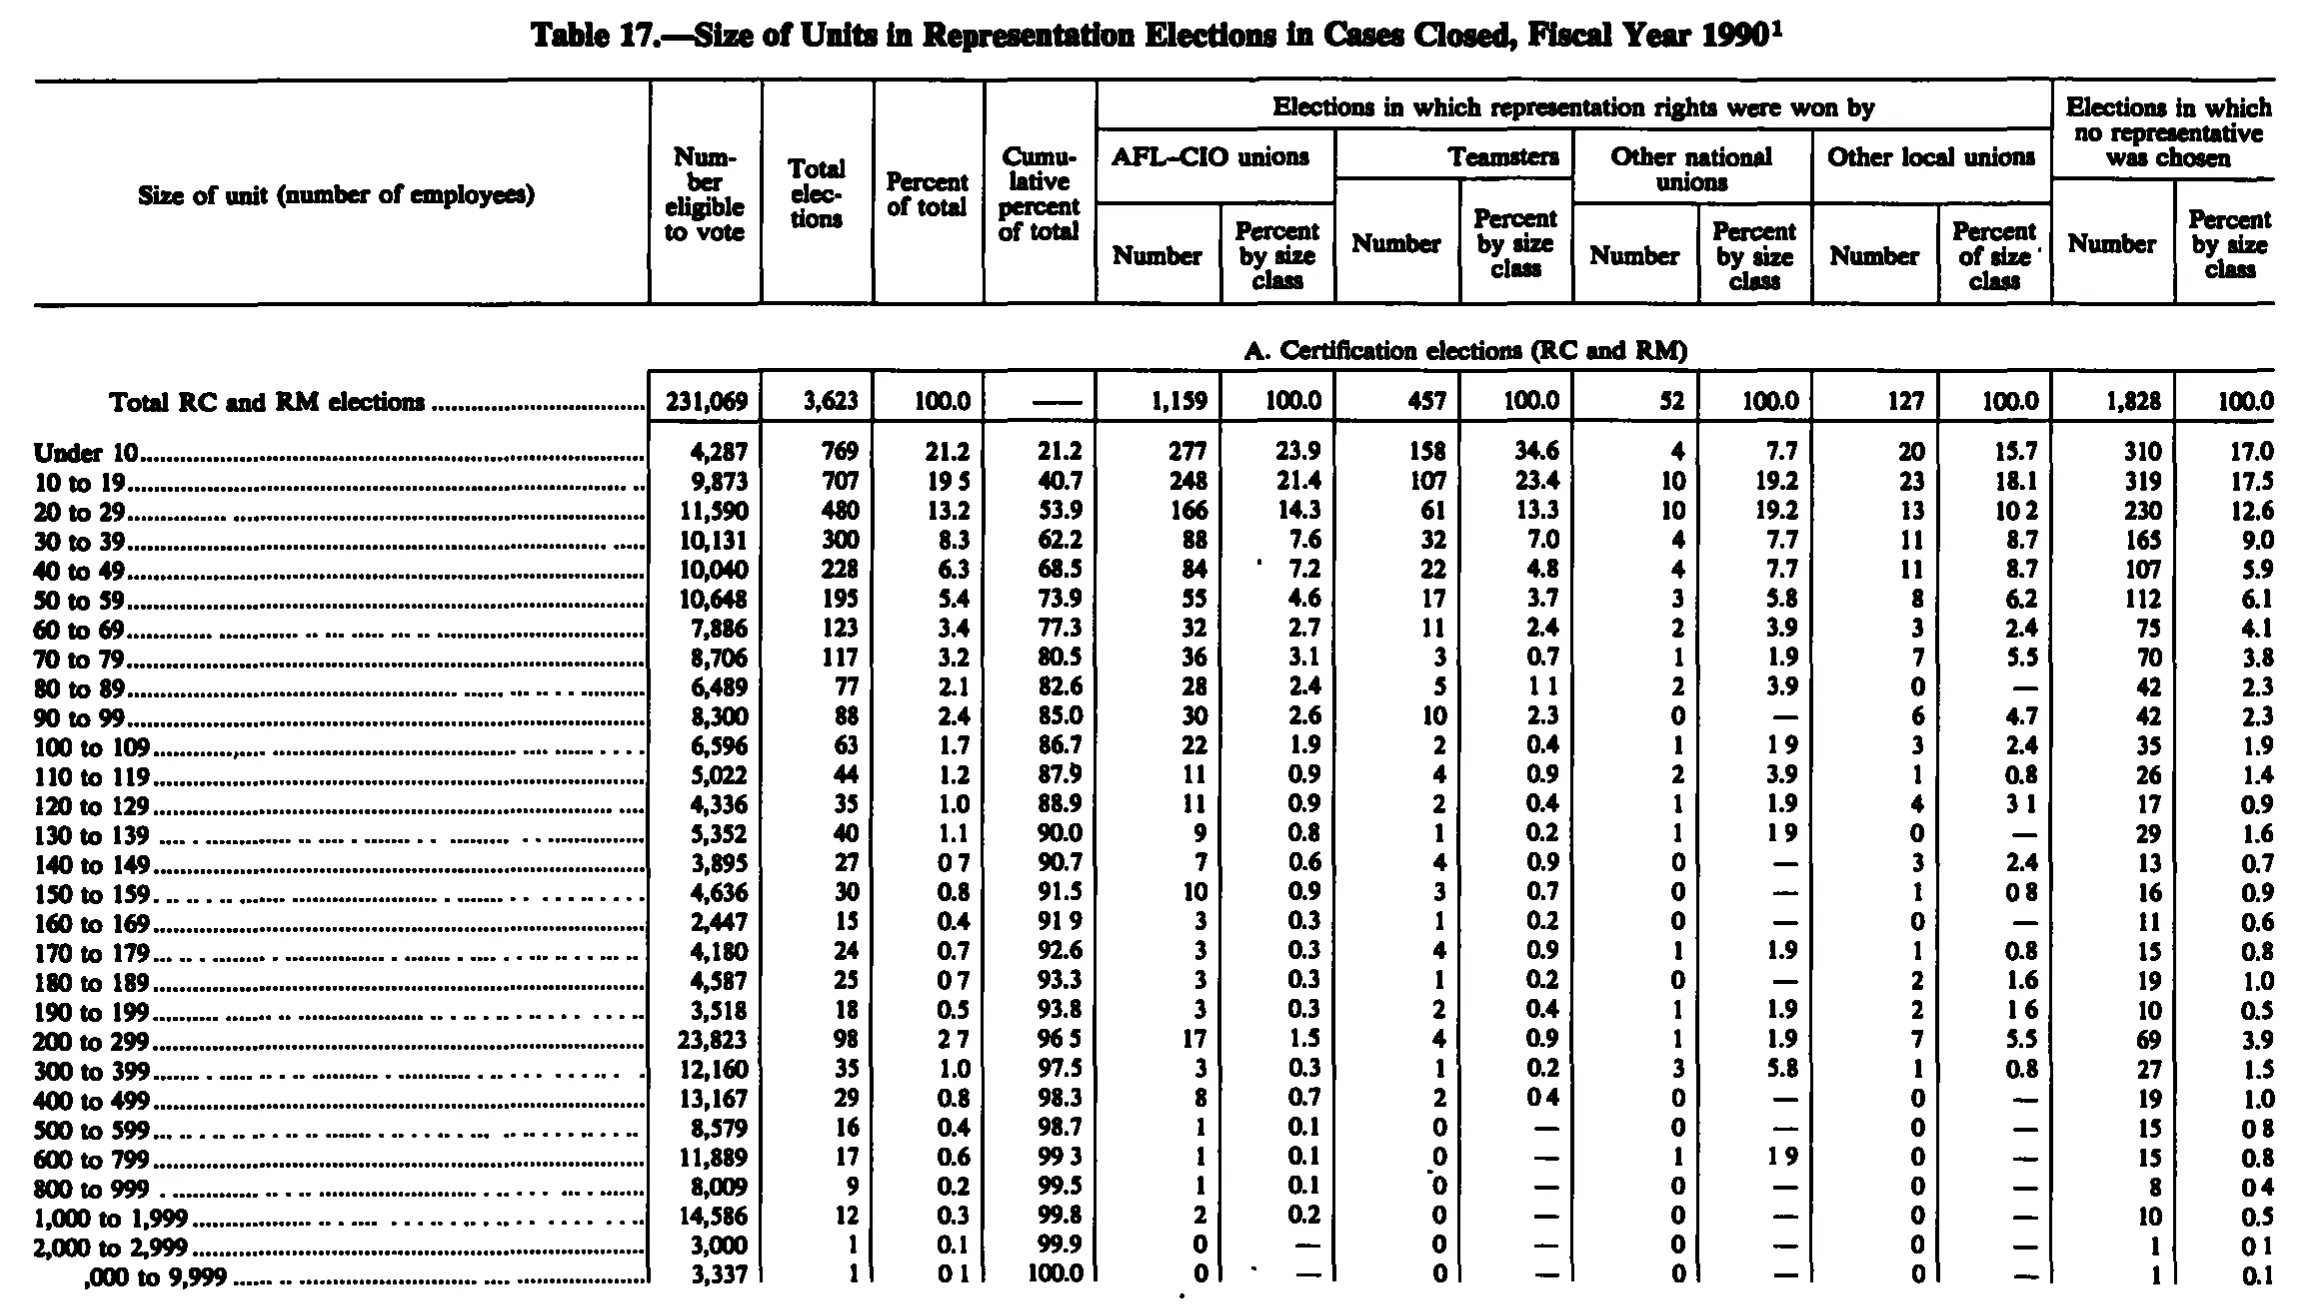
Size of Units in Representation Elections in Cases Closed, Fiscal Year 1990
Stitched from pp. 200–201.
| Size of unit (number of employees) | Number eligible to vote | Total elections | Percent of total | Cumulative percent of total | Elections in which representation rights were won by | Elections in which no representative was chosen | ||||||||
|---|---|---|---|---|---|---|---|---|---|---|---|---|---|---|
| Size of unit (number of employees) | Number eligible to vote | Total elections | Percent of total | Cumulative percent of total | AFL-CIO unions | Teamsters | Other national unions | Other local unions | Elections in which no representative was chosen | |||||
| Size of unit (number of employees) | Number eligible to vote | Total elections | Percent of total | Cumulative percent of total | Number | Percent by size class | Number | Percent by size class | Number | Percent by size class | Number | Percent of size class | Number | Percent by size class |
| A. Certification elections (RC and RM) | ||||||||||||||
| Total RC and RM elections | 231,069 | 3,623 | 100.0 | 1,159 | 100.0 | 457 | 100.0 | 52 | 100.0 | 127 | 100.0 | 1,828 | 100.0 | |
| Under 10 | 4,287 | 769 | 21.2 | 21.2 | 277 | 23.9 | 158 | 34.6 | 4 | 7.7 | 20 | 15.7 | 310 | 17.0 |
| 10 to 19 | 9,873 | 707 | 19.5 | 40.7 | 248 | 21.4 | 107 | 23.4 | 10 | 19.2 | 23 | 18.1 | 319 | 17.5 |
| 20 to 29 | 11,590 | 480 | 13.2 | 53.9 | 166 | 14.3 | 61 | 13.3 | 10 | 19.2 | 13 | 10.2 | 230 | 12.6 |
| 30 to 39 | 10,131 | 300 | 8.3 | 62.2 | 88 | 7.6 | 32 | 7.0 | 4 | 7.7 | 11 | 8.7 | 165 | 9.0 |
| 40 to 49 | 10,040 | 228 | 6.3 | 68.5 | 84 | 7.2 | 22 | 4.8 | 4 | 7.7 | 11 | 8.7 | 107 | 5.9 |
| 50 to 59 | 10,648 | 195 | 5.4 | 73.9 | 55 | 4.6 | 17 | 3.7 | 3 | 5.8 | 8 | 6.2 | 112 | 6.1 |
| 60 to 69 | 7,886 | 123 | 3.4 | 77.3 | 32 | 2.7 | 11 | 2.4 | 2 | 3.9 | 3 | 2.4 | 75 | 4.1 |
| 70 to 79 | 8,706 | 117 | 3.2 | 80.5 | 36 | 3.1 | 3 | 0.7 | 1 | 1.9 | 7 | 5.5 | 70 | 3.8 |
| 80 to 89 | 6,489 | 77 | 2.1 | 82.6 | 28 | 2.4 | 5 | 1.1 | 2 | 3.9 | 0 | 42 | 2.3 | |
| 90 to 99 | 8,300 | 88 | 2.4 | 85.0 | 30 | 2.6 | 10 | 2.3 | 0 | 6 | 4.7 | 42 | 2.3 | |
| 100 to 109 | 6,596 | 63 | 1.7 | 86.7 | 22 | 1.9 | 2 | 0.4 | 1 | 1.9 | 3 | 2.4 | 35 | 1.9 |
| 110 to 119 | 5,022 | 44 | 1.2 | 87.9 | 11 | 0.9 | 4 | 0.9 | 2 | 3.9 | 1 | 0.8 | 26 | 1.4 |
| 120 to 129 | 4,336 | 35 | 1.0 | 88.9 | 11 | 0.9 | 2 | 0.4 | 1 | 1.9 | 4 | 3.1 | 17 | 0.9 |
| 130 to 139 | 5,352 | 40 | 1.1 | 90.0 | 9 | 0.8 | 1 | 0.2 | 1 | 1.9 | 0 | 29 | 1.6 | |
| 140 to 149 | 3,895 | 27 | 0.7 | 90.7 | 7 | 0.6 | 4 | 0.9 | 0 | 3 | 2.4 | 13 | 0.7 | |
| 150 to 159 | 4,636 | 30 | 0.8 | 91.5 | 10 | 0.9 | 3 | 0.7 | 0 | 1 | 0.8 | 16 | 0.9 | |
| 160 to 169 | 2,447 | 15 | 0.4 | 91.9 | 3 | 0.3 | 1 | 0.2 | 0 | 0 | 11 | 0.6 | ||
| 170 to 179 | 4,180 | 24 | 0.7 | 92.6 | 3 | 0.3 | 4 | 0.9 | 1 | 1.9 | 1 | 0.8 | 15 | 0.8 |
| 180 to 189 | 4,587 | 25 | 0.7 | 93.3 | 3 | 0.3 | 1 | 0.2 | 0 | 2 | 1.6 | 19 | 1.0 | |
| 190 to 199 | 3,518 | 18 | 0.5 | 93.8 | 3 | 0.3 | 2 | 0.4 | 1 | 1.9 | 2 | 1.6 | 10 | 0.5 |
| 200 to 299 | 23,823 | 98 | 2.7 | 96.5 | 17 | 1.5 | 4 | 0.9 | 1 | 1.9 | 7 | 5.5 | 69 | 3.9 |
| 300 to 399 | 12,160 | 35 | 1.0 | 97.5 | 3 | 0.3 | 1 | 0.2 | 3 | 5.8 | 1 | 0.8 | 27 | 1.5 |
| 400 to 499 | 13,167 | 29 | 0.8 | 98.3 | 8 | 0.7 | 2 | 0.4 | 0 | 0 | 19 | 1.0 | ||
| 500 to 599 | 8,579 | 16 | 0.4 | 98.7 | 1 | 0.1 | 0 | 0 | 0 | 15 | 0.8 | |||
| 600 to 799 | 11,889 | 17 | 0.6 | 99.3 | 1 | 0.1 | 0 | 1 | 1.9 | 0 | 15 | 0.8 | ||
| 800 to 999 | 8,009 | 9 | 0.2 | 99.5 | 1 | 0.1 | 0 | 0 | 0 | 8 | 0.4 | |||
| 1,000 to 1,999 | 14,586 | 12 | 0.3 | 99.8 | 2 | 0.2 | 0 | 0 | 0 | 10 | 0.5 | |||
| 2,000 to 2,999 | 3,000 | 1 | 0.1 | 99.9 | 0 | 0 | 0 | 0 | 1 | 0.1 | ||||
| ,000 to 9,999 | 3,337 | 1 | 0.1 | 100.0 | 0 | 0 | 0 | 0 | 1 | 0.1 | ||||
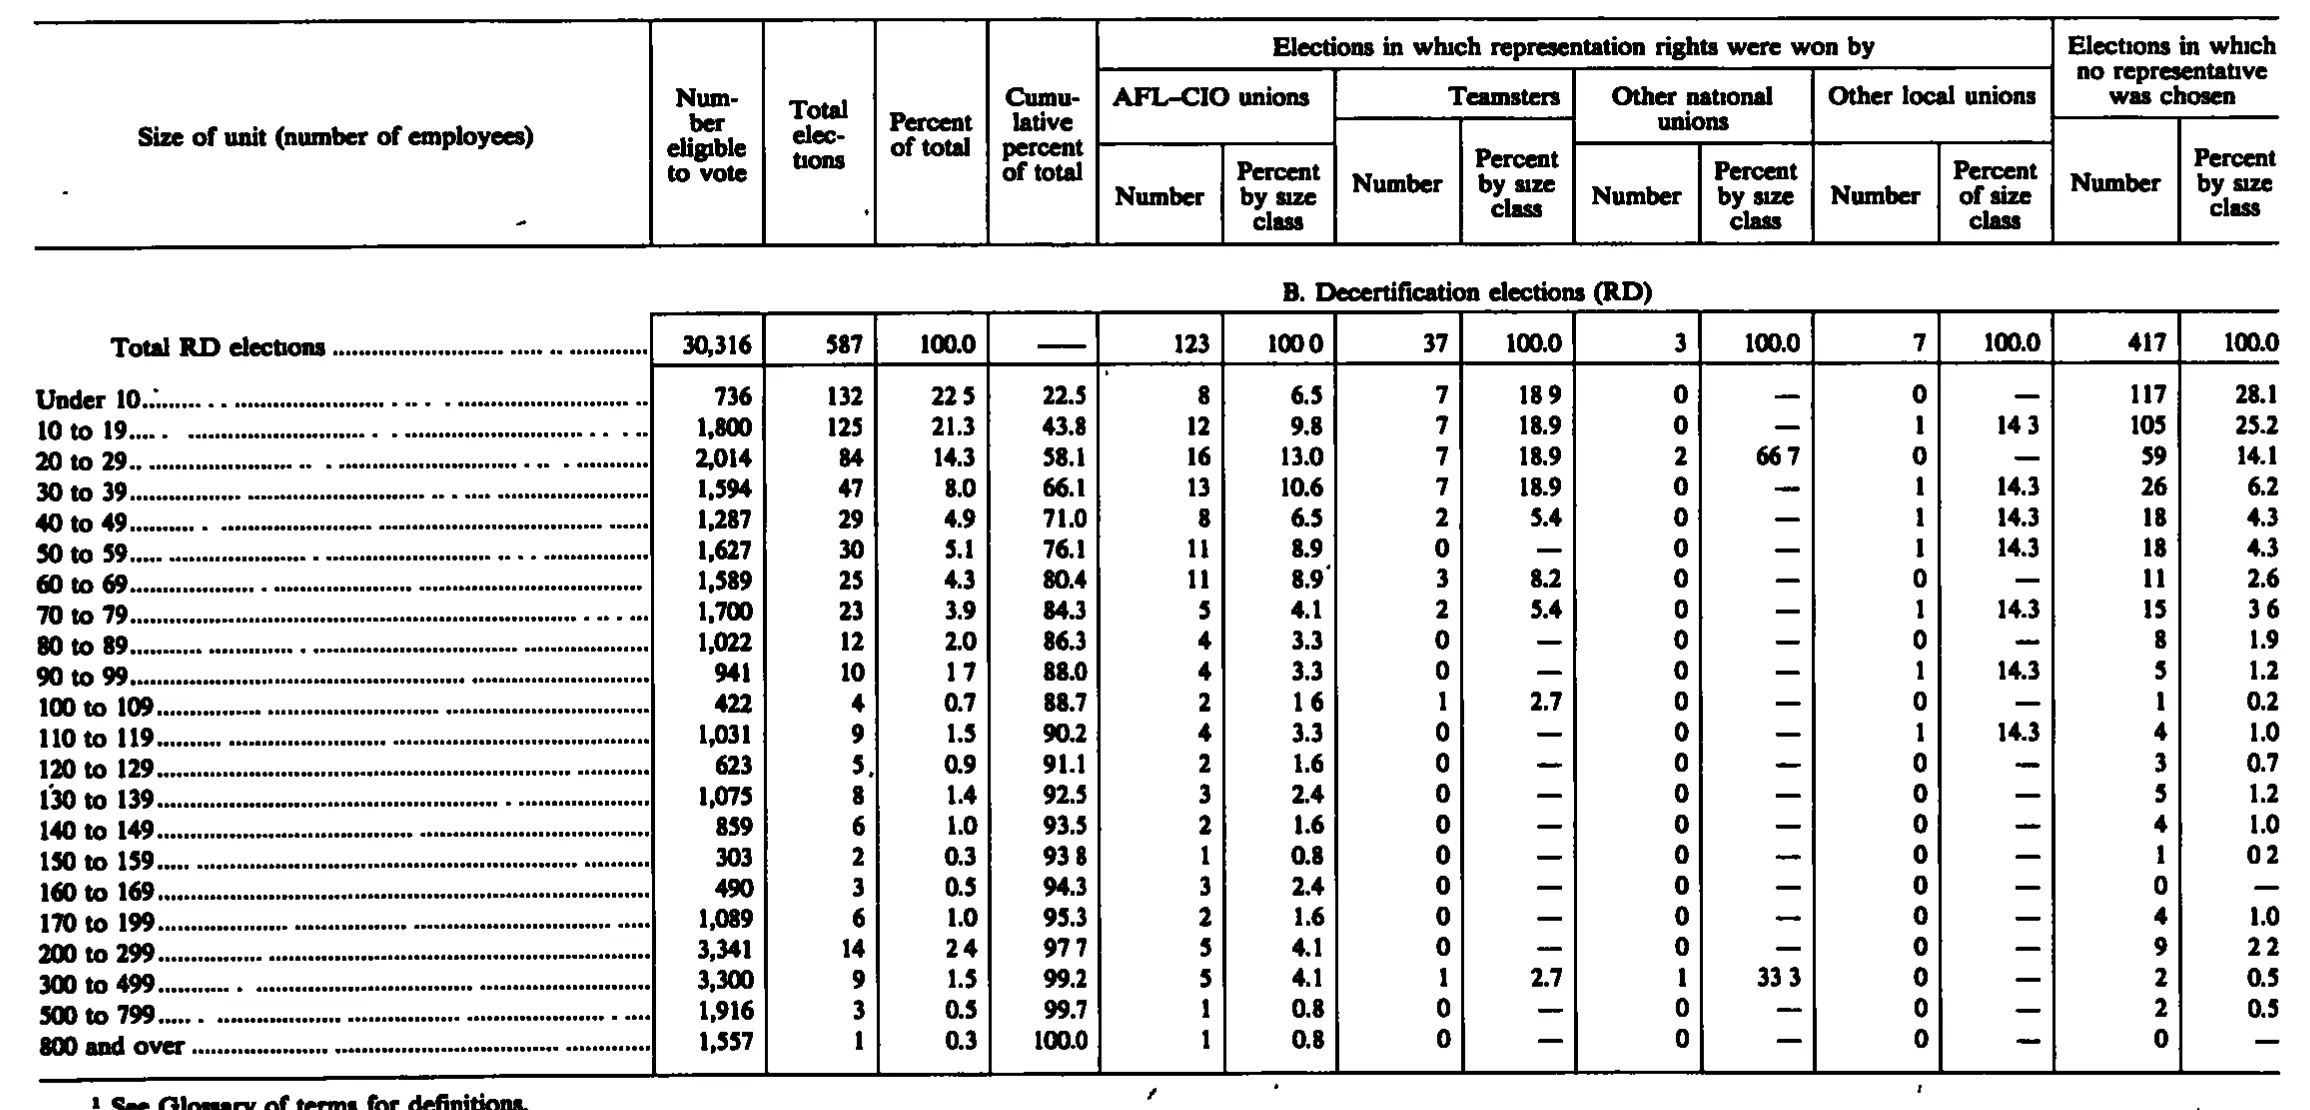
| B. Decertification elections (RD) | ||||||||||||||
| Total RD elections | 30,316 | 587 | 100.0 | 123 | 100.0 | 37 | 100.0 | 3 | 100.0 | 7 | 100.0 | 417 | 100.0 | |
| Under 10 | 736 | 132 | 22.5 | 22.5 | 8 | 6.5 | 7 | 18.9 | 0 | 0 | 117 | 28.1 | ||
| 10 to 19 | 1,800 | 125 | 21.3 | 43.8 | 12 | 9.8 | 7 | 18.9 | 0 | 1 | 14.3 | 105 | 25.2 | |
| 20 to 29 | 2,014 | 84 | 14.3 | 58.1 | 16 | 13.0 | 7 | 18.9 | 2 | 66.7 | 0 | 59 | 14.1 | |
| 30 to 39 | 1,594 | 47 | 8.0 | 66.1 | 13 | 10.6 | 7 | 18.9 | 0 | 1 | 14.3 | 26 | 6.2 | |
| 40 to 49 | 1,287 | 29 | 4.9 | 71.0 | 8 | 6.5 | 2 | 5.4 | 0 | 1 | 14.3 | 18 | 4.3 | |
| 50 to 59 | 1,627 | 30 | 5.1 | 76.1 | 11 | 8.9 | 0 | 0 | 1 | 14.3 | 18 | 4.3 | ||
| 60 to 69 | 1,589 | 25 | 4.3 | 80.4 | 11 | 8.9 | 3 | 8.2 | 0 | 0 | 11 | 2.6 | ||
| 70 to 79 | 1,700 | 23 | 3.9 | 84.3 | 5 | 4.1 | 2 | 5.4 | 0 | 1 | 14.3 | 15 | 3.6 | |
| 80 to 89 | 1,022 | 12 | 2.0 | 86.3 | 4 | 3.3 | 0 | 0 | 0 | 8 | 1.9 | |||
| 90 to 99 | 941 | 10 | 1.7 | 88.0 | 4 | 3.3 | 0 | 0 | 1 | 14.3 | 5 | 1.2 | ||
| 100 to 109 | 422 | 4 | 0.7 | 88.7 | 2 | 1.6 | 1 | 2.7 | 0 | 0 | 1 | 0.2 | ||
| 110 to 119 | 1,031 | 9 | 1.5 | 90.2 | 4 | 3.3 | 0 | 0 | 1 | 14.3 | 4 | 1.0 | ||
| 120 to 129 | 623 | 5 | 0.9 | 91.1 | 2 | 1.6 | 0 | 0 | 0 | 3 | 0.7 | |||
| 130 to 139 | 1,075 | 8 | 1.4 | 92.5 | 3 | 2.4 | 0 | 0 | 0 | 5 | 1.2 | |||
| 140 to 149 | 859 | 6 | 1.0 | 93.5 | 2 | 1.6 | 0 | 0 | 0 | 4 | 1.0 | |||
| 150 to 159 | 303 | 2 | 0.3 | 93.8 | 1 | 0.8 | 0 | 0 | 0 | 1 | 0.2 | |||
| 160 to 169 | 490 | 3 | 0.5 | 94.3 | 3 | 2.4 | 0 | 0 | 0 | 0 | ||||
| 170 to 199 | 1,089 | 6 | 1.0 | 95.3 | 2 | 1.6 | 0 | 0 | 0 | 4 | 1.0 | |||
| 200 to 299 | 3,341 | 14 | 2.4 | 97.7 | 5 | 4.1 | 0 | 0 | 0 | 9 | 2.2 | |||
| 300 to 499 | 3,300 | 9 | 1.5 | 99.2 | 5 | 4.1 | 1 | 2.7 | 1 | 33.3 | 0 | 2 | 0.5 | |
| 500 to 799 | 1,916 | 3 | 0.5 | 99.7 | 1 | 0.8 | 0 | 0 | 0 | 2 | 0.5 | |||
| 800 and over | 1,557 | 1 | 0.3 | 100.0 | 1 | 0.8 | 0 | 0 | 0 | 0 | ||||
- 1 See Glossary of terms for definitions.
292 of 292 figures sit in a row or column sum that works out.
Reader’s notes
p. 200. CROP IS INCOMPLETE. The image shows only panel "A. Certification elections (RC and RM)" and ends abruptly after the last size-class row; the table almost certainly continues on this page or the next with a panel B (decertification elections) and with footnote 1, which is cued by the superscript 1 on the caption but is not printed inside the crop. Hence `footnotes` is empty. LAST ROW LABEL. The bottom row's label is printed as ",000 to 9,999" — the leading digit is lost at the edge of the crop/scan. Given the preceding row is "2,000 to 2,999" and the class must close the series, it is almost certainly "3,000 to 9,999", but I transcribed only the characters that are legible. DROPPED DECIMAL POINTS. This is a 1-bit scan in which the period of a decimal number is sometimes lost, leaving a blank gap (e.g. "19 5", "0 7"). Every column affected is a one-decimal percent or cumulative-percent column where all other entries carry exactly one decimal place, so I read the gap as a decimal point. The cells where the point is not visible in the image are: "10 to 19" Percent of total (19.5); "20 to 29" Other local unions Percent (10.2); "80 to 89" Teamsters Percent (1.1); "100 to 109" Other national unions Percent (1.9); "120 to 129" Other local unions Percent (3.1); "130 to 139" Other national unions Percent (1.9); "140 to 149" Percent of total (0.7); "150 to 159" Other local unions Percent (0.8); "160 to 169" Cumulative percent (91.9); "180 to 189" Percent of total (0.7); "190 to 199" Other local unions Percent (1.6); "200 to 299" Percent of total (2.7) and Cumulative percent (96.5); "400 to 499" Teamsters Percent (0.4); "500 to 599" no-representative Percent (0.8); "600 to 799" Cumulative percent (99.3) and Other national unions Percent (1.9); "800 to 999" no-representative Percent (0.4); "2,000 to 2,999" no-representative Percent (0.1); last row Percent of total (0.1). OTHER POINTS. The Cumulative percent cell of "Total RC and RM elections" holds a dash rule and is transcribed as "". Em dashes standing for "no value" in the percent columns are likewise "". The column heading over the second "Other local unions" column reads "Percent of size class" in the original, not "Percent by size class" as in the four parallel columns; transcribed as printed. "AFL-CIO" is set with an en dash in the original. A stray ink speck sits to the left of "7.2" in the "40 to 49" row (AFL-CIO Percent) and to the left of the em dash in the last row's AFL-CIO Percent; both are specks, not characters. ARITHMETIC. Not recomputed per instructions, but note that the Percent-of-total column visibly does not reconcile with the Cumulative column at a couple of steps (e.g. 21.2 + 19.5 = 40.7 is fine, but 0.7 after 90.0 gives 90.7 while 2.7 after 93.8 gives 96.5), consistent with ordinary rounding in the source rather than a transcription error.
p. 201. Grid is 15 columns: stub, four single-level columns (Number eligible to vote; Total elections; Percent of total; Cumulative percent of total), four Number/Percent pairs under "Elections in which representation rights were won by", and a final Number/Percent pair under "Elections in which no representative was chosen". The "Other local unions" sub-heading reads "Percent of size class" (not "by"), as printed. Scan quality: the decimal point is faint or dropped in a number of cells, which print as e.g. "100 0", "22 5", "18 9". I have written these with the decimal point since the digit groups and the column arithmetic make the intended value unambiguous. Affected cells: Total RD elections / AFL-CIO Percent ("100 0"); Under 10 / Percent of total ("22 5") and Teamsters Percent ("18 9"); 10 to 19 / Other local Percent ("14 3"); 20 to 29 / Other national Percent ("66 7"); 70 to 79 / no-representative Percent ("3 6"); 90 to 99 / Percent of total ("1 7"); 100 to 109 / AFL-CIO Percent ("1 6"); 150 to 159 / Cumulative percent ("93 8") and no-representative Percent ("0 2"); 200 to 299 / Percent of total ("2 4"), Cumulative percent ("97 7") and no-representative Percent ("2 2"); 300 to 499 / Other national Percent ("33 3"). Two cells look like printer's errors but are transcribed as printed: row "800 and over", Percent of total is printed 0.3 although 1 of 587 elections is 0.2 (the cumulative column nonetheless runs 99.7 to 100.0); row "60 to 69", Teamsters Percent by size class is printed 8.2 although 3 of 37 is 8.1. The Cumulative percent cell on the "Total RD elections" row holds a dash rule and is given as "". Every em-dash cell in the percent columns is likewise "". All column sums check against the totals row (587 elections; 123 AFL-CIO; 37 Teamsters; 3 other national; 7 other local; 417 no representative), which supports the column assignment. The footnote line at the foot of the crop is clipped by the bottom edge but is legible; the caption and the "A." panel of the table are on the preceding page and are not on this crop.
Source image
Source data: U.S. NLRB Annual Reports (public domain). Reconstruction by NLRB Stats Archive. Read by claude-opus-5 (effort max, prompt extract_v1) from the 300-dpi scan; stitched by page. Updated October 2026.