NLRB Stats Archive › Annual Reports › FY1990 › Industrial distribution of representation elections held in cases closed
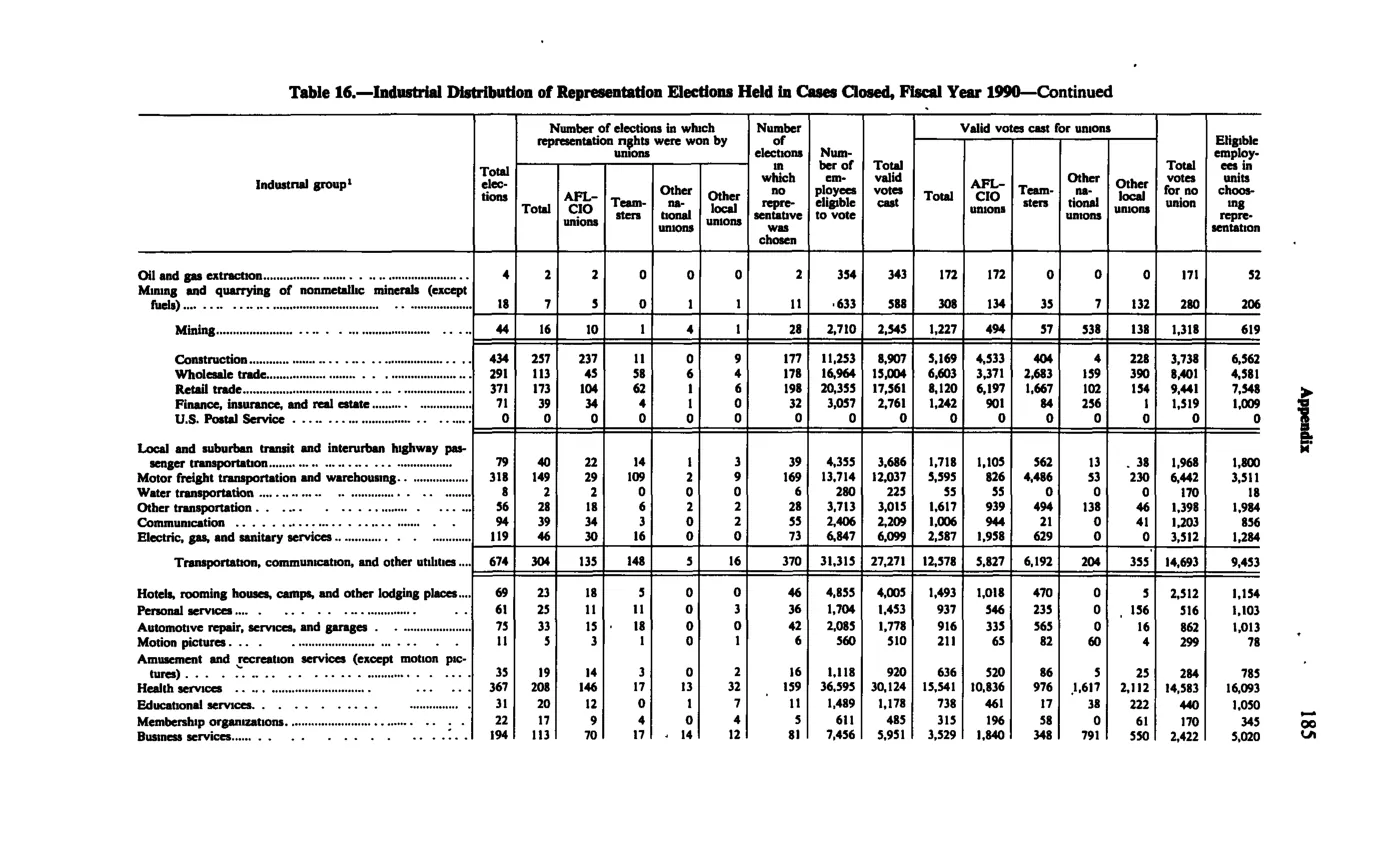
Industrial distribution of representation elections held in cases closed
| Industrial group | Total elections | Number of elections in which representation rights were won by unions | Number of elections in which no representative was chosen | Total number of employees eligible to vote | Valid votes cast for unions | Eligible employees in elections in which employees chose no representation | |||||||||
|---|---|---|---|---|---|---|---|---|---|---|---|---|---|---|---|
| Industrial group | Total elections | Total | AFL-CIO unions | Teamsters | Other national unions | Other local unions | Number of elections in which no representative was chosen | Total number of employees eligible to vote | Total valid votes cast | AFL-CIO unions | Teamsters | Other national unions | Other local unions | Eligible employees in elections in which employees chose no representation | |
| Mining | 44 | 16 | 10 | 1 | 4 | 1 | 28 | 2,700 | 2,345 | 1,227 | 494 | 57 | 538 | 138 | 1,118 |
Source image
Source data: U.S. NLRB Annual Reports (public domain). Reconstruction by NLRB Stats Archive. Updated June 2026.